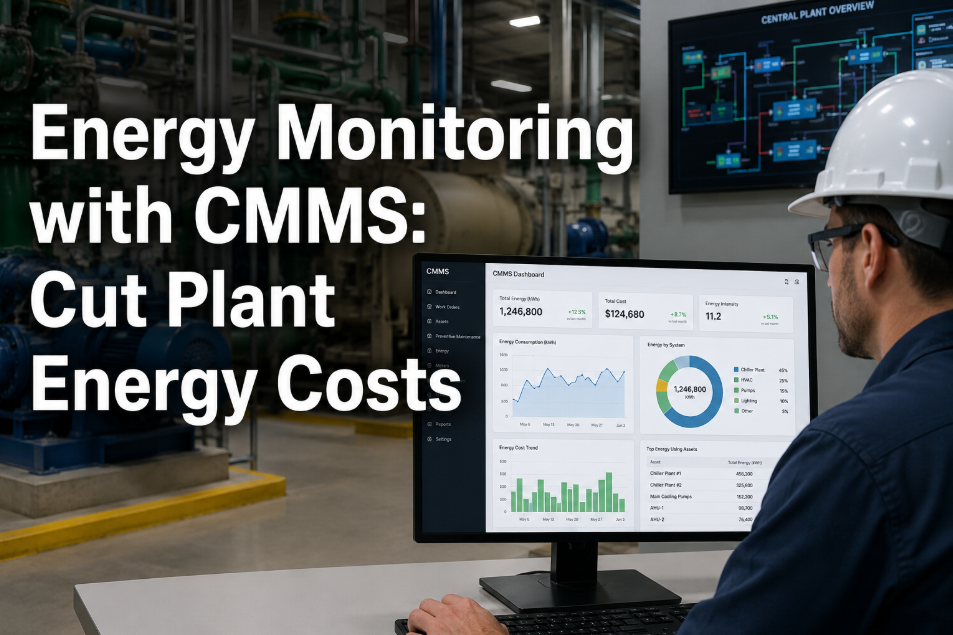
Environmental, Social, and Governance reporting moved from a voluntary investor relations exercise to a regulatory requirement in 2025 — and maintenance departments are sitting on 60% of the data ESG frameworks actually need. Energy consumption per asset, refrigerant leak volumes, waste oil generation, equipment efficiency degradation — all of this data already flows through maintenance workflows. The problem is that in most organizations, it stays trapped in disconnected CMMS records, spreadsheets, and contractor invoices that never reach the sustainability team. Organizations using platforms like OxMaint's unified CMMS are closing this gap by automatically feeding maintenance-generated environmental data into ESG dashboards — eliminating the manual data collection that consumes an average of 320 hours per reporting cycle and reducing Scope 1 and 2 emissions reporting errors by 47%.
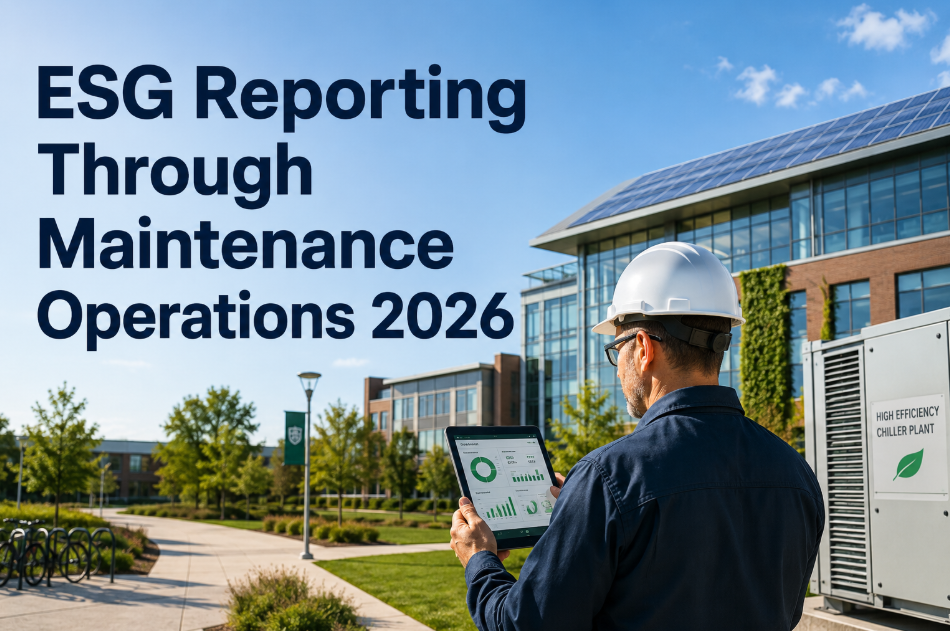
ESG Reporting Through Maintenance Operations 2026
How your CMMS data feeds ESG dashboards for energy, emissions, and waste compliance — turning maintenance records into investor-grade sustainability reporting without a separate data collection effort.
Why Maintenance Is the Missing Link in ESG Reporting
ESG reporting frameworks — CSRD, ISSB, SEC Climate Disclosure, GRI — all require operational data that sustainability teams typically do not own. Maintenance departments generate this data daily but rarely recognize it as ESG-relevant.
The 2026 ESG Regulatory Landscape by Region
ESG reporting requirements vary significantly by region — and penalties for non-compliance are escalating. Here is where each target market stands and what maintenance teams need to prepare for.
Scope 1 and 2 emissions disclosure mandatory for public companies. Maintenance data required for refrigerant tracking, fleet emissions, and energy-intensive equipment reporting. OSHA compliance records feed social metrics. Non-compliance penalties up to $1.8M per filing.
Corporate Sustainability Reporting Directive requires 1,200+ data points including asset energy efficiency, waste management, and worker safety metrics. Building Safety Act adds facility-specific compliance. Penalties reach 5% of global turnover.
Vision 2030 smart building mandates include energy performance certificates and carbon intensity reporting. Free zone operators face ESG disclosure requirements from 2026. Maintenance-generated energy data is central to compliance.
National Greenhouse and Energy Reporting expanded scope. Mandatory climate disclosures for large entities from 2025. High labor costs make automated ESG data collection from CMMS especially valuable — saving 400+ hours per cycle.
Supply Chain Due Diligence Act plus CSRD transposition requires documentation of environmental impact across operations. Industrial maintenance records form the evidence base for energy efficiency, waste, and safety compliance claims.
Greenhouse Gas Reporting Program expanded to include more facility types. Canadian Securities regulators aligning with ISSB standards. Building energy benchmarking programs in major provinces require per-asset consumption data.
How OxMaint Bridges Maintenance Data to ESG Dashboards
OxMaint does not replace your ESG reporting platform — it feeds it with accurate, timestamped, asset-level operational data that eliminates the manual collection bottleneck. Here is how the data pipeline works.
Every maintenance work order in OxMaint captures energy readings, material usage, waste volumes, and chemical quantities as structured data fields — not free-text notes. Technicians enter values on mobile during task completion. No separate data collection step required.
OxMaint's reporting engine automatically categorizes maintenance data into ESG-relevant streams: energy consumption (Scope 2), refrigerant loss (Scope 1), waste generation, safety incidents, and compliance completion rates. No manual mapping needed.
For multi-site organizations, OxMaint aggregates ESG metrics across the entire portfolio — property by property, system by system. Investors and ownership groups get consolidated sustainability performance data without manual spreadsheet consolidation.
Structured data exports feed directly into ESG reporting platforms — Workiva, Diligent, Sphera, or custom dashboards. API-based integration eliminates re-keying errors and ensures audit-ready traceability from raw maintenance record to published ESG metric.
Ready to turn your existing maintenance data into ESG-ready reporting? Start a free trial to see your data structured for sustainability compliance, or book a demo with our team for a guided ESG data walkthrough.
Before vs After: ESG Data Collection with CMMS Integration
The contrast between manual and CMMS-driven ESG data collection is not incremental — it is transformational. Here is what changes when maintenance data flows automatically into sustainability reporting.
Key ESG Metrics Your CMMS Should Be Tracking
Not all maintenance data is ESG-relevant. These are the specific metrics that map directly to major ESG framework requirements — and that OxMaint captures automatically during normal maintenance workflows.
Tracked through HVAC maintenance logs. Average facility loses 12-18% refrigerant charge annually. OxMaint logs every recharge event with volume, type, and GWP factor for automatic emissions calculation.
Per-asset energy monitoring reveals which equipment consumes disproportionate energy. Facilities typically find 15-20% of assets consuming 60% of total energy — targeted maintenance on these assets drives the highest ESG improvement.
PM work orders capture waste fluid volumes at every oil change, coolant flush, and chemical replacement. OxMaint aggregates these into quarterly waste generation reports by asset category and disposal type.
Work orders linked to safety incidents create a direct correlation between maintenance quality and worker safety. Facilities with 90%+ PM compliance see 40% fewer equipment-related injuries — a powerful ESG social metric.
Cooling tower maintenance logs capture water treatment chemical usage and blowdown volumes. Poorly maintained towers consume 30% more water — maintenance quality directly impacts water ESG metrics.
Environmental permit conditions often require specific maintenance activities on defined schedules. OxMaint tracks these as compliance-tagged PMs with automatic escalation for overdue tasks — providing governance metrics with zero additional effort.
Maintenance Actions That Move ESG Scores
ESG improvement is not just about reporting — it is about operational changes that produce measurable environmental and social outcomes. These are the highest-impact maintenance actions for each ESG dimension.
Replace motors based on efficiency degradation data, not age. A motor at 85% efficiency wastes 15% of consumed energy as heat. OxMaint's condition scoring identifies these inefficient assets before they fail — turning maintenance events into energy upgrades.
Schedule regular leak checks as PM tasks with mandatory recharge volume logging. Facilities tracking recharge frequency per unit identify chronic leakers — often responsible for 70% of total refrigerant loss from just 10% of HVAC units.
Tag safety-critical assets in OxMaint and enforce zero-tolerance PM compliance. Guard rails, pressure relief valves, emergency shutoffs, and fire suppression systems get automatic escalation when PMs are overdue — protecting both workers and ESG social scores.
Replace calendar-based oil changes with condition-based fluid analysis. Many facilities change lubricants 2-3x more often than necessary. Oil analysis PMs extend change intervals by 40-60% while reducing waste oil generation — a direct environmental ESG win.
Every one of these actions is trackable, reportable, and auditable when executed through OxMaint. Want to map your maintenance operations to ESG framework requirements? Start a free trial and explore the ESG data pipeline, or book a demo to see a portfolio-level ESG dashboard.
Frequently Asked Questions
Does OxMaint replace our existing ESG reporting platform?
What ESG frameworks does OxMaint data support?
How quickly can we start generating ESG-relevant data from maintenance operations?
Can OxMaint track Scope 3 emissions from maintenance supply chain?
Your Maintenance Data Is Already ESG Data — Start Using It
The maintenance department generates 60% of the operational data ESG frameworks require. OxMaint structures, aggregates, and exports this data automatically — eliminating hundreds of hours of manual collection and reducing reporting errors to under 3%. See how your maintenance records map to ESG compliance requirements in a 30-minute walkthrough.