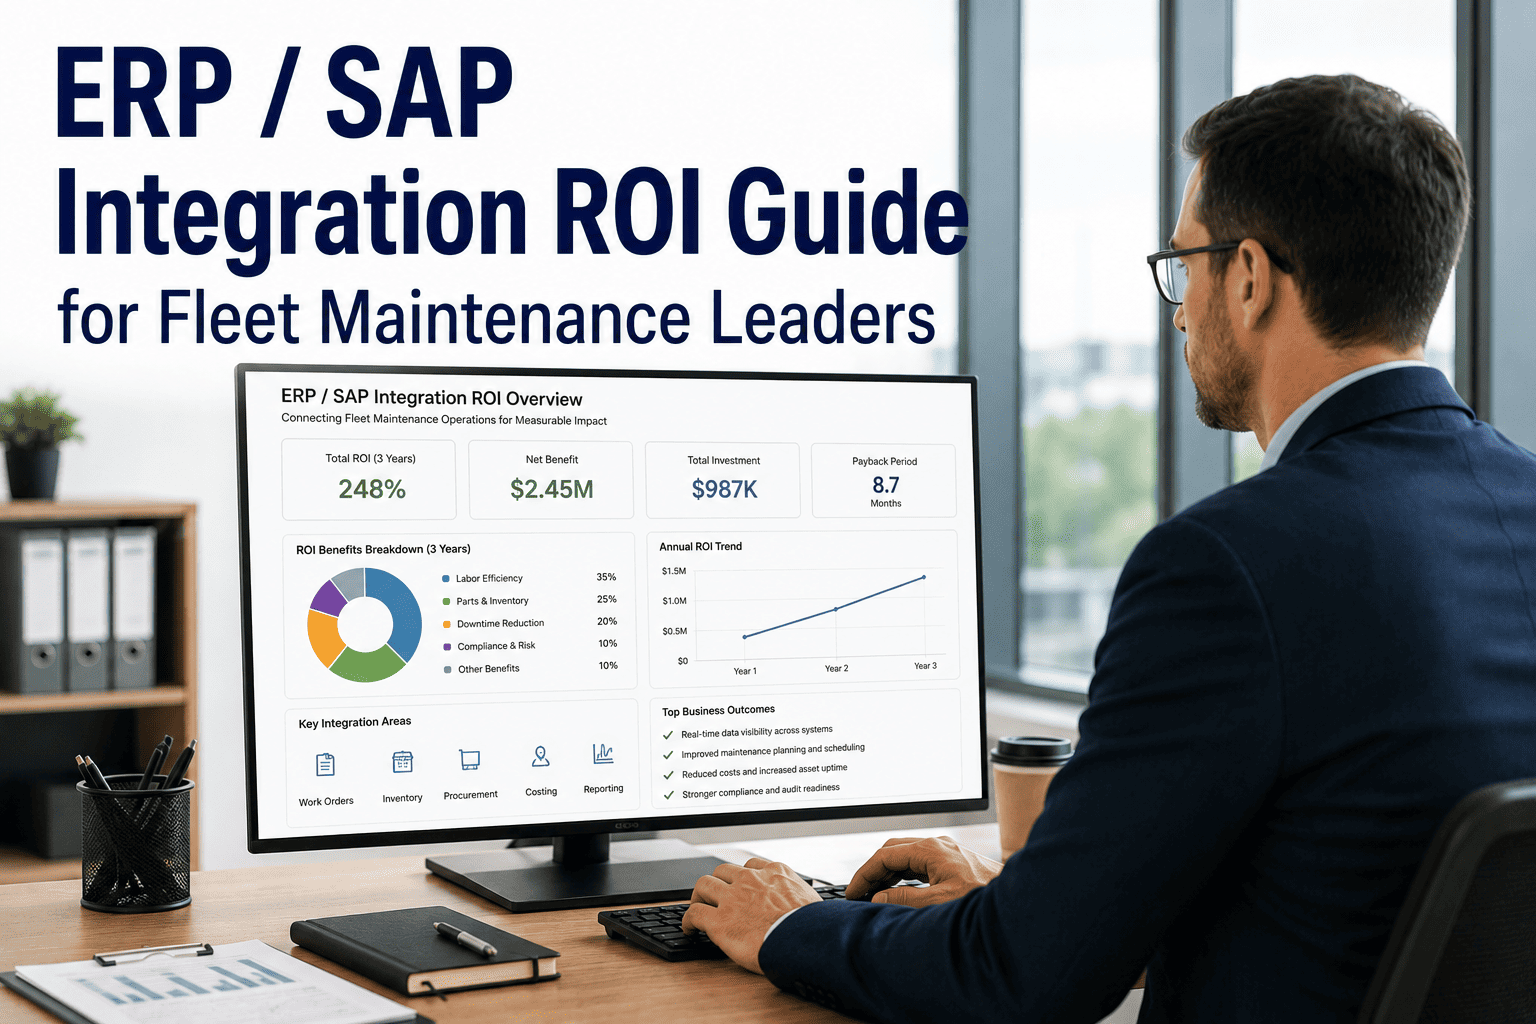
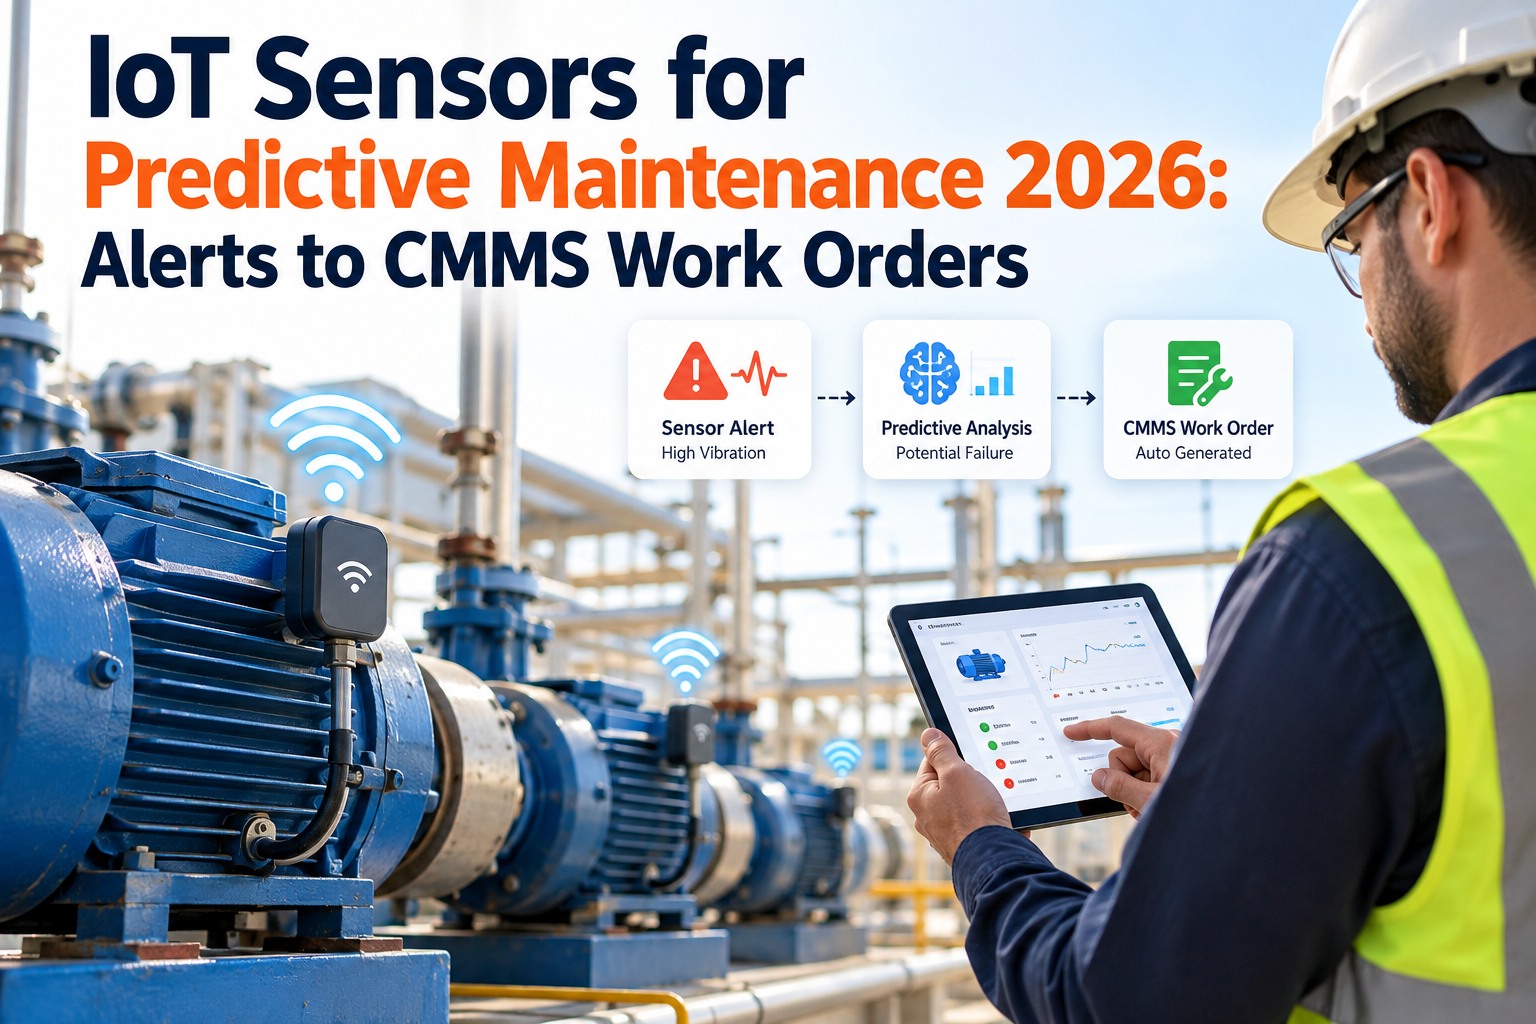
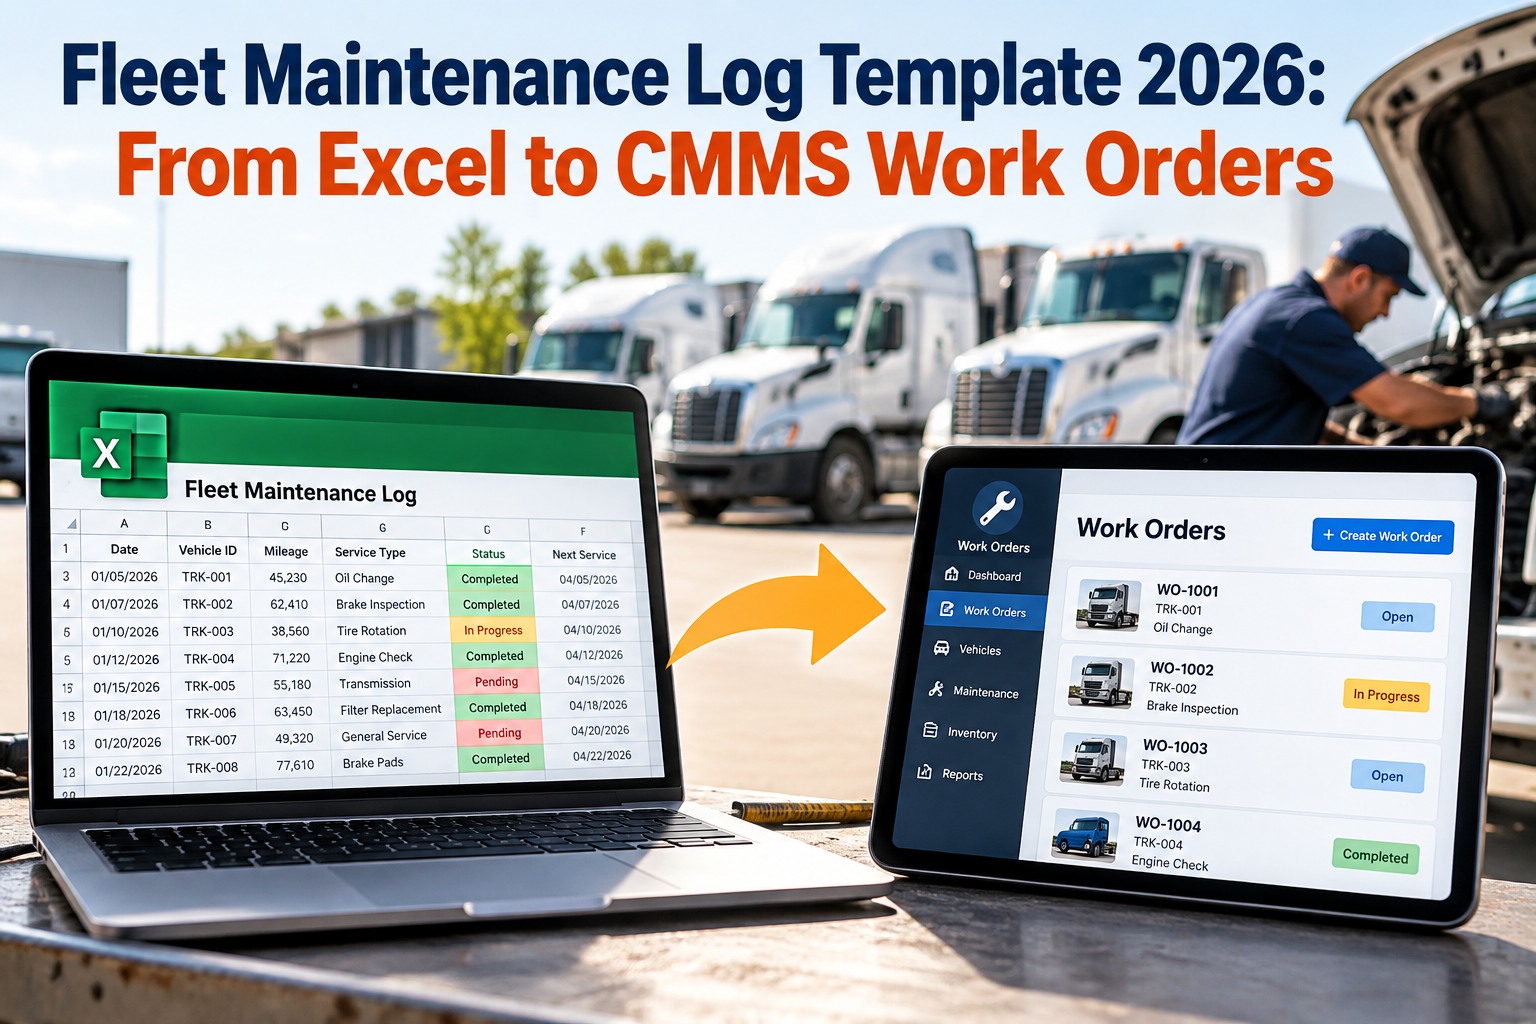
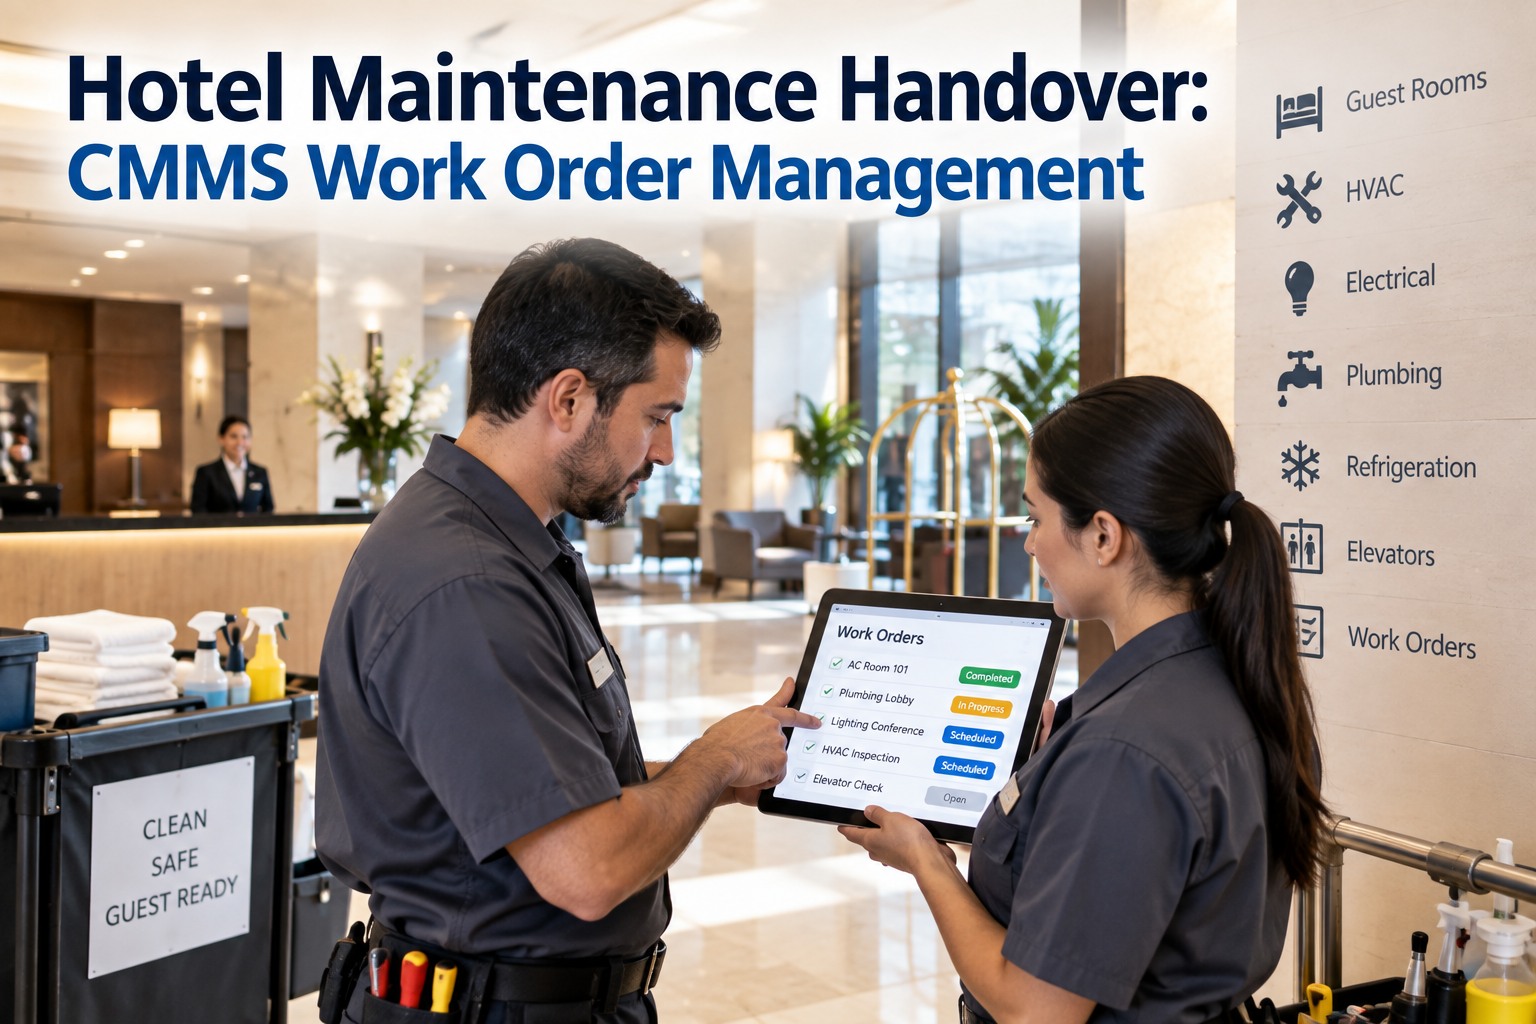
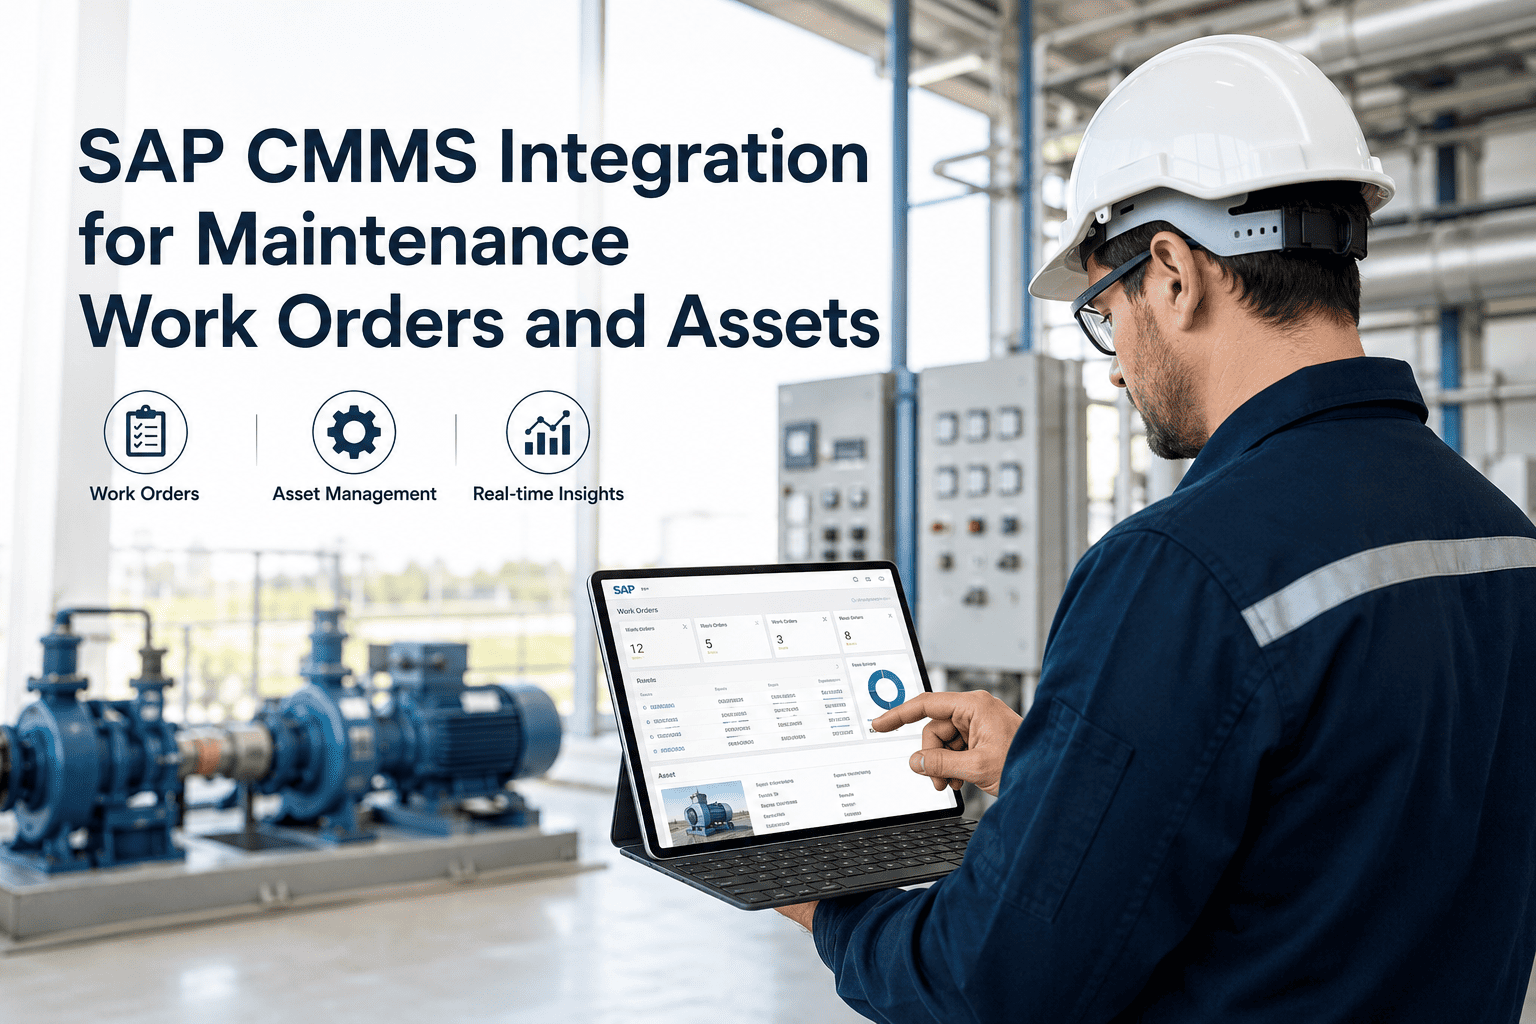
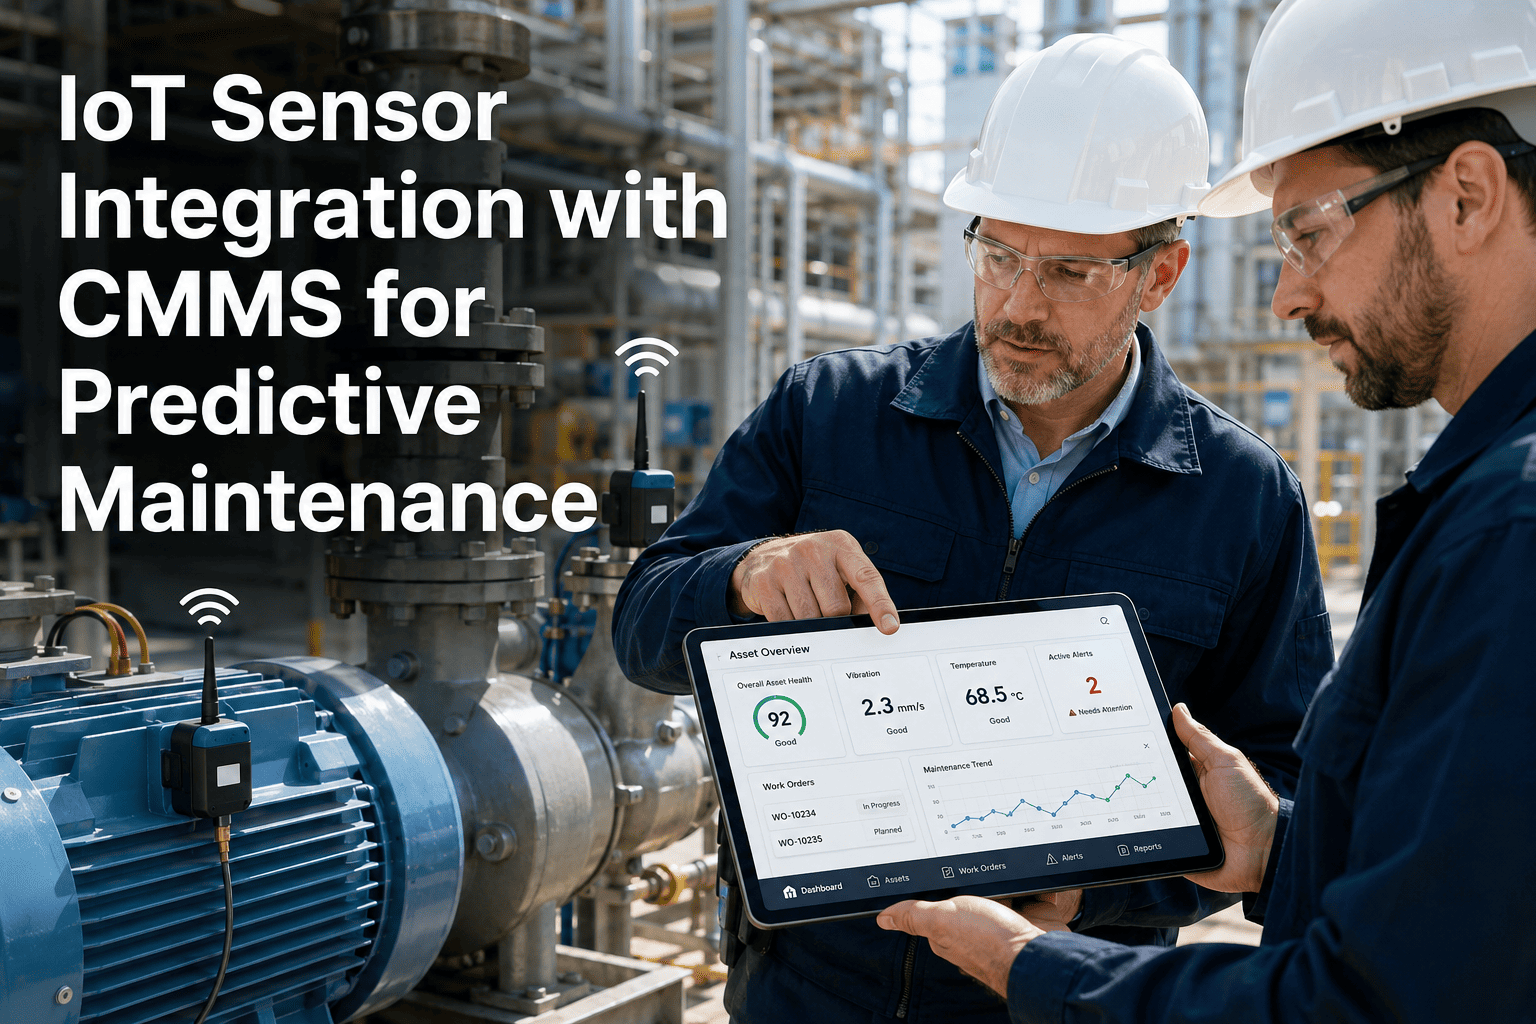
For most fleet operations, maintenance and finance run as parallel universes. The CMMS knows what was repaired, which part was used, and how many hours it took; the ERP owns the cost centers, the inventory ledger, and the purchase orders — and the only thing connecting them is a planner re-typing the same numbers into a second system. That gap is expensive: roughly two-thirds of mid-market organizations run their CMMS and ERP disconnected, burning 14 to 22 hours a week on duplicate entry and reconciliation, and leaving leaders unable to answer a simple question like true cost of ownership without days of spreadsheet work. This guide lays out the financial case for closing that gap — the value streams, a worked example, and the payback — and shows how OxMaint's ERP / SAP integration delivers it, or book a demo to model the return on your own fleet.
Maintenance KPI / ERP & SAP Integration
ERP / SAP Integration ROI Guide for Fleet Maintenance Leaders
Connect your CMMS to SAP and the rest of your ERP, and turn duplicate data entry into a measurable return — less downtime, cleaner inventory, and maintenance cost that lands in the right cost center the moment a job closes.
4–6×
cumulative 3-year return on project cost
15–30%
Less unplanned downtime in 6 months
85%
Less manual data entry
12–18 mo
Typical payback period
The cost of running maintenance and finance apart
Before the savings, it's worth naming what disconnected systems cost every week. These are the leaks an integration closes first.
Duplicate data entry across two systems
14–22 hrs/wk
Planner re-keying work-order costs into the ERP journal
6–9 hrs/wk
Answering "what's our true cost of ownership?"
~3 days
Urgent part: paper requisition, manual entry, approval routing
30-min fix → 1 wk
Major repairs never posted to the fixed-asset register
CapEx drift
The six ROI value streams
A CFO-credible case counts more than parts spend. Integrated data unlocks six distinct streams that compound over time — these are typical ranges, best confirmed against your own baseline.
| Value stream | What drives the saving | Typical impact |
|---|
| Unplanned downtime | 15–30% fewer breakdowns; reactive runs ~3× planned cost | Largest stream |
| Labor productivity | Mobile work orders; no re-keying into SAP | +5–20% |
| Inventory carrying cost | Live parts sync; fewer stockouts and dead stock | ~25–30% lower |
| Manual data entry | Enter once; it posts everywhere automatically | Up to 85% less |
| Compliance exposure | Automated inspections catch defects early | $2K–$16K/avoided OOS |
| Deferred replacement | Condition-based PM extends component life | 15–25% longer life |
Model the return on your fleet
OxMaint tracks every ROI input automatically and generates a board-ready financial summary from your own work-order data.
How the integration works
The best integrations aren't overnight file dumps — they're a live, two-way bridge. SAP stays the system of record; the CMMS is the mobile execution layer. One closed work order updates everything downstream at once.
One closed work order updates:
SAP PM
Equipment history and remaining useful life
SAP MM
Inventory decremented; auto requisition below reorder
SAP FI / CO
Cost posted to the right cost center at close
HR
Technician labor hours captured
Asset register
Major repairs feed depreciation and CapEx
A worked example: 50-vehicle fleet
Illustrative annual value for a mixed 50-vehicle fleet. Your figures will differ, but the structure is what makes the case defensible to finance.
Downtime avoided (2 hrs/veh/mo × $100 × reduction)up to $120,000
Reactive-to-planned conversion (predictive signals)$30,000–$55,000
Parts & inventory carrying savings$15,000–$30,000
Compliance penalty avoidance$10,000–$40,000
Admin time recovered (reconciliation hours)$8,000–$15,000
Total annual value$90,000–$248,000
Less software cost− under $25,000
Net annual valuestrongly positive
Most fleets reach payback in 12 to 18 months — faster when downtime cost per vehicle is high, because the downtime stream alone often covers the investment.
Phased rollout and payback
Integrate in stages so each connection is validated before the next, proving value incrementally instead of betting on a big-bang cutover.
1
Asset / vehicle master sync
2
Maintenance cost posting
A typical mid-market integration runs four to eight weeks end to end — versus the four-to-nine-month middleware projects that gave ERP integration its reputation.
Expert Review
"When I build the ROI case for the board, I lead with the number finance can't argue with: the hours my planners lose re-typing the same data into the ERP, and the days it takes to produce a true cost of ownership. Those are real, current, and embarrassing once you say them out loud. Then I layer on the downtime stream, because reactive work runs about three times planned and idle trucks don't earn. The mistake leaders make is buying the integration and then under-investing in adoption — a connector is only as valuable as the data flowing through it, and if technicians won't use a clunky interface, the whole ROI evaporates. Mobile-first execution is what turns the model into money."
Reviewed by a fleet maintenance director, 18+ years in fleet operations and ERP-integrated maintenance programs.
See your board-ready ROI report
Walk through the value streams mapped to your SAP modules, with a financial summary generated from real fleet data.
Frequently asked questions
QWhat does ERP / SAP integration actually connect?
It keeps your CMMS and ERP agreeing on every shared object — assets, parts, work orders, labor, and cost — without anyone re-typing anything. A part issued on a work order decrements ERP inventory instantly, a closed job posts its full cost to the right cost center, and below-reorder stock triggers a purchase requisition automatically. SAP stays the system of record; the CMMS is the execution layer. See the mapping in
OxMaint.
QWhat's the typical ROI and payback?
Organizations commonly report 15–30% less unplanned downtime, around 25% better parts-inventory accuracy, and up to 85% less manual data entry within the first six months. Payback typically lands in the 12–18 month range, with cumulative three-year returns of roughly four to six times the project cost. High-downtime fleets pay back fastest.
Book a demo to model your numbers.
QWhere does the biggest dollar return come from?
Unplanned downtime reduction is the largest single contributor for most fleets, because reactive repairs run roughly three times the cost of planned work and idle vehicles lose revenue every hour they sit. Labor productivity from mobile work orders and lower inventory carrying cost follow close behind. Parts savings alone rarely tell the whole story. See the value streams in
OxMaint.
QWon't SAP integration be a six-figure consulting project?
It doesn't have to be. A modern native connector maps to your existing SAP, Oracle, Dynamics, or NetSuite setup in a few weeks — commonly four to eight — rather than the four-to-nine-month middleware projects that earned integration its reputation. No changes to your core ERP configuration are required.
Book a demo and bring a sample asset extract to see the field mapping.
QDoes the CMMS replace SAP?
No. The integration is a two-way bridge where SAP remains the enterprise system of record and the CMMS becomes the mobile execution layer your technicians actually use. Every transaction in one updates the other, so your existing SAP reports and dashboards keep working — just with more complete frontline data feeding them. Keep SAP, add execution, in
OxMaint.
QHow do we build a CFO-credible ROI number?
Skip industry averages and use your own six-month baseline. Take current unplanned downtime hours per vehicle per month, multiply by revenue per operating hour, apply a 35–55% reduction factor, and add the reactive-repair premium of roughly three times planned cost. Layer in recovered admin hours and avoided compliance penalties. That's the defensible figure, and OxMaint generates it from your work-order history —
try it free.
QWhat's the rollout sequence and timeline?
A phased approach works best: start with asset or vehicle master sync, then maintenance cost posting, then parts inventory, then procurement workflow. Each phase is validated before the next, demonstrating value incrementally and building stakeholder confidence. A typical mid-market integration runs four to eight weeks end to end.
Book a demo to map your phased roadmap.
QWhy do some integrations fail to deliver ROI?
Roughly 40% of CMMS rollouts miss their projected ROI, and the usual cause isn't the software — it's adoption. Desktop-only, transaction-code-heavy interfaces drive technicians to skip data entry, and an integration is only as good as the data flowing through it. Mobile-first tools that technicians actually use are the single biggest predictor of realized return. See adoption in
OxMaint.
Turn integration into return
Stop running maintenance and finance as parallel universes. Connect the two, recover the lost hours, and put a defensible ROI number in front of your board.