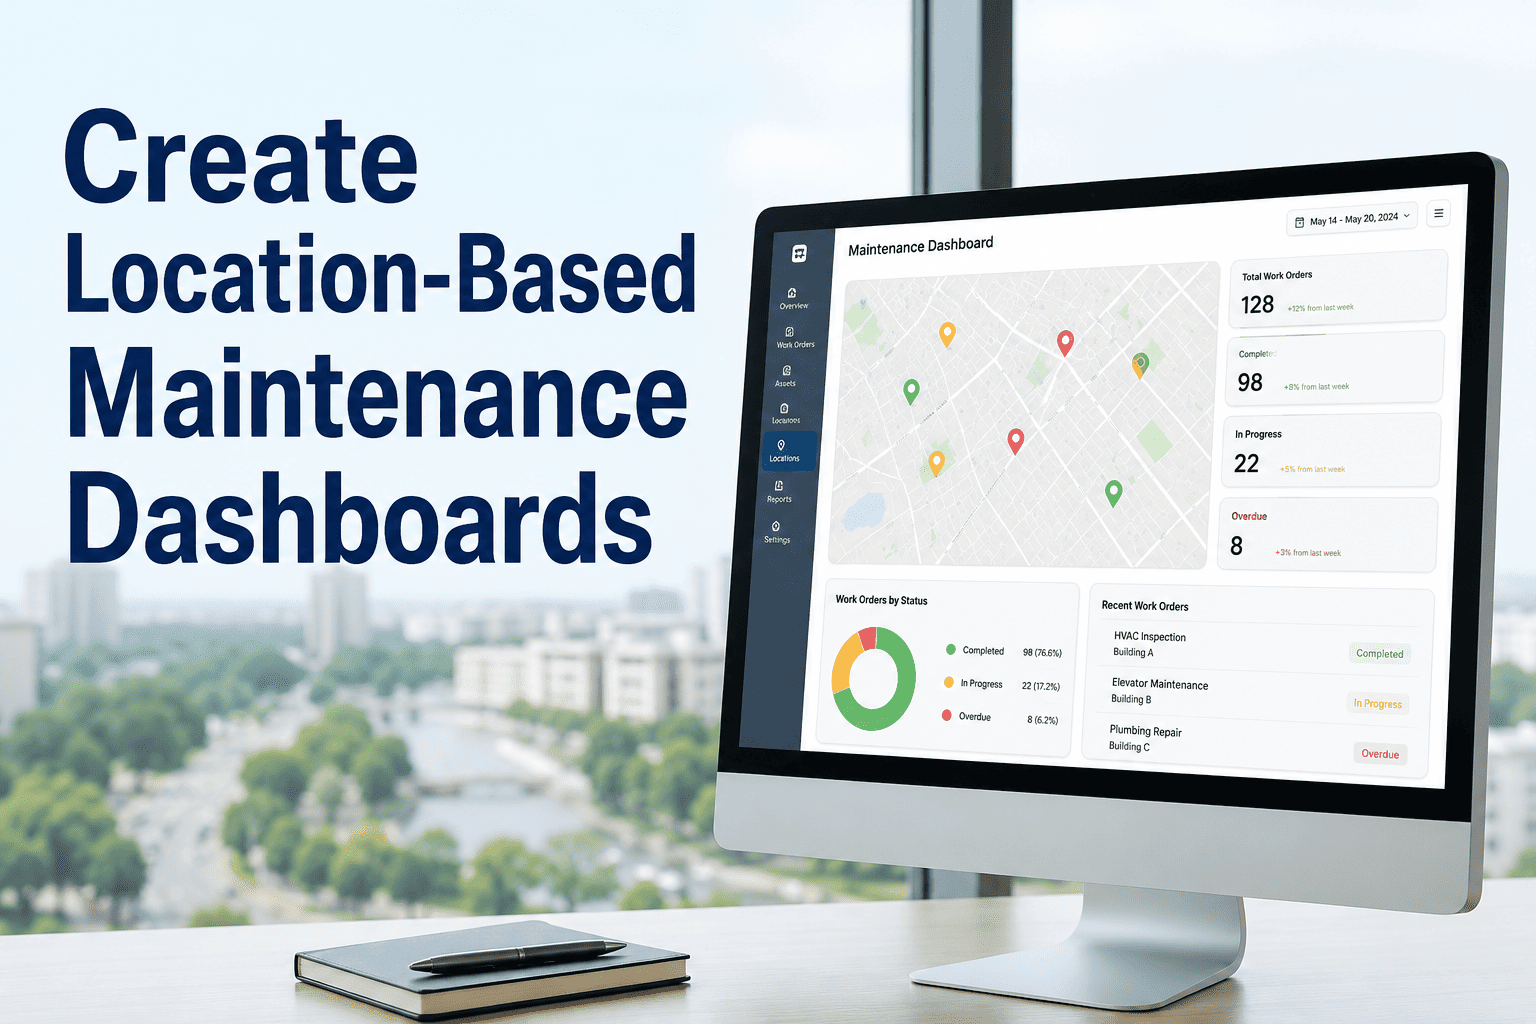
Maintenance teams at multi-site facilities waste an average of 4.2 hours per week manually compiling location-based data from scattered spreadsheets and disconnected systems. A well-structured location-based maintenance dashboard solves this by surfacing backlog, downtime, and recurring failures by site, floor, or zone — giving managers a live operational picture instead of a stale weekly report. This guide walks through how to build and use these dashboards effectively inside a modern CMMS like OxMaint.
How to Create Location-Based Maintenance Dashboards
Build dashboards by site, floor, zone, or asset area to spot delays, backlog, downtime, and recurring requests faster — no manual reports needed.
Why Location-Blind Dashboards Fail Maintenance Teams
When dashboards show total backlog as a single number, no one knows which floor is drowning and which is fine. Location context transforms a data point into a decision.
The Four Levels of Location-Based Dashboards
Effective location dashboards follow a drill-down hierarchy. Each level answers a specific management question — from fleet overview to a single asset on a production floor.
Compare all sites side by side. Spot which plant has the highest backlog, worst downtime, or lowest PM compliance at a glance.
Within a single plant, see which departments or production lines generate the most reactive work orders and which assets repeat-fail most often.
Drill into specific production zones or building floors. Identify delay hotspots, technician bottlenecks, and high-frequency request areas within a shift.
Zero in on a single machine's full maintenance history, last inspection date, open work orders, and parts consumption — all on one screen.
Build Your Location Dashboard in Under 30 Minutes
OxMaint's pre-built location hierarchy lets you tag every asset to a site, floor, and zone. Dashboards populate automatically — no configuration scripts needed.
Essential Metrics for Each Dashboard Level
| Dashboard Level | Primary Metric | Alert Trigger | Action It Drives |
|---|---|---|---|
| Fleet / Corporate | PM compliance by site | Below 80% at any site | Escalate to plant manager |
| Site / Plant | Reactive WO ratio | Reactive exceeds 40% | Review PM schedule for top 5 assets |
| Floor / Zone | Avg response time by zone | Response > 4 hrs in any zone | Reassign technician coverage |
| Asset / Equipment | Repeat failure count | 3+ failures in 30 days | Schedule root cause analysis |
How to Build a Location Dashboard in OxMaint — Step by Step
Map out every level: fleet → site → building → floor → zone. In OxMaint, this becomes the asset tree that all work orders, PMs, and reports inherit automatically.
Use bulk import or QR-code scanning to assign location tags to each piece of equipment. Assets without a location tag will not appear in filtered dashboards, so completeness matters here.
Corporate users need PM compliance and downtime cost. Plant managers need backlog age and reactive ratio. Supervisors need today's open work orders by zone. Avoid giving everyone the same view.
Configure automatic alerts when any location metric breaches its threshold. A site with PM compliance dropping below 80% should notify the plant manager instantly — not at the next monthly meeting.
The dashboard is only as valuable as the decisions it triggers. Build a weekly 15-minute review habit: identify the one location with the worst trend and assign one corrective action before the meeting ends.
Most facilities I work with have the data — they just don't have it organized by location. The moment you filter backlog and downtime by zone, patterns become obvious that were invisible before. I've seen teams cut their reactive work by 30% in two months simply by discovering that one production line was responsible for 60% of all emergency calls. Location context is the difference between a report and a decision.
Stop Guessing Which Location Is Causing the Most Downtime
OxMaint gives you a live, drill-down dashboard from fleet level to individual asset — built for facilities teams who cannot afford blind spots in their maintenance operations.
Frequently Asked Questions
How many location levels should a maintenance dashboard support?
Most facilities benefit from four levels: corporate, site, zone, and asset. Going deeper than four levels adds complexity without proportional value — technicians do not need a sub-zone filter, they need to see today's open work orders for their area. Start with three levels and add a fourth only when your team genuinely needs it. OxMaint supports up to six hierarchy levels but recommends configuring only what your team will actually use during daily operations.
Can a location dashboard replace monthly maintenance reports?
For most day-to-day management decisions, yes. A live location dashboard updated in real time provides more current and more actionable data than a monthly PDF compiled from work order exports. Monthly reports still serve a purpose for board-level summaries and budget reviews, but operational decisions — which zone needs attention today, which site is falling behind on PMs — should be driven by a live dashboard rather than a snapshot that is already three weeks old by the time it reaches a manager. Learn more about OxMaint's reporting capabilities.
What data do I need to set up a location dashboard from scratch?
You need three things at minimum: a defined location hierarchy, a tagged asset register that maps each piece of equipment to a location, and work order data that references asset IDs. Historical data is valuable but not required for go-live — even two to four weeks of live data begins to surface patterns. OxMaint's bulk asset import templates simplify the tagging process significantly, and most teams complete the initial setup within a single working day. Book a demo to see the import workflow in action.
How does a location dashboard help reduce after-hours maintenance calls?
After-hours calls are almost always concentrated in a small number of high-risk locations. A location dashboard identifies which zones generate the most emergency requests and when during the week they tend to spike. With that visibility, maintenance managers can prioritize preventive tasks in those zones during regular hours, adjust PM frequencies for the assets most likely to fail after-shift, and schedule technician coverage more intelligently. Facilities using location-based analytics report 20 to 35 percent reductions in after-hours callouts within the first quarter of deployment.


.png)