Most maintenance teams collect data. Few turn it into decisions. When work orders pile up without context, when equipment downtime is recorded but never analyzed, and when budgets are justified by gut feeling rather than trend lines, the real cost isn't just inefficiency—it's the gap between what your team knows and what leadership needs to hear. Book a demo to see how OxMaint's analytics dashboard connects every metric to a maintenance outcome.
Maintenance Analytics & Reporting
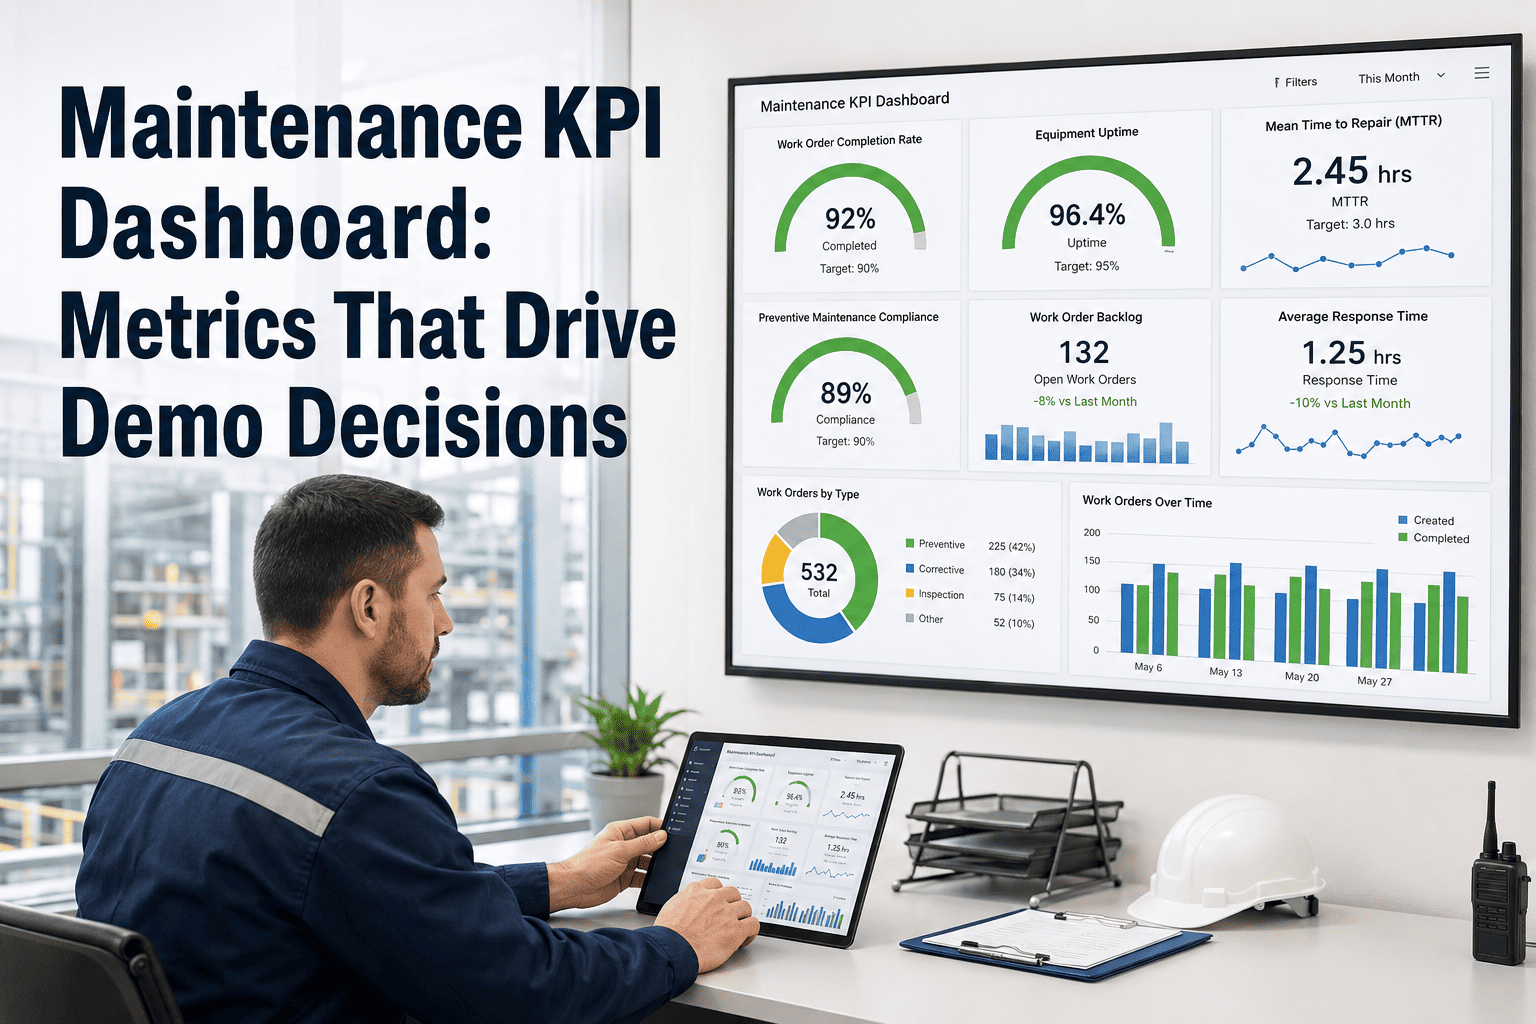
Maintenance KPI Dashboard: Metrics That Drive Demo Decisions
Stop reporting numbers. Start driving outcomes. OxMaint's analytics layer turns work order data, asset history, and PM compliance into dashboards that make the case for every maintenance decision.
23%
Avg. reduction in unplanned downtime
4.2x
ROI reported by teams using CMMS analytics
68%
PM compliance improvement in 90 days
Real-time
Dashboard updates across all assets
Why KPIs Without Context Are Just Numbers
A work order completion rate of 82% sounds acceptable until you realize the remaining 18% are all on critical assets. An average response time of 4 hours looks fine until you segment it by technician and find one person handling triple the load. KPIs only drive decisions when they are structured, segmented, and tied to consequence. OxMaint's dashboard is built around this principle—every metric surfaces with the context needed to act.
Work Order Completion Rate
Track open vs. closed work orders by asset class, technician, or site. Spot backlogs before they become downtime events.
Industry benchmark: >90% on critical assets
PM Compliance Rate
Percentage of preventive maintenance tasks completed on schedule. Directly predicts equipment failure frequency.
Industry benchmark: >95% for regulated assets
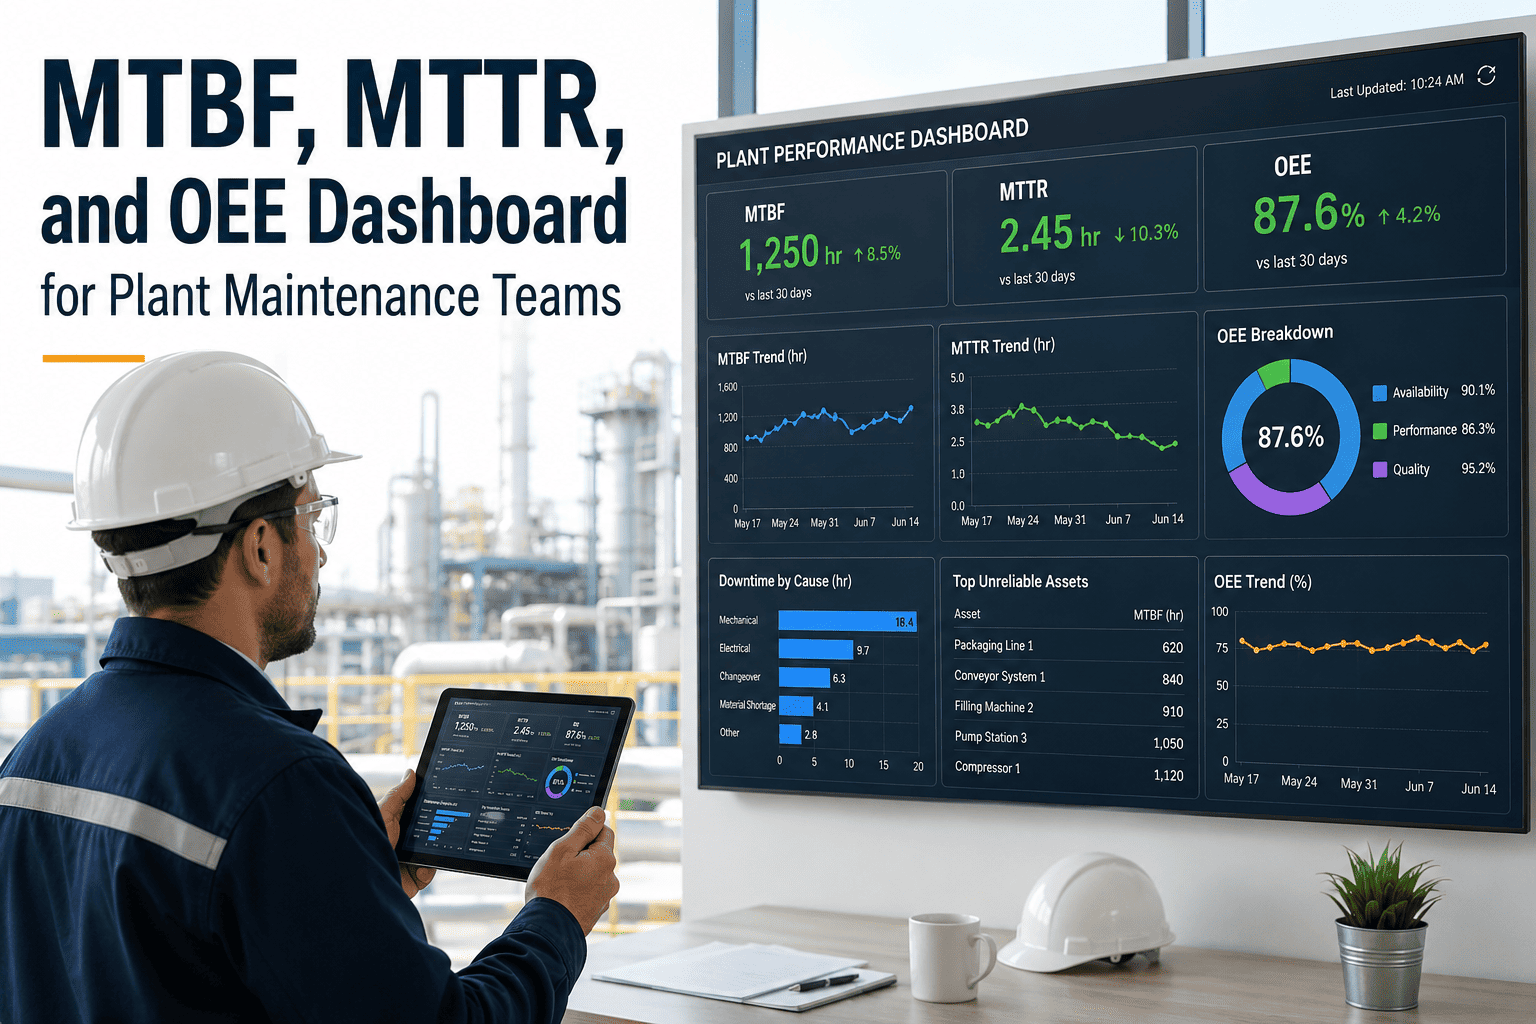
Mean Time to Repair (MTTR)
Average duration from fault detection to full restoration. Lower MTTR signals better technician readiness and parts availability.
Industry benchmark: <4 hrs for priority equipment
Reactive vs. Planned Ratio
The share of corrective vs. scheduled maintenance work. High reactive ratios indicate a fire-fighting maintenance culture.
Best practice: <20% reactive maintenance
Cost per Work Order
Total labor, parts, and downtime cost divided by work orders completed. Identifies where maintenance spend is disproportionate.
Tracked monthly, segmented by asset category
Asset Downtime Frequency
How often each asset fails per period. Combined with MTBF data, this KPI drives replacement and capital planning decisions.
Flagged automatically in OxMaint above threshold
How OxMaint Turns Raw Data Into Decision-Ready Dashboards
OxMaint's analytics engine doesn't require a data team to configure. Maintenance managers get pre-built dashboards for work order performance, asset reliability, PM compliance, and cost analysis—all updated in real time as technicians complete work in the field. Every chart is drillable: click a downtime spike to see the underlying work orders, parts used, and technician assignments. Book a demo to walk through a live dashboard with your own asset types.
1
Data Capture
Technicians log work orders, PM completions, and parts usage directly in the OxMaint mobile app. No double entry, no paper transfer.
2
Metric Calculation
OxMaint automatically calculates MTTR, PM compliance, cost per WO, and reactive ratios from logged activity. No manual formulas.
3
Dashboard Surfacing
Role-based dashboards show each stakeholder the metrics relevant to their decisions—technician view, manager view, and executive summary.
4
Alert & Action
Threshold breaches trigger automatic PM alerts and work order creation. KPIs don't just report—they initiate the response.
KPI Benchmarks: Where Does Your Team Stand?
| KPI |
Below Average |
Industry Average |
Best in Class |
OxMaint Tracks |
| PM Compliance Rate |
< 70% |
70–85% |
> 95% |
Yes — automated alerts |
| Reactive Maintenance Ratio |
> 50% |
30–50% |
< 20% |
Yes — by asset & site |
| MTTR (Priority Assets) |
> 12 hrs |
4–12 hrs |
< 4 hrs |
Yes — real-time calc |
| Work Order Backlog Age |
> 30 days avg |
14–30 days |
< 7 days |
Yes — aging report |
| Schedule Compliance |
< 60% |
60–80% |
> 90% |
Yes — weekly reports |
"
Before we had a KPI dashboard, our monthly maintenance review was just a gut-feel conversation. Now I walk in with PM compliance by asset class, MTTR trends for the past quarter, and a breakdown of reactive vs. planned ratio. The conversations are completely different—we're making capital decisions based on data, not anecdotes. The ROI case for the CMMS essentially writes itself when the numbers are this clear.
James Whitfield
Plant Maintenance Manager, Mid-Scale Manufacturing Facility
18 years in industrial maintenance | Certified Maintenance & Reliability Professional (CMRP)
Frequently Asked Questions
What maintenance KPIs should I track first if I'm new to CMMS analytics?
Start with PM compliance rate and reactive vs. planned maintenance ratio—these two metrics tell you whether your team is managing maintenance or reacting to it. Once those are stable, layer in MTTR for critical assets and work order backlog age. OxMaint's
pre-built dashboards surface all four automatically the moment your team starts logging work orders.
How does OxMaint calculate MTTR and PM compliance without manual data entry?
OxMaint calculates MTTR automatically from the timestamps recorded when a work order is created (fault detected) and when it is closed (asset restored). PM compliance is derived from scheduled PM due dates versus actual completion dates in the system. Technicians only log what they actually do—the analytics layer handles all metric calculations in the background.
Book a demo to see the calculation methodology for your asset types.
Can I create custom KPI reports for different stakeholders—technicians, managers, and executives?
Yes. OxMaint supports role-based dashboards so each user sees the metrics relevant to their responsibilities. Technicians see their open work order queue and PM schedule. Managers see team performance, asset health, and backlog trends. Executives see cost summaries, compliance rates, and downtime impact. All dashboards pull from the same live data and can be exported as scheduled PDF reports for leadership reviews.
How long does it take to see meaningful KPI data after implementing OxMaint?
Most teams see initial KPI trends within 30 days of consistent work order logging. PM compliance rates and reactive vs. planned ratios become statistically meaningful within the first 4–6 weeks. MTTR trends and cost-per-asset analysis typically require 60–90 days of data to reflect true baseline performance. OxMaint's onboarding team helps configure dashboards and alert thresholds during initial setup to accelerate time-to-insight.
See Your Maintenance KPIs in a Live Dashboard
OxMaint gives maintenance teams the analytics layer to connect daily work order activity to the metrics leadership cares about. PM compliance, MTTR, reactive ratios, and cost data—all in one place, updated in real time.