Plant maintenance teams live by three numbers: how long equipment runs before failing, how fast it gets back online, and how effectively it performs when running. MTBF, MTTR, and OEE are not abstract metrics—they are the language that converts maintenance activity into operational and financial outcomes. When these numbers sit in disconnected spreadsheets, updated monthly by a single analyst, decision-making slows to a crawl. Book a demo to see how OxMaint centralizes reliability metrics without the spreadsheet chaos.
Plant Reliability Analytics
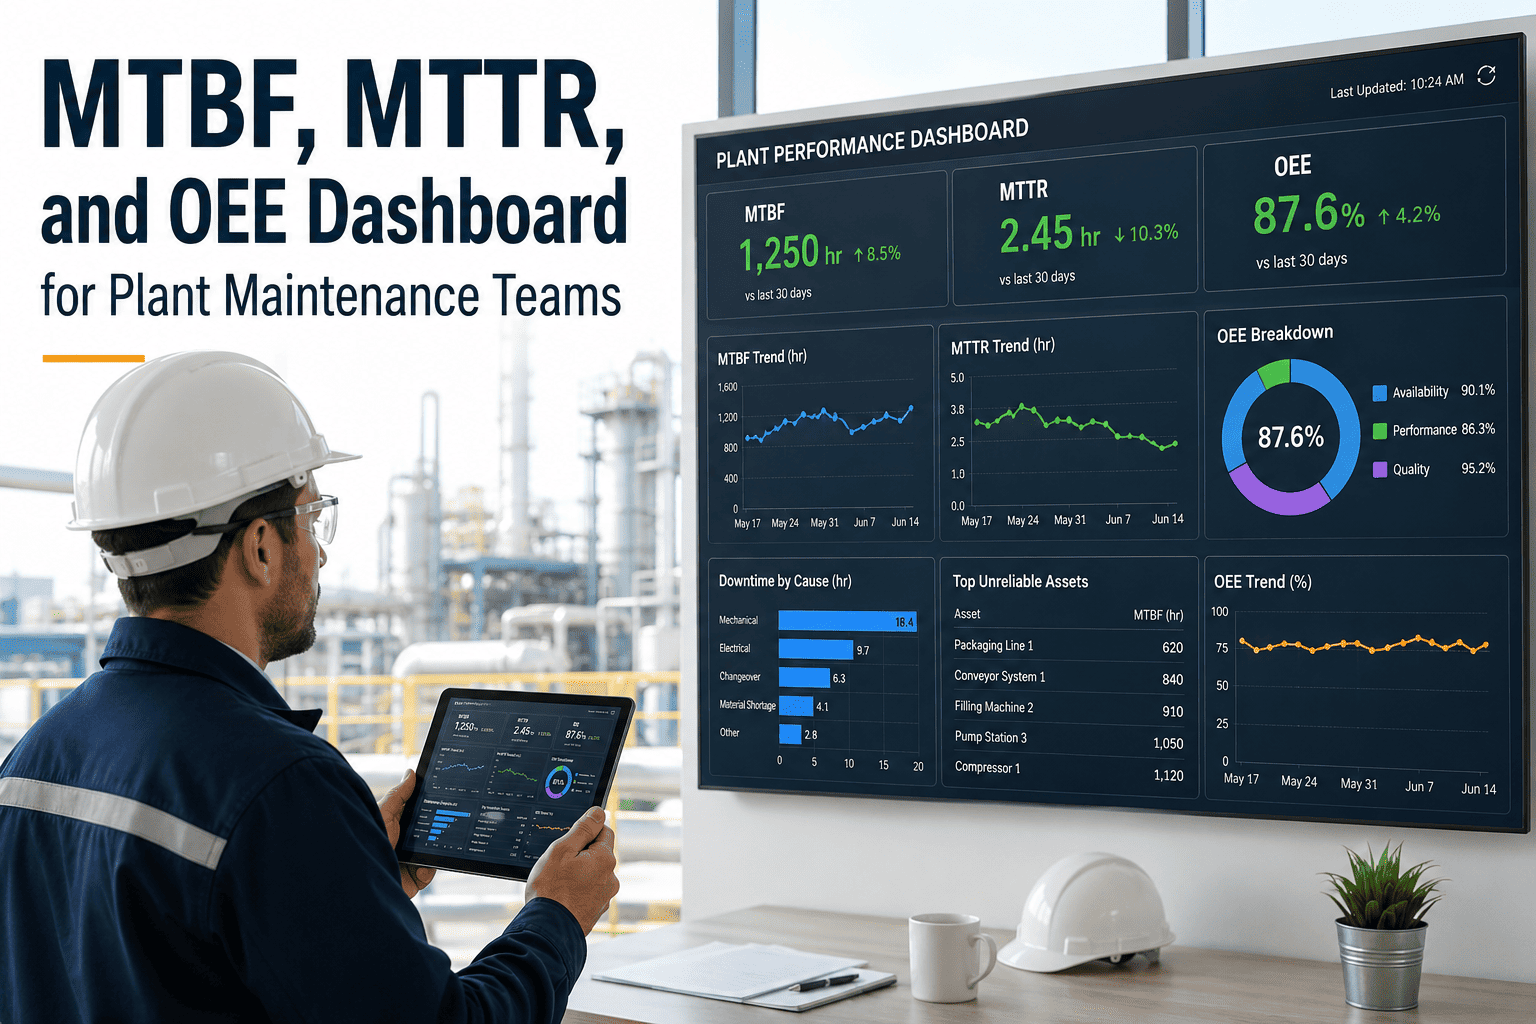
MTBF, MTTR, and OEE Dashboard for Plant Maintenance Teams
Real-time reliability metrics that replace spreadsheet chaos with a single source of truth. Track mean time between failures, mean time to repair, and overall equipment effectiveness—all from one unified maintenance platform.
MTBF
Mean Time Between Failures
Measures equipment reliability. Higher is better.
Industry avg: 480 hrs for production equipment
MTTR
Mean Time to Repair
Measures maintenance responsiveness. Lower is better.
Best in class: under 4 hrs for critical assets
OEE
Overall Equipment Effectiveness
Measures production efficiency. World class = 85%+.
Global manufacturing average: 60–65% OEE
Understanding the Three Metrics
Each of the three metrics tells a distinct story about your maintenance operation. Tracking them in isolation misses the relationship between them—low MTBF drives up MTTR, and poor MTTR depresses OEE. OxMaint's dashboard surfaces all three alongside work order history and PM data, making the relationships visible rather than theoretical.
OEE Availability: Where Maintenance Teams Control the Number
Of the three OEE components—Availability, Performance, and Quality—maintenance teams directly own Availability. Every minute of unplanned downtime reduces availability and therefore OEE. Improving MTBF means fewer failures; reducing MTTR means faster recovery. Both moves directly lift OEE. OxMaint's dashboard quantifies exactly how much each PM improvement or response time reduction translates to OEE gain for your specific asset mix. Book a demo to model your facility's OEE improvement potential.
Availability
Maintenance Owns This
Driven by unplanned downtime. Improved by higher MTBF and lower MTTR through proactive maintenance and faster repair.
Performance
Operations-Led
Speed losses and micro-stops. Partially influenced by equipment condition—well-maintained assets run closer to rated speed.
Quality
Process-Led
Defects and rework. Poor equipment calibration is a maintenance contribution—tracked through asset condition history in OxMaint.
Benchmark: How Does Your Plant Stack Up?
| Metric |
Reactive Plant |
Average Plant |
Proactive Plant |
World Class |
| MTBF (Production Equipment) |
< 100 hrs |
200–480 hrs |
480–800 hrs |
> 800 hrs |
| MTTR (Critical Assets) |
> 12 hrs |
4–12 hrs |
1–4 hrs |
< 1 hr |
| OEE (Overall) |
< 40% |
40–60% |
60–75% |
> 85% |
| OEE Availability Component |
< 55% |
55–75% |
75–88% |
> 90% |
| PM Compliance Rate |
< 60% |
60–80% |
80–92% |
> 95% |
"
We spent three years tracking MTBF in a spreadsheet that one person maintained. When that person was on leave, the data was two months stale. When we moved to OxMaint, MTBF, MTTR, and downtime trends updated automatically from closed work orders. Within 60 days we identified two assets responsible for 40% of our total downtime—something the spreadsheet never surfaced because we weren't querying it that way. Those two assets got scheduled PMs increased from monthly to weekly and our unplanned downtime dropped 31% in the next quarter. The ROI case was written in the data itself.
Ravi Krishnamurthy
Senior Reliability Engineer, Discrete Manufacturing
CMRP Certified | 14 years in plant reliability | Former GE Aviation maintenance systems lead
31%
Unplanned downtime reduction in 90 days
60 days
Time to surface critical asset patterns
2 assets
Drove 40% of total facility downtime
Stop Rebuilding Reliability Spreadsheets Every Month
OxMaint calculates MTBF, MTTR, and availability from your actual work order data—automatically, in real time, without a data analyst.
Frequently Asked Questions
How does OxMaint calculate MTBF and MTTR automatically?
OxMaint derives MTBF from the timestamps recorded when a work order is created (failure event) and the total operating time tracked per asset. MTTR is calculated from the duration between work order creation and closure. Both metrics are segmented by asset, asset class, site, and time period—and update automatically every time a work order is closed. No manual formulas, no analyst required. Teams can view these in the
OxMaint analytics dashboard or export them for leadership reports.
What is a good MTBF target for production equipment?
MTBF targets vary significantly by equipment type, age, and operating environment. For standard production equipment, industry averages range from 200–480 hours. Best-in-class plants operating proactive maintenance programs typically achieve 600–800+ hours for the same equipment categories. The most valuable insight is not hitting an industry average but tracking your own MTBF trend line over time—consistent improvement indicates your PM program is working. OxMaint's trend charts make this visible at the asset level.
Can OxMaint integrate OEE data from production systems to complete the full metric?
OxMaint natively tracks the Availability component of OEE through asset downtime records and work order data. For full OEE calculation including Performance and Quality components, OxMaint can integrate with production MES or SCADA systems via API. Many plant teams start by using OxMaint for the Availability component—which maintenance directly controls—and layer in production data over time.
Book a demo to discuss integration options for your specific production environment.
How do I use MTBF data to set preventive maintenance intervals?
The standard approach is to set PM intervals at 50–70% of the asset's MTBF—this ensures maintenance intervention before the statistical likelihood of failure. For example, an asset with an MTBF of 400 hours should receive a PM inspection around every 200–280 hours. OxMaint stores asset-level MTBF trends and allows maintenance managers to adjust PM schedules directly in the system based on current reliability data, then automatically generates the updated PM work orders on the new interval.
Replace Spreadsheet Chaos With a Live Reliability Dashboard
OxMaint gives plant maintenance teams automatic MTBF, MTTR, and OEE availability tracking tied to real work order activity. No manual formulas. No stale data. No single analyst bottleneck. Just the numbers your team needs to make better maintenance decisions every day.