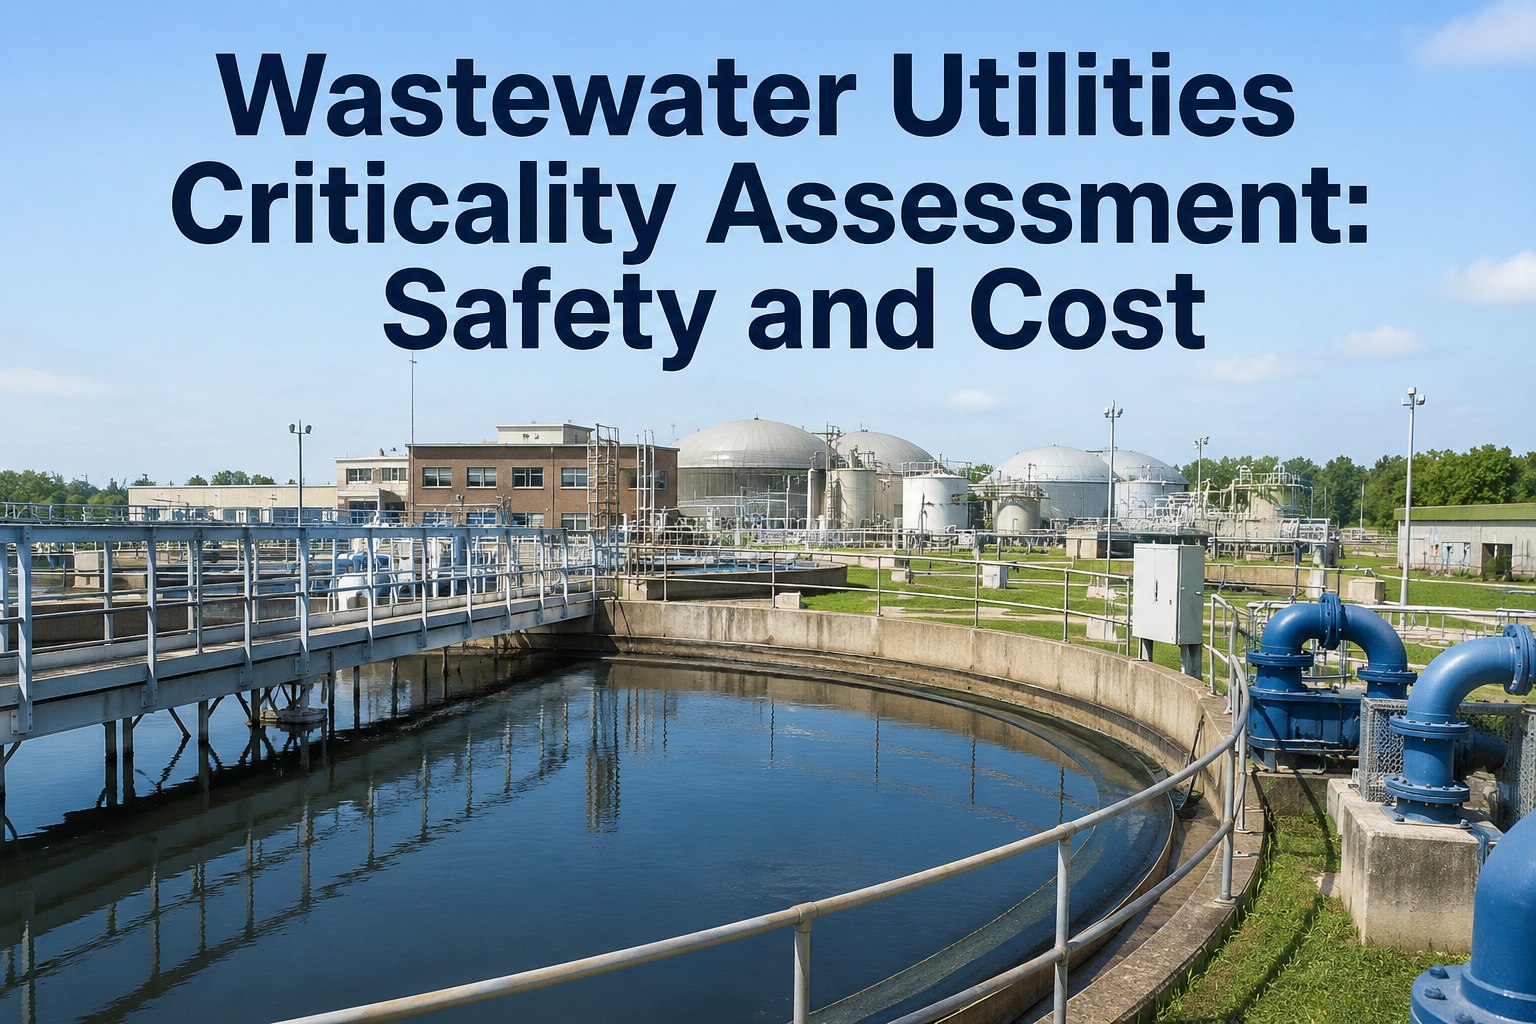
Wastewater Utilities Criticality Assessment: Safety and Cost

Connect with Industry Experts, Share Solutions, and Grow Together!

Join Discussion Forum
wastewater-utilities-criticality-assessment-safety-and-cost

A mid-size wastewater treatment plant runs 300-800 individual maintainable assets across headworks, primary treatment, aeration basins, secondary clarifiers, digesters, blowers, disinfection, and biosolids handling — and treats every one of them like they matter equally. They don't. A single influent lift-station pump failing during a storm event can put untreated wastewater into public waters and land a $37,500-per-day EPA Clean Water Act penalty on the utility. A grit conveyor bearing failing at the same time can wait until Tuesday. Yet without a structured criticality assessment, both get the same PM cycle, the same spare-parts budget, and the same attention on shift handover. This is where risk-based prioritization pays back — an ACA (Asset Criticality Assessment) built on a 5×5 consequence-versus-likelihood matrix, weighted for the four consequences that matter (safety, environmental, production, cost), delivering a defensible Tier 1/2/3 ranking that drives every PM cycle, spare-part decision, and monitoring investment. This guide walks the standard ACA methodology (API 580, ISO 31000, SMRP), the WWTP-specific consequence dimensions, the tier ranking that shapes maintenance strategy, and how OxMaint CMMS turns criticality into a live driver of PM scheduling and cost reporting. Start free or book a demo to load your first ACA workflow live.

Water & Wastewater · Asset Criticality · Risk-Based · CMMS 2026

Wastewater Utilities Criticality Assessment: Safety and Cost

Wastewater Utilities asset criticality matrix. Rank every asset by safety, production, and cost impact using the standard 5×5 methodology aligned to API 580, ISO 31000, and SMRP frameworks.

5 × 5 Matrix
Standard consequence × likelihood grid — 25-point criticality scale
$37,500/day
EPA Clean Water Act penalty ceiling for permit violations
3 Tiers
Standard classification: Critical / Important / Non-Critical
10-20%
Share of assets that typically land in Tier 1 (Critical)

The 5×5 Criticality Matrix — Where Every Asset Actually Sits

Every criticality assessment resolves to the same visual: a 5×5 grid with consequence on one axis and likelihood on the other. Multiplying the two scores produces a 1-25 criticality number that drives everything downstream — PM interval, monitoring investment, spare stocking, response priority. Below is the matrix every WWTP reliability planner reads against. Sign up free and OxMaint's wastewater library ships with a pre-configured 5×5 criticality matrix and WWTP-specific asset templates — every asset gets scored, plotted, and tier-classified in your first workspace session, no consultant engagement.

STANDARD 5 × 5 CRITICALITY MATRIX · CONSEQUENCE × LIKELIHOOD
CONSEQUENCE →
5
10
15
20
25
4
8
12
16
20
3
6
9
12
15
2
4
6
8
10
1
2
3
4
5
← LIKELIHOOD
1-4 · Tier 3 (Non-Critical)
5-8 · Tier 2 Lower
9-12 · Tier 2 Upper
13-16 · Tier 1 Lower
17-25 · Tier 1 Critical

The Weighted Consequence Formula — What "Consequence" Actually Means

"Consequence" isn't one thing. In a wastewater utility it's four things — safety, environmental, production, and cost — and they don't matter equally. A safety consequence weighs heavier than a cost consequence, and an environmental consequence in a permit-regulated utility often outweighs both. Below is the standard weighted formula used by API 580, ISO 31000, and SMRP-aligned programs, adapted for wastewater. Book a 30-minute demo and an OxMaint water/wastewater specialist will walk this formula against your specific plant — you'll leave with the weighted consequence dimensions calibrated to your permit conditions before you commit to a trial.

WEIGHTED CONSEQUENCE FORMULA · WASTEWATER-ADAPTED
Consequence =
(4 × Safety) + (4 × Environmental) + (2 × Production) + (1 × Cost)

11
×4
SAFETY
Injury risk — H₂S exposure, confined space, high-voltage, chemical burns. Weighted highest because life-safety cannot be traded.
×4
ENVIRONMENTAL
Permit violation risk — NPDES exceedance, SSO, biosolids non-compliance. Same weight as safety for regulated utilities.
×2
PRODUCTION
Treatment capacity loss — reduced throughput, bypass risk, downstream process impact. Weighted below safety/env but above pure cost.
×1
COST
Repair cost, spare parts, contractor spend. Real but lowest-weight — you can throw money at cost consequences.
Each dimension scores 1-5. Multiply the weighted sum by the likelihood score (also 1-5) to get final criticality on the 1-25 scale. Weights can be adjusted per utility — some biosolids-heavy plants weight environmental higher; some smaller plants weight cost slightly more.

Tier Classification — What Each Ranking Actually Drives

Criticality is only useful if it changes maintenance behavior. The three-tier classification below is what turns a ranking score into a maintenance strategy, a spares policy, and a monitoring investment decision. Sign up free and OxMaint auto-applies the correct maintenance strategy template to every asset based on its tier — Tier 1 assets get condition-based PM and critical spares stocked, Tier 3 assets get simplified run-to-failure workflow — no manual PM design per asset.

TIER 1
CRITICAL
Score 12-25 · Top 10-20% of assets
StrategyCondition-based or predictive maintenance — RCM analysis justified
Spares PolicyCritical spares on-site, quarterly review of stock levels
MonitoringVibration, thermography, oil analysis, real-time SCADA
WWTP ExamplesInfluent lift pumps, blowers, primary clarifier drives, digester heat exchangers, UV disinfection systems
TIER 2
IMPORTANT
Score 5-11 · Next 30-40% of assets
StrategyTime- or usage-based preventive maintenance — standard OEM cycles
Spares PolicyRotable spares in regional inventory, 48-hour response window
MonitoringScheduled inspection, quarterly condition assessment
WWTP ExamplesReturn activated sludge pumps, secondary clarifier drives, aeration diffusers, chemical dosing pumps, MCC panels
TIER 3
NON-CRITICAL
Score 1-4 · Remaining 40-60% of assets
StrategyRun-to-failure or minimal calendar PM — no over-investment
Spares PolicyStandard commercial parts, order-when-needed
MonitoringVisual inspection during rounds, no dedicated instrumentation
WWTP ExamplesGrit conveyor motors (with redundancy), non-essential lighting, general HVAC, admin building equipment

Every Dollar Spent PM-ing a Tier 3 Asset Is a Dollar Not Spent Where It Matters.

Wastewater plants without criticality-driven prioritization end up PM-ing everything on the same schedule — over-maintaining redundant asset while under-monitoring the single-point-of-failure influent pump. OxMaint links every PM to the asset's tier, so your reliability spend follows real risk, not equal treatment of unequal assets.

The Wastewater Asset Consequence Map — What Actually Hurts

Every WWTP has the same asset categories, but the consequence profile varies dramatically. Below is the realistic consequence-scoring map that WWTP reliability engineers work against — grounded in the failure modes that actually trigger permit violations, safety events, or costly downstream damage. Book a scoping call and an OxMaint water/wastewater engineer will map your specific plant's asset population against this consequence map — you'll leave with a first-pass tier ranking before you commit to a trial workspace.

Influent & Lift Stations
Tier 1
Single point of failure between collection system and plant. Failure = sanitary sewer overflow (SSO) = EPA violation.
Headworks (Screens, Grit)
Tier 2
Downtime causes downstream damage but usually has bypass capacity. Redundancy matters.
Primary Clarifiers
Tier 1-2
Drive failure = process disruption. Multiple parallel units = Tier 2; single unit = Tier 1.
Blowers & Aeration
Tier 1
Blower loss = biological process crash within hours. Highest energy consumer + highest criticality.
Secondary Clarifiers
Tier 1-2
Effluent quality gate — failure directly impacts NPDES permit compliance.
Digesters (Anaerobic)
Tier 1
Heat exchanger, mixing, gas system failures = weeks of process recovery. Very high consequence.
Disinfection (UV / Cl)
Tier 1
Final barrier before discharge. UV lamp failure or chlorine dosing error = permit exceedance.
Biosolids Handling
Tier 2
Belt press, centrifuge, screw press. Downtime creates handling backlog but not immediate discharge risk.

Spreadsheet ACA vs. OxMaint Live Criticality Loop

Most utilities have "done a criticality analysis" — meaning a 2022 Excel file sits on the reliability manager's laptop and nobody has touched it since. Live ACA is different. Here's what changes when the criticality data drives active maintenance decisions inside OxMaint. Start free — no credit card, unlimited users, and the water/wastewater library ships with the 5×5 matrix, weighted formula, tier definitions, and asset templates pre-configured for typical WWTP populations.

ACA Discipline Layer
Spreadsheet ACA
OxMaint Live Criticality Loop
Criticality data location
Excel on reliability manager's laptop
Live in CMMS — one authoritative record per asset
Tier → PM strategy link
Manual, drifts within months
Auto-applied — Tier 1 = condition-based, Tier 3 = simplified
Tier visibility on WO
Invisible to planners & techs
Displayed on every asset record, WO, and dashboard
Criticality refresh cadence
Rare — set once, forgotten
Annual review workflow, updated with failure data
Cost-per-asset trending
Impossible without manual data pull
Auto — labour + parts + downtime per asset per year
Maintenance-cost-% of RAV
Reconstructed for board meetings
Live dashboard against SMRP industry benchmarks
EPA / ISO 55000 audit evidence
Days of reconstruction under pressure
One-click export of ACA, PM history, cost per asset

Utilities that put criticality data in front of every planner and tech stop the "everything gets equal PM" pattern and start directing reliability spend at the assets that actually matter. Start your free forever workspace to build your first WWTP ACA this week, or book a demo to see live criticality driving PM decisions on a similar utility fleet.

"

We manage a 35 MGD wastewater plant with roughly 520 maintainable assets. Our "criticality analysis" was a 2019 spreadsheet nobody had opened in three years, and our PM program treated a Tier 1 blower the same as a Tier 3 admin-building air handler. Reworking the ACA inside OxMaint took our reliability team about 60 days — 5×5 matrix, weighted consequence formula, tier-linked PM strategy per asset. First 12 months we reallocated PM labour from Tier 3 to Tier 1, added condition monitoring on all six primary blowers, and cut unplanned outages on Tier 1 assets by 38%. Our maintenance-cost-as-percent-of-RAV moved from 3.1% to 2.6%, and I can finally show the CFO exactly which assets consume which dollars.

Plant Reliability Manager · 35 MGD Regional Water Reclamation Facility · Southeast US

Frequently Asked Questions

What is asset criticality analysis for a wastewater plant?
Asset Criticality Analysis (ACA) is a structured method for ranking every maintainable asset by the risk its failure poses to safety, environment, production, and cost. For WWTP the standard approach uses a 5×5 matrix (Consequence × Likelihood, each scored 1-5) producing a 1-25 criticality score. Assets are then classified into Tier 1 (Critical, score 12-25), Tier 2 (Important, 5-11), and Tier 3 (Non-Critical, 1-4). The tier drives maintenance strategy, spares policy, and monitoring investment.
Which frameworks does this methodology align to?
The semi-quantitative weighted scoring method used here is the industry standard, aligned to API 580 (Risk-Based Inspection), ISO 31000 (Risk Management), SMRP Best Practices Guide, and ISO 55000 (Asset Management). NJDEP guidance for wastewater utilities also aligns to this approach. Sign up free to load the framework-aligned templates.
Why weight safety and environmental higher than cost?
Because they can't be traded. A cost consequence can be absorbed with budget; a safety consequence is a person injured and a regulatory investigation; an environmental consequence is a permit violation ($37,500 per day EPA maximum under Clean Water Act), potential SSO reporting, and public trust damage. The weighted formula (4× safety, 4× environmental, 2× production, 1× cost) reflects the reality that these are not equivalent categories.
How often should the criticality assessment be refreshed?
Annual review at minimum, with immediate updates when a major process change happens (new treatment train, new discharge permit conditions, new asset commissioning). OxMaint runs annual ACA review as a scheduled workflow — reliability team gets prompted to reconfirm tier assignments and update scores where failure data has shifted the picture. Static spreadsheet ACAs drift within 12-18 months; live ACAs stay current.
Does OxMaint support cost-per-asset and maintenance-% of RAV reporting?
Yes. Every work order captures labour hours, parts consumed, contractor spend, and downtime against the specific asset — rolled up into cost-per-asset, cost-per-failure-mode, and maintenance-cost-as-percent-of-Replacement-Asset-Value dashboards. Live comparison against SMRP industry benchmarks lets you show finance leadership exactly where spend is going. Book a demo to see the cost reporting live.
Can this ACA methodology apply to drinking water utilities too?
Yes. The same 5×5 matrix, weighted consequence formula, and 3-tier classification apply to drinking water treatment plants and distribution systems — many combined utilities use one consistent ACA framework across both wastewater and drinking water operations. Consequence dimensions shift slightly (public health becomes even more prominent on the drinking water side) but the methodology is the same.
Is a credit card or CAPEX approval needed to start?
No. OxMaint's free forever plan requires no credit card, no CAPEX request, and no consulting engagement — you can sign up in under 2 minutes and start scoring your first WWTP assets against the 5×5 matrix the same shift. Wastewater plant asset templates ship pre-built for headworks, primary/secondary treatment, digesters, blowers, disinfection, and biosolids handling.

Rank Every Asset. Direct Every Dollar Where the Risk Actually Sits.

OxMaint delivers the 5×5 criticality matrix, weighted consequence scoring, and tier-linked PM strategy on every wastewater plant asset — with cost-per-asset trending and one-click ISO 55000 exports. Start free — no credit card, unlimited assets, unlimited users, forever. Or book a demo for a plant-specific ACA walkthrough.


By William Jerry

Experience
Oxmaint's
Power

Take a personalized tour with our product expert to see how OXmaint can help you streamline your maintenance operations and minimize downtime.

Book a Tour

Share This Story, Choose Your Platform!

Connect all your field staff and maintenance teams in real time.

Report, track and coordinate repairs. Awesome for asset, equipment & asset repair management.

Schedule a demo or start your free trial right away.

iphone

Get Oxmaint App
Most Affordable Maintenance Management Software

Download Our App