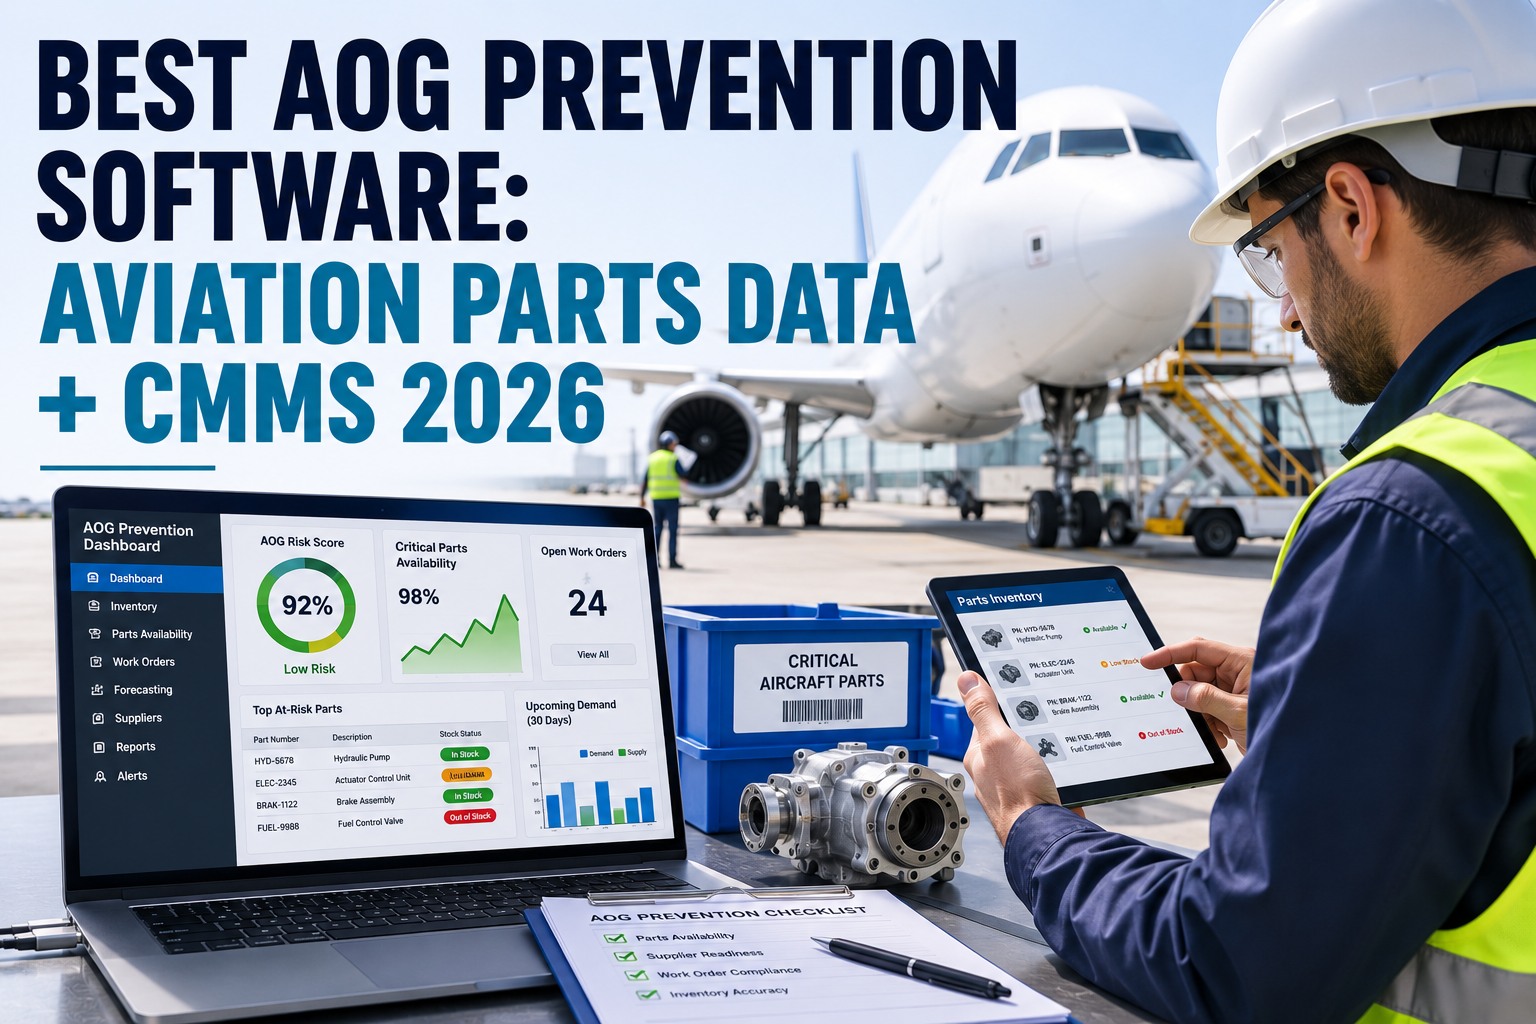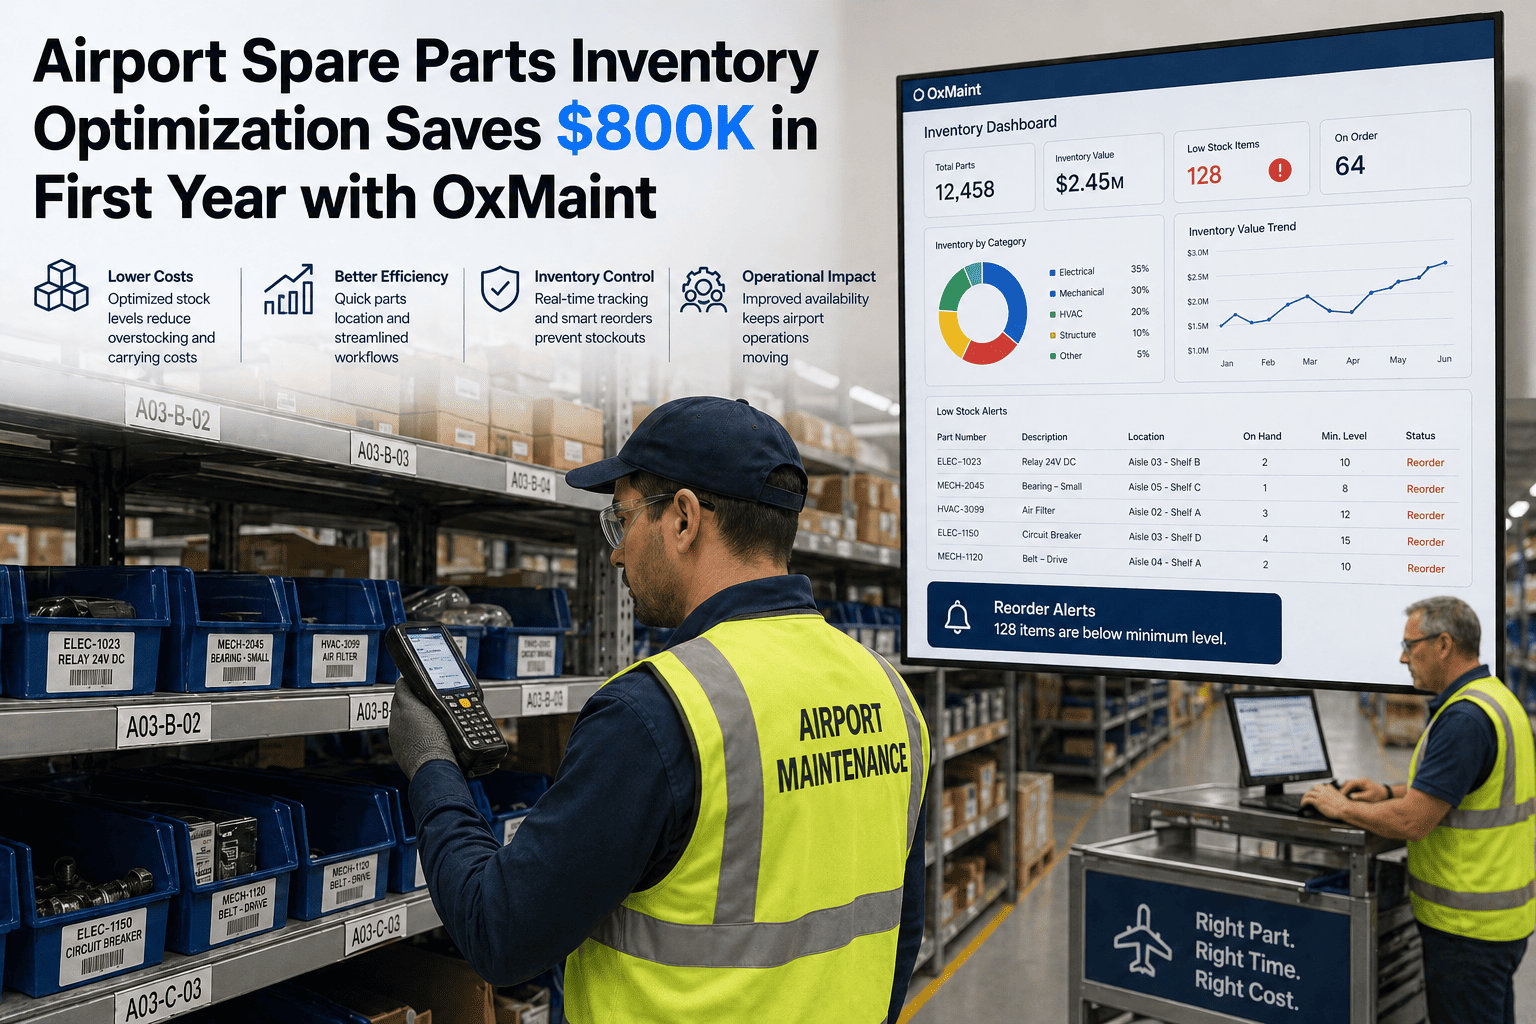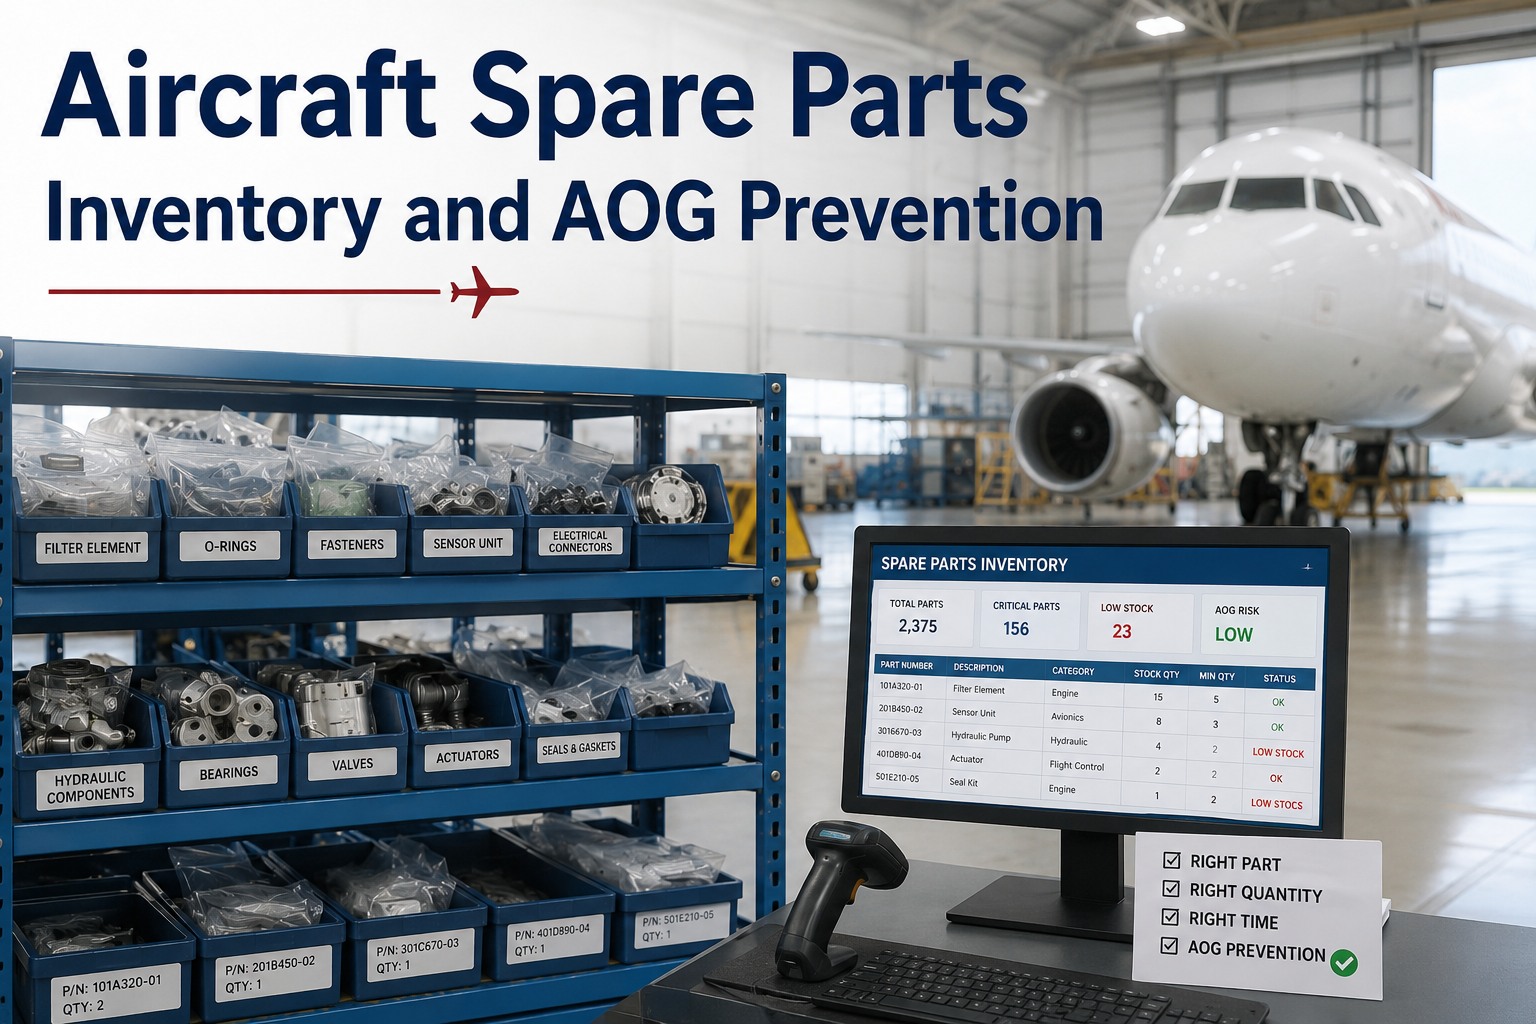
Aircraft spare parts inventory management is where AOG events are either prevented or accepted: a single aircraft-on-ground incident can cost an airline $150,000–$250,000 in lost revenue, recovery logistics and passenger compensation, while the part that caused it may cost only a few hundred dollars. The difference between a two-hour delay and a three-day grounding usually comes down to one decision made months earlier — whether that part was stocked, pooled or left to chance. This guide shows procurement and logistics managers how to build an aircraft parts inventory strategy that keeps availability high without ballooning capital tied up on shelves. We cover criticality-based stocking, min/max policies, exchange pools, expedited sourcing workflows and the analytics that tie it all together. If you want to see this running on your own fleet data, Start Free Trial and model your first criticality matrix in under an hour.
What Does One AOG Event Really Cost Your Operation?
A narrowbody sitting on the ground burns roughly $10,000–$15,000 per hour in lost revenue and recovery costs. Most of those hours trace back to a part that wasn't where it needed to be. Here's how to fix the stocking math before the next one hits.
How Much Does an Aircraft on Ground (AOG) Event Actually Cost?
Industry benchmarks put a narrowbody AOG at $10,000–$15,000 per hour and a widebody at $20,000–$30,000 per hour once you total the full impact — and the part at the center of it often costs less than 1% of the bill.
Direct revenue loss
Cancelled or delayed flights, rebooking onto other carriers, and lost cargo capacity. A single cancelled transatlantic rotation can erase $150K+ in one day.
Recovery logistics
Emergency freight, AOG desk fees, courier charters and technician travel. Expedited shipping of a 40kg component across an ocean routinely runs $8K–$25K.
Passenger obligations
EU261 compensation alone is up to €600 per passenger on long-haul — a full 777 can trigger €180K in mandatory payouts before hotels and meals.
Network knock-on
Crew legality timeouts, missed slot windows and displaced rotations ripple for 24–72 hours, multiplying the original event across the schedule.
A regional carrier we modeled had 11 AOG events in one year, averaging 31 hours each. Total exposure: roughly $1.9M. The parts that would have prevented 8 of those 11 events had a combined shelf cost under $60,000.
Worked example · 22-aircraft regional fleetCriticality-Based Stocking: The Foundation of Aircraft Spares Management
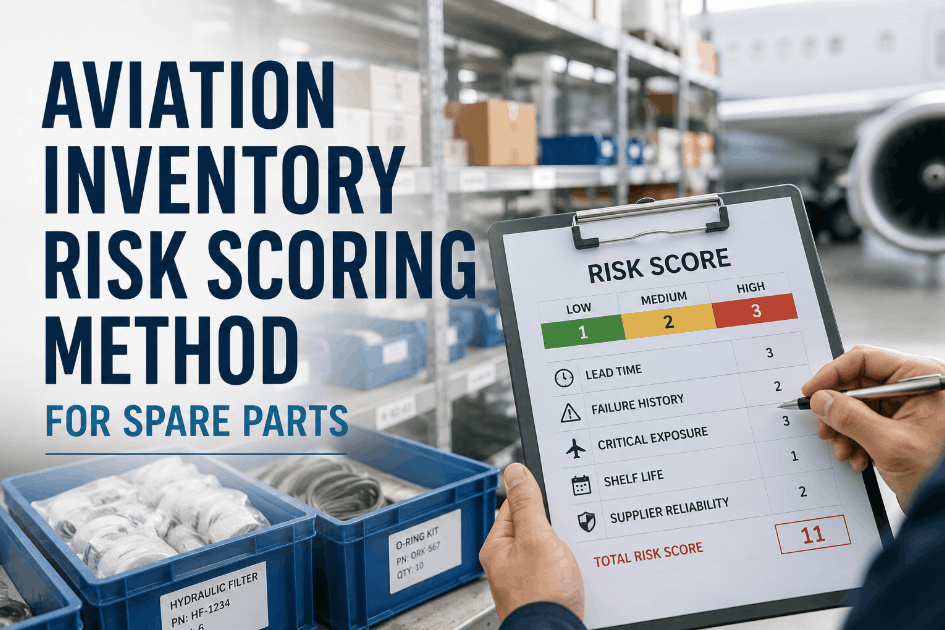
Airlines that classify every rotable and consumable by operational criticality — not just price — routinely hold 20–30% less inventory while improving fill rates. The trick is a simple three-tier matrix.
AOG-Critical (No-Go)
Parts whose absence grounds the aircraft immediately: actuators, avionics LRUs, brakes, wheels, engine components. Stock at every major base or guarantee via pool with <4-hour response.
- Target availability: 98–99.5%
- Review cycle: monthly
- Typical share of SKUs: 10–15%
Schedule-Critical (MEL-Limited)
Deferrable under the MEL for 3–10 days but disruptive: cabin systems, secondary hydraulics, non-essential avionics. Stock regionally with min/max triggers.
- Target availability: 95–97%
- Review cycle: quarterly
- Typical share of SKUs: 25–35%
Routine Consumables
Filters, seals, fasteners, fluids — cheap, predictable, easily sourced. Buy on consumption forecasts; never let these occupy premium shelf space or capital.
- Target availability: 90–95%
- Review cycle: semi-annual
- Typical share of SKUs: 50–65%
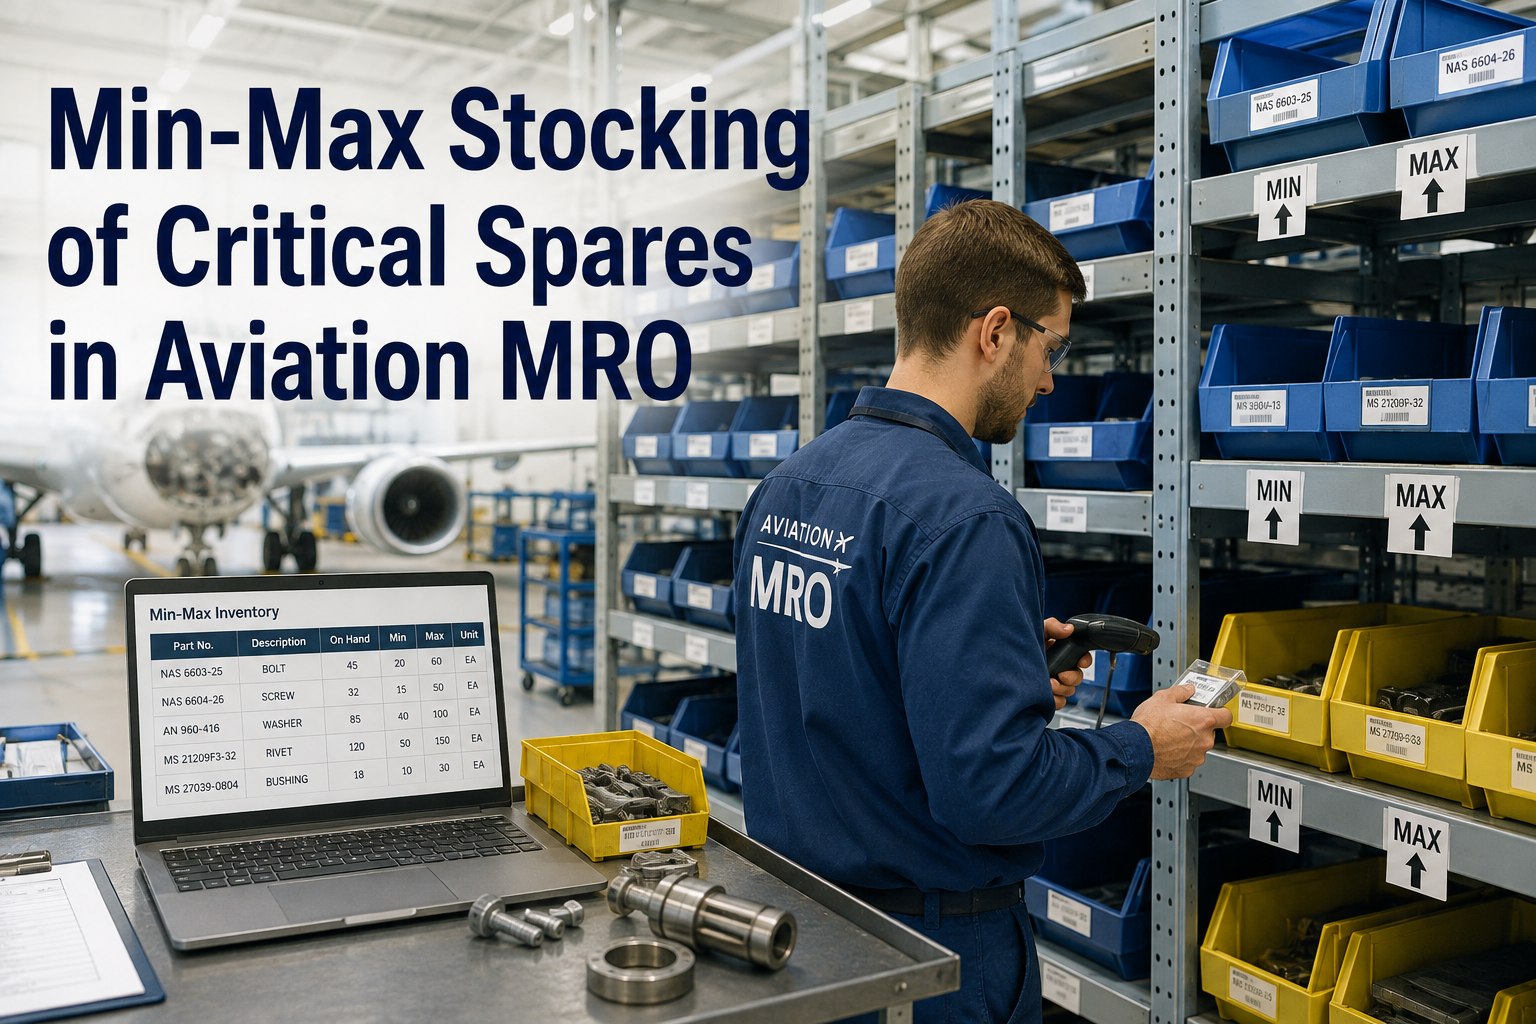
Min/Max Policies and Reorder Points for Aircraft Parts Inventory Management
A disciplined min/max policy cuts emergency orders by 40–60% in the first year. The math is straightforward — the discipline is what most spreadsheet-based operations lack.
ROP = (Average daily demand × Lead time in days) + Safety stock
Safety stock for Tier 1 aviation parts should use a 95–99% service level against demand variability — not a flat "keep two on the shelf" guess.
| Policy Element | Spreadsheet Approach | CMMS-Driven Approach |
|---|---|---|
| Demand signal | Last year's usage, reviewed annually | Rolling 90-day consumption + scheduled maintenance forecast |
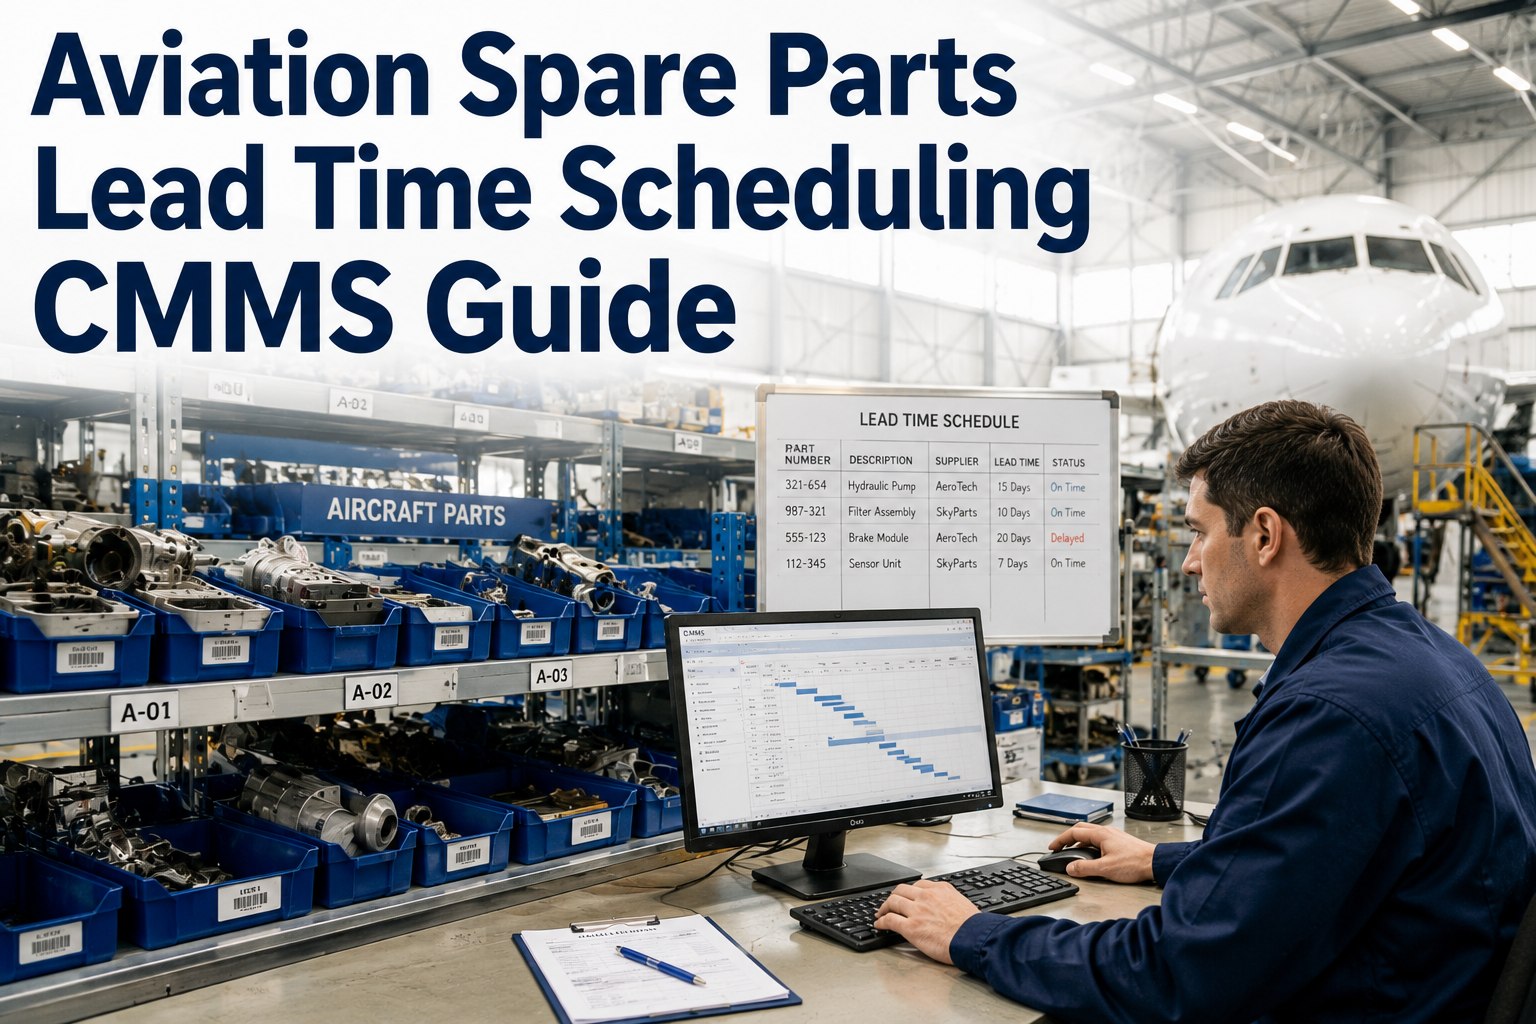
| Lead time | Quoted lead time from last PO | Actual receipt history per vendor, auto-averaged |
| Reorder trigger | Someone notices the empty bin | Automatic alert when on-hand hits ROP |
| Excess detection | Annual physical count surprise | Dead-stock report flags zero-movement items >12 months |
| Multi-base visibility | Phone calls between stations | Single live view across every store and line station |
Exchange Pools, Expedited Sourcing and the AOG Response Workflow
Even a perfect stocking policy can't hold everything — a typical fleet would need $40M+ in rotables to self-insure against every failure. Smart operators layer three sourcing levers on top of their own shelves.
Rotable exchange pools
Pool membership (OEM or third-party) gives you guaranteed access to high-value rotables for a fixed monthly fee — typically 60–75% cheaper than owning the full set. The catch: pools only work if your inventory system tracks what's in the pool, what's out for repair, and TAT on every exchange unit.
Pre-negotiated AOG vendor agreements
Don't negotiate freight and pricing at 2 a.m. during an event. Establish AOG terms with 3–5 key vendors in advance: guaranteed 2-hour quote response, agreed expedite fees, and 24/7 contact trees. Response time drops from hours to minutes.
A documented AOG workflow
The best-run operations resolve AOG part requests 3–5x faster because the workflow is rehearsed: identify part and tail → check all internal bases simultaneously → trigger pool → trigger vendor AOG desk → arrange logistics. Every step time-stamped in the system, every event reviewed afterward for stocking lessons.
Post-event feedback loop
Every AOG should update the criticality matrix. If a Tier 3 part caused a grounding, it gets reclassified and stocked. Fleets that close this loop cut repeat AOG events by over 50% within two years.
AOG Prevention Parts Management, Built Into One Platform
OxMaint's AI-powered CMMS gives aviation maintenance teams the live inventory intelligence that spreadsheets can't — connecting parts, work orders and assets so the right component is always where the aircraft is.
Multi-base spare parts inventory
One real-time view of every part across every base, line station and pool. When an AOG hits, you see in seconds whether the part exists anywhere in your network — no phone trees.
AOG part-location time: hours → minutesAutomated min/max reorder alerts
Set reorder points per part, per location, driven by actual consumption and lead-time history. OxMaint flags low stock before it becomes an emergency purchase.
40–60% fewer emergency orders in year oneRotable & repair-cycle tracking
Track every serialized rotable through install, removal, shop repair and return — with TAT per vendor. Know exactly what's out for exchange and when it comes back.
Full pool visibility, zero lost coresMaintenance analytics & dead-stock reports
See fill rates, AOG events by cause, zero-movement inventory and carrying cost per station. Turn every AOG post-mortem into a stocking policy update in one click.
20–30% inventory spend reduction, availability intactBook a 30-Minute Demo — We'll Map Your AOG Risk Live
Bring your parts list and last year's AOG events. We'll show you exactly where OxMaint's inventory intelligence closes the gaps.
5 Metrics Every Aviation Spare Parts Inventory Program Should Track
What gets measured gets stocked. These five KPIs separate world-class aircraft spares management from expensive guesswork.
Fill rate (Tier 1)
Percentage of Tier 1 part demands satisfied immediately from stock or guaranteed pool. Below 95%, AOG exposure climbs sharply.
AOG part-location time
Time from part identification to confirmed source (own stock, pool or vendor). Every hour saved here is $10K+ on a narrowbody.
Emergency order ratio
Share of purchases made on expedited/AOG terms. Above 15% signals broken reorder points; below 10% means the policy is working.
Inventory turns
Annual consumption value ÷ average inventory value. Aviation runs lower than other industries, but below 1.5x usually means dead stock is piling up.
Dead-stock share
Value of parts with zero movement in 12+ months as a share of total inventory. Fleets switching from spreadsheets often discover 15–25% here.
AOG post-mortem closure
Every AOG event should end with a documented cause and a stocking-policy decision. This is the loop that prevents repeats.
Aircraft Spare Parts Inventory & AOG Prevention — FAQ
What is an AOG event in aviation?
AOG stands for "aircraft on ground" — a situation where an aircraft cannot fly because a required part or repair is unavailable. It's the most expensive category of unscheduled maintenance, typically costing $10,000–$30,000 per hour depending on aircraft type, and the majority of events trace back to parts availability rather than labor or diagnosis.
How do you prevent AOG events with inventory management?
Prevention starts with criticality-based stocking: classify every part by whether its absence grounds the aircraft, then set service-level targets (98–99.5% for no-go items) and automated reorder points. Layer exchange-pool access and pre-negotiated AOG vendor terms on top. A CMMS like OxMaint automates the reorder triggers and gives you one live view across all bases — Start Free Trial to see it on your own parts data.
What is a good fill rate for aircraft spare parts?
For AOG-critical (no-go) parts, target 98–99.5% availability. For MEL-deferrable items, 95–97% is the industry norm, and routine consumables can run at 90–95%. Pushing every category to 99%+ typically doubles inventory carrying cost for marginal benefit — the goal is the right availability per tier, not maximum availability everywhere.
Should airlines own rotable parts or use exchange pools?
Most operators use a hybrid: own the high-usage, fleet-specific rotables you touch monthly, and pool the expensive, rarely-failing units. Pool membership typically costs 60–75% less than owning equivalent coverage, but it only works if your inventory system tracks serialized units, repair TAT and core returns accurately — otherwise you pay for access you can't actually use.
How much can better aircraft parts inventory management save?
Two directions at once: preventing just two or three narrowbody AOG events per year avoids $300K–$900K in direct costs, while tightening min/max policies and clearing dead stock typically releases 20–30% of inventory capital. Book a Demo and we'll model the savings against your fleet's actual AOG history in 30 minutes.
Put Your Aircraft Spare Parts Inventory on Autopilot
Live multi-base visibility, automated reorder points and rotable tracking — everything you need to make the next AOG somebody else's problem.
Free 14-day trial · No credit card · Set up in under an hour