Every airport capital request eventually lands on the CFO's desk as a number without a story: the facilities team wants millions for a jet bridge fleet, a baggage system, a runway apron — and the case for it rests on judgment, urgency, and whoever argues hardest. The problem isn't that the spend is wrong; it's that it isn't defensible. Maintenance data changes that. Work-order history, asset condition, and deferred-maintenance backlog turn a capital ask into a ranked, evidence-backed case — one that shows which assets are actually failing, what deferring them will cost, and where a dollar of capital buys the most risk reduction. OxMaint AI turns the maintenance record into the condition and cost data a capital plan can be built on and a board can approve.
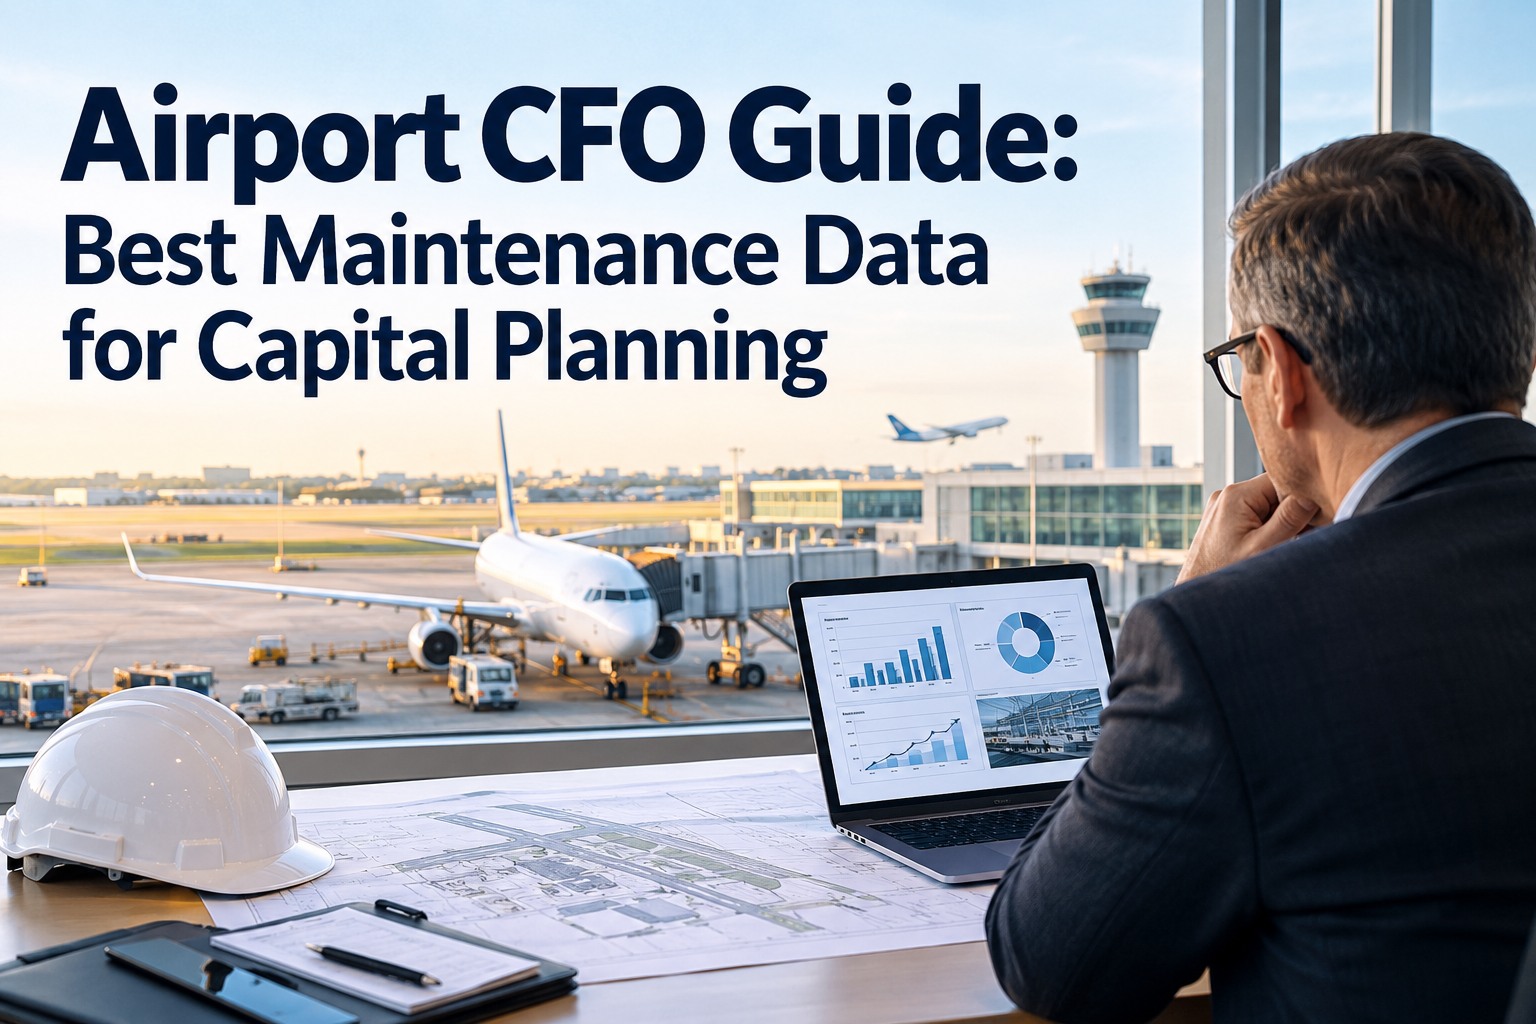
Airport CFO Guide: Maintenance Data for Capital Planning
Capital dollars are finite; the requests never are. The airports that allocate well don't spend more — they decide better, using maintenance data to rank assets by condition, quantify the cost of deferral, and defend every line of the capital plan with evidence instead of urgency. This guide shows how work-order history, Facility Condition Index, deferred-maintenance backlog, and lifecycle cost turn maintenance into a capital-planning input. OxMaint gives finance the condition and cost record to build on.
The Problem: Capital Requests Without Evidence
In too many airports, the capital plan is assembled from wish lists — each department certain its need is urgent, none able to prove it in the same terms. Finance is left arbitrating between claims it can't compare. The fix is a common currency: condition and cost data every asset is measured in, so requests rank against each other on the same scale. Start free and build that common record in OxMaint AI.
FCI: One Number That Ranks Every Asset
The Facility Condition Index converts condition into a single comparable percentage — the accepted metric for capital prioritization. It's simple, and that's the point: every asset lands on the same scale. Book a demo to see FCI computed from your maintenance record.
Once every asset carries an FCI, the capital plan sorts itself: the worst-condition, highest-consequence assets rise to the top on evidence. Start free and score your asset base in OxMaint.
Deferred Maintenance: The Liability You Can't See Until You Measure It
Deferred maintenance is the cumulative cost of work identified as necessary but not yet done — postponed for budget, scheduling, or priority. Left uncounted, it's an invisible liability that grows on the balance sheet of every asset. Counted, it's the numerator of FCI and the single clearest signal of where capital is owed. Book a demo to quantify your deferred-maintenance backlog in OxMaint.
Deferral Isn't a Saving. It's a Cost You've Moved to Next Year — With Interest.
Every deferred repair is a decision to pay later, usually more — as a small fix becomes a failure, a planned job becomes an emergency, and an asset slides a condition band. A CFO who can put a number on that backlog can make deferral a deliberate choice with a known cost, not a default that quietly compounds until something breaks at the worst possible time.
Repair or Replace: The Lifecycle-Cost Decision
For an aging asset, the question isn't only "can we fix it" — it's whether continued investment beats replacement over the asset's remaining life. Once FCI crosses into Poor territory, that economic comparison should drive the call. Start free and hold the cost history each decision needs in OxMaint.
From Maintenance Record to Capital Case
The value of the maintenance system to finance is the pipeline it feeds: raw work orders become condition scores, which become a ranked, defensible plan. Book a demo of the maintenance-to-capital pipeline in OxMaint.
How Finance Prioritizes the Plan
FCI doesn't make the decisions — it structures them. A sound prioritization framework runs in a clear order. Start free and prioritize your plan on this logic in OxMaint.
What OxMaint Gives the Airport CFO
Condition, backlog, lifecycle cost, and portfolio views — the finance-grade outputs a capital plan is built from, all sourced from the live maintenance record. Start free and turn maintenance data into a capital case.
Frequently Asked Questions
Fund the Plan You Can Defend.
Capital is scarce and every department's request feels urgent. Maintenance data is what lets a CFO cut through it — ranking assets by condition, putting a number on deferral, and grounding every capital line in evidence a board will approve. OxMaint turns the maintenance record into the condition, backlog, and lifecycle-cost data your capital plan stands on.