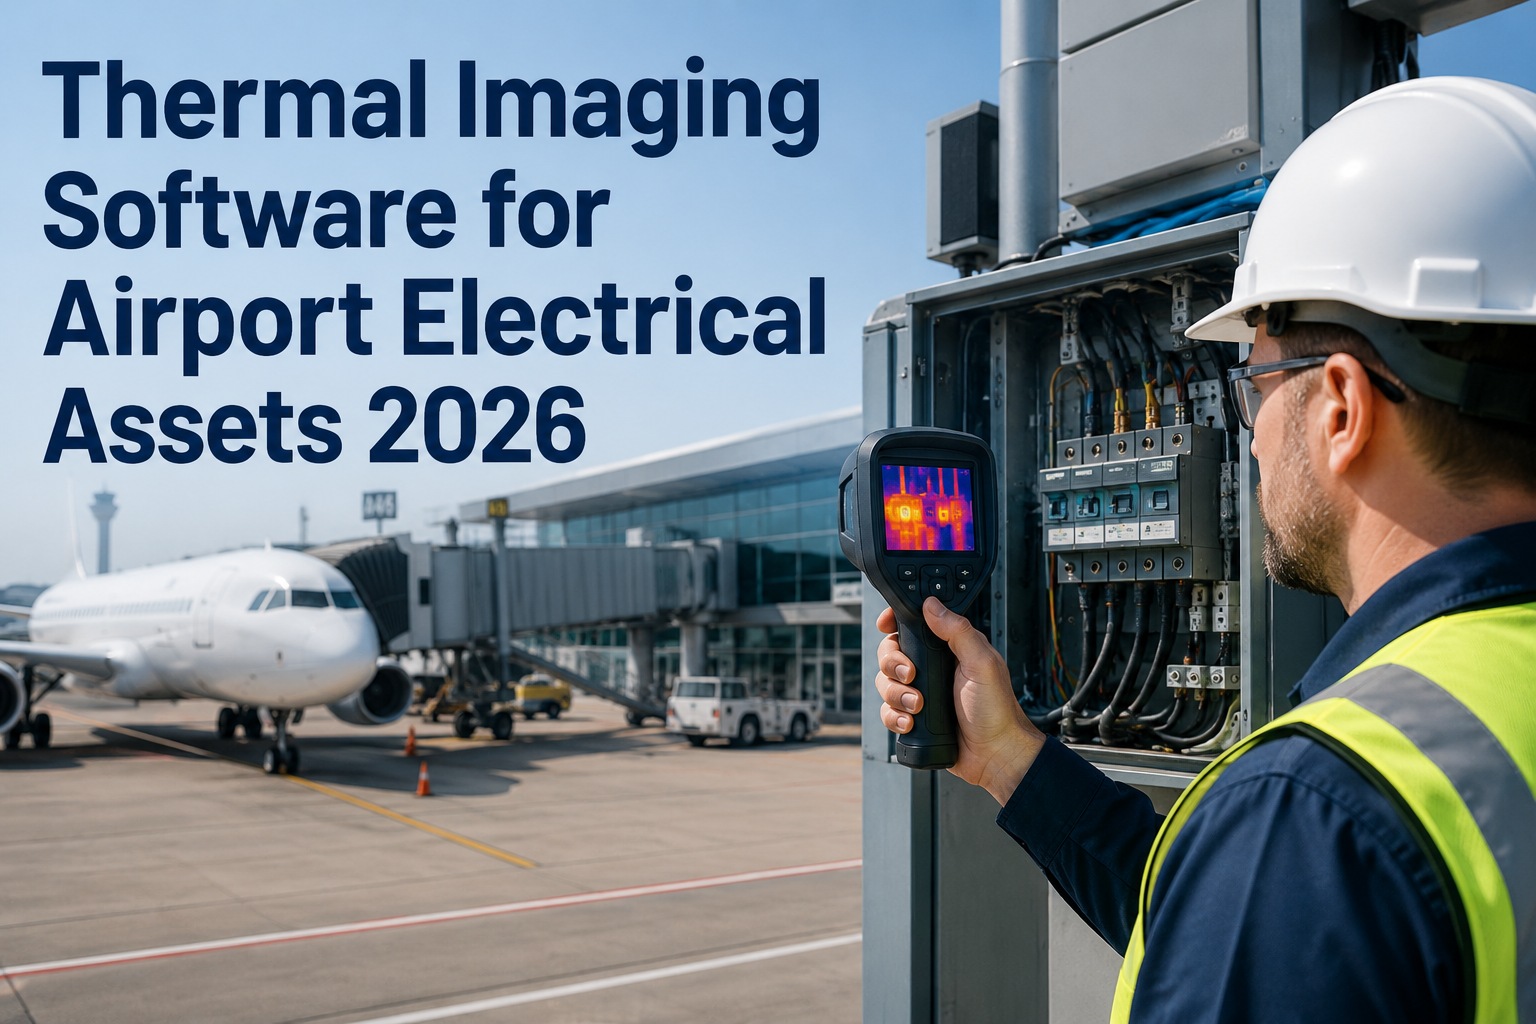
Electrical failures don't announce themselves with an alarm — they radiate heat. A loose bus-bar connection running 40°C above ambient, a corroded breaker terminal climbing toward ignition, an overloaded conductor whose insulation is degrading millimeter by millimeter: all invisible to the eye, all obvious to an infrared camera, often weeks or months before catastrophic failure or an arc-flash event. For an airport running switchgear, transformers, ground-power, and terminal distribution around the clock, that early-warning window is the whole game. And as of the 2023 edition, NFPA 70B turned annual infrared thermography of electrical equipment from a recommendation into an enforceable requirement — yet fewer than 35% of facilities inspect at the frequency the standard now demands. The gap between what thermal imaging can catch and what most programs actually catch is where preventable outages, fires, and downtime live. This guide covers what thermal imaging software for airport electrical assets has to do in 2026 — the standards, the ΔT severity model, the scan-to-work-order workflow, and how a CMMS turns thermal findings into action. Book a free thermography-program review for your electrical assets.
Electrical Faults Don't Alarm. They Heat Up.
A loose connection radiates heat weeks before it fails — visible to infrared, invisible to everyone else.
NFPA 70B
2023 edition made annual IR thermography of electrical equipment enforceable
<35%
Of facilities inspect at the frequency NFPA 70B now mandates
40%
Minimum rated load required for a valid scan — anomalies stay cold below it
Weeks
Warning heat gives before failure — the window a scheduled program uses
The Airport Electrical Assets a Thermal Program Covers
An airport's electrical backbone is dense with connection points, and every one is a potential hot spot. A thermal program scans them systematically — under load, on a route, on a schedule. These are the asset classes that carry the most risk.
Switchgear & MCCs
Main bus connections, breaker stabs, fuse clips, and cable terminations — scanned through IR viewing ports under load. Loose connections generate resistive heating invisible to visual inspection.
Transformers
Bushings, tap changers, cooling systems, and terminations. Thermal trending catches overheating and imbalanced loads before an outage takes a whole distribution segment down.
Panels & Distribution Boards
Breaker connections, neutral bars, and MCC buckets. Overloaded circuits and undersized conductors show as uniform phase heating, distinct from single-point connection faults.
Ground Power & Airfield Systems
Ground-power units, airfield lighting circuits, and jet-bridge power. High-cycle connections under constant load where a fault can strand an aircraft at the gate.
How Thermography Works · The ΔT Severity Model
Infrared thermography turns physics into an inspection method. A component with rising resistance runs hotter than it should, and the temperature rise — Delta T (ΔT) — measured against a reference tells you how urgent the fault is. Severity is classified against NETA MTS thresholds, not guesswork.
Reference the Temperature Rise
ΔT is measured against a reference — ambient air, a comparable component under the same load, or the component's maximum rated temperature. That comparison is what turns a hot image into a severity call.
Classify by Severity
A small ΔT is monitor-and-recheck; a large ΔT is act-now. NETA MTS severity bands convert the measured rise into a defensible priority — screening quickly, then measuring precisely on the anomalies that matter.
Scan Under Valid Load
A scan is only valid at a minimum of 40% of rated load — below it, loose connections and overloads don't generate enough heat differential to detect. Timing the scan to real load is part of the discipline.
Turn Thermal Scans Into a Live Program in 30 Minutes
Working session with our team — bring your electrical asset list. We'll build scan routes, set ΔT severity thresholds, and show how OxMaint schedules inspections at valid load, auto-generates severity-prioritized work orders, and trends hot-spot progression over time.
The Scan-to-Resolution Loop
A thermography program only pays back when the finding becomes a fix — documented and verified. This is the loop a CMMS runs, from route to closed work order, that turns thermal data into maintenance action.
1
Scan on a Route. Technicians follow standardized scan routes with documented emissivity settings, capturing every energized asset under valid load — consistency that makes trending possible.
2
Classify the ΔT. Each anomaly is measured and classified against NETA/NFPA severity thresholds — so the loose bus bar at 40°C above ambient outranks the marginal warm terminal automatically.
3
Generate the Work Order. A severity-prioritized work order fires automatically with the thermal image, location, and reading attached — the fix scheduled before the fault reaches failure.
4
Verify & Trend. A follow-up scan confirms the fix, and hot-spot progression is trended over time — building the avoided-downtime record that proves the program's ROI.
Paper Thermography vs CMMS-Driven Program
Thermal imaging without a system is a folder of pictures. The value isn't the image — it's the scheduled scan, the severity classification, the tracked fix, and the trend that proves it worked. That's the difference between a camera and a program.
Camera-Only Approach
Scans done ad-hoc, frequency drifts below NFPA 70B
Images saved to a folder, hard to compare
Severity judged by feel, not thresholds
Findings depend on someone opening a ticket
No trend, no proof of avoided downtime
CMMS-Driven Program
Scans auto-scheduled at valid load, on cadence
Images linked to the asset with full history
ΔT classified against NETA/NFPA severity bands
Anomalies auto-generate prioritized work orders
Hot-spot trending proves avoided-downtime ROI
How OxMaint Runs the Thermal Imaging Program
OxMaint sits at the intersection of IoT, condition-based maintenance, and the CMMS — ingesting thermal data against every critical asset, triggering condition-based work orders on threshold breach, giving technicians full asset context on mobile, and reporting on avoided downtime attributable to the program.
Schedule
Scans on Route & Cadence
Thermal inspections auto-generate on the NFPA 70B cadence, coordinated to valid load conditions — no scans skipped, no frequency drift.
Ingest
Thermal Data Per Asset
IR scan results and images logged against each electrical asset — the central repository that makes trending and comparison possible.
Classify
ΔT Severity Thresholds
Anomalies classified against NETA/NFPA ΔT bands, so the most dangerous hot spots rise to the top of the queue automatically.
Trigger
Severity-Prioritized Work Orders
A threshold breach auto-generates a work order with the thermal image, location, and reading attached — mobile-first for the technician.
Trend
Hot-Spot Progression
Track each anomaly's temperature over time and verify fixes with follow-up scans — a living history per asset, audit-ready for NFPA 70B.
Report
Avoided-Downtime ROI
Report on failures caught and downtime avoided attributable to the program — defensible ROI on every scan and every alert for leadership.
See the Fault Before It Becomes an Arc Flash
Turn thermal signals into real maintenance action. See how OxMaint schedules scans at valid load, classifies ΔT severity, auto-generates prioritized work orders, and proves avoided-downtime ROI. Free forever plan available.
Frequently Asked Questions
What is thermal imaging software for airport electrical assets?
It's a CMMS configured to run an infrared thermography program on electrical infrastructure — switchgear, transformers, panels, and ground-power systems. Beyond storing images, it schedules scans on the NFPA 70B cadence at valid load, classifies each thermal anomaly against ΔT severity thresholds, auto-generates severity-prioritized work orders with the image and reading attached, trends hot-spot progression over time, and reports on avoided downtime. It turns a thermal camera from a fault-finding tool into a documented, defensible predictive-maintenance program.
Book a program review.
What does NFPA 70B require for thermal inspections?
The 2023 edition of NFPA 70B, the Standard for Electrical Equipment Maintenance, shifted the document from a recommended practice to an enforceable standard and introduced a requirement for regular infrared thermography of electrical equipment — commonly implemented as annual IR inspection. It also carries reporting and documentation expectations: findings have to be recorded, analyzed, and acted on, not just photographed. Despite this, fewer than 35% of facilities inspect at the frequency the standard now demands — which is exactly the compliance and reliability gap a scheduled, documented CMMS program closes.
What is Delta T (ΔT) and why does it matter?
Delta T is the temperature rise of a component above a reference — typically ambient air, a comparable component under the same load, or the component's maximum rated temperature. It's the core of severity classification: a small ΔT means monitor and recheck, a large ΔT means act now. Industry thresholds from NETA MTS convert the measured rise into a defensible priority, so a loose bus-bar connection running 40°C above ambient is flagged as urgent while a marginally warm terminal is queued for monitoring. Without a ΔT reference, a thermal image is just a colorful picture — the comparison is what makes it actionable.
Why must scans be done under load?
Because heat is generated by current. NFPA 70B and NETA practice call for scanning at a minimum of roughly 40% of nominal circuit loading — below that threshold, many thermal anomalies, especially loose connections and overloading conditions, don't generate enough heat differential to be detected. A scan on a lightly loaded circuit can look perfectly healthy while a genuine fault sits hidden. That's why timing inspections to real operating load, and coordinating them with the airport's operational schedule, is a core part of running a valid program rather than a false-negative-prone one.
Sign up free to schedule scans at load.
Does OxMaint support a thermography program?
Yes. OxMaint schedules thermal inspections on the NFPA 70B cadence coordinated to valid load, ingests IR scan results and images against each electrical asset, classifies anomalies against NETA/NFPA ΔT severity thresholds, auto-generates severity-prioritized work orders with the thermal image and reading attached, trends hot-spot progression over time with follow-up verification scans, and reports on failures caught and downtime avoided so leadership sees defensible ROI. It runs mobile-first for technicians and keeps an audit-ready record for NFPA 70B compliance. A free forever plan is available to trial the full workflow.