Running a cement group with five plants is not five times harder than running one plant — it is exponentially more complex, because every plant's maintenance culture, equipment configuration, and work order practice is different, and none of them are talking to each other. The VP of Operations who discovers that Plant A is running at 91% OEE while Plant D limps at 69% — despite similar equipment vintages — is looking at a data problem masquerading as a performance problem. Standardization is the answer, but forcing every plant onto a rigid, one-size-fits-all maintenance template destroys the local knowledge and operational flexibility that keeps individual plants running. The best cement plant CMMS for multi-site group rollouts in 2026 solves this tension: corporate defines the governance layer, sets KPI definitions, and enforces mandatory inspection points, while individual plants retain the autonomy to manage their own work order queues, spare parts, and maintenance scheduling within that framework. For cement groups operating three or more plants and still comparing performance through monthly PDF reports assembled by hand, Oxmaint's enterprise architecture gives you portfolio-level visibility and plant-level control from a single platform.
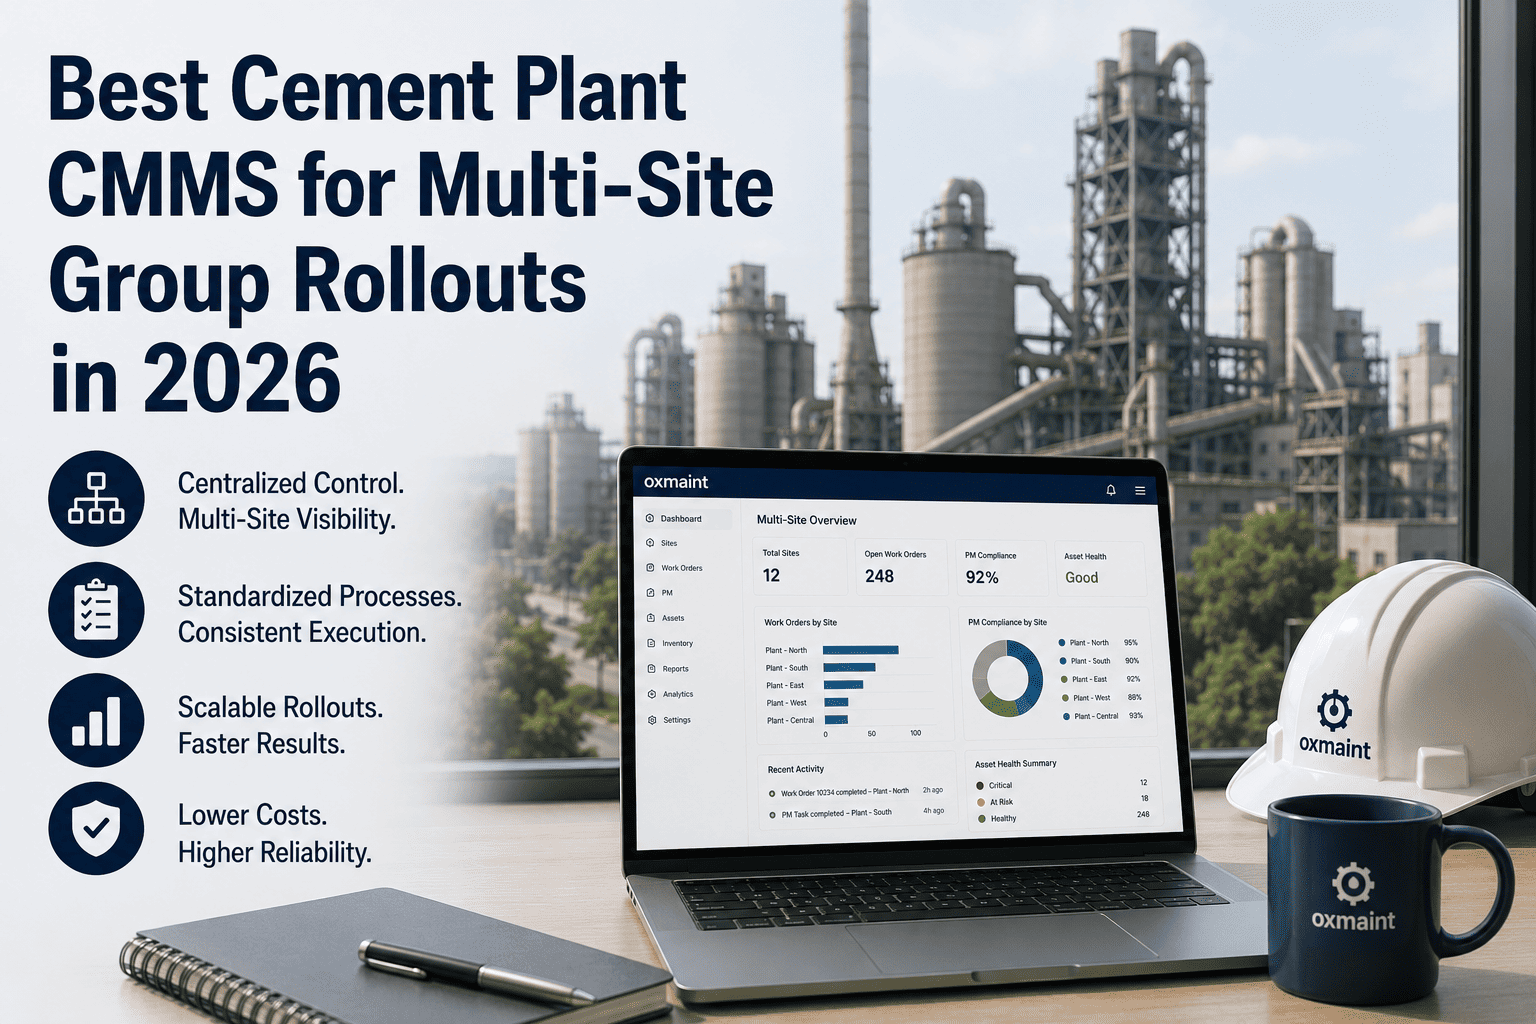
Best Cement Plant CMMS for Multi-Site Group Rollouts in 2026
Cement groups running 3 to 50 plants face a maintenance fragmentation problem that single-site CMMS platforms cannot solve. This guide shows what the best multi-site architecture looks like — and which features determine whether a group rollout succeeds or collapses at implementation.
What multi-plant maintenance fragmentation actually costs
The two-tier model that makes group rollouts work
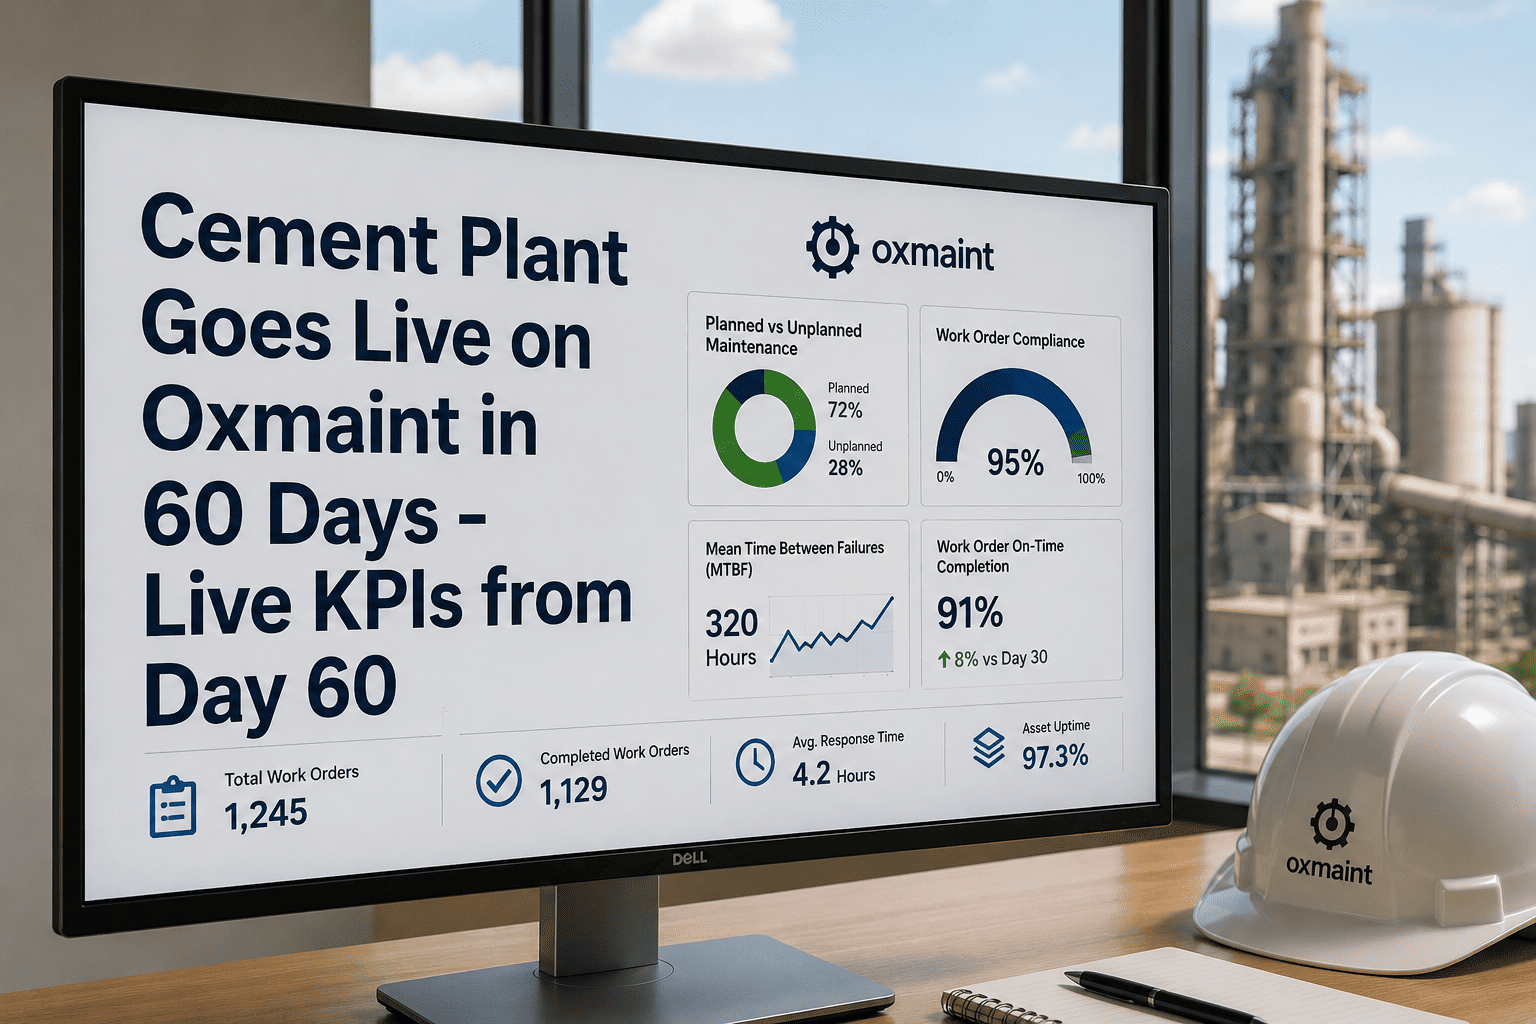
How to deploy CMMS across 5 cement plants in 12 weeks
See what your cement group's portfolio dashboard looks like
Oxmaint's enterprise architecture deploys across multiple cement plants in parallel — with portfolio-level visibility live within 8 to 12 weeks of the first site going live. Book a demo to see the cross-plant benchmarking dashboard in action.
What to look for when evaluating multi-site cement CMMS in 2026
| Feature | Why It Matters for Multi-Site Groups | Red Flag If Missing |
|---|---|---|
| Two-tier governance model | Corporate standards enforced without removing plant autonomy — the only architecture that achieves group standardization at scale | Groups forced to choose between rigid corporate control or no standards at all |
| Cross-plant KPI benchmarking | Identifies performance gaps between plants with similar equipment — the fastest way to find what Plant A is doing that Plant D is not | Monthly PDF reports assembled by hand from each plant's local data |
| Single Sign-On (SSO) | Corporate managers access all plants without separate logins — security, compliance, and operational visibility in one authenticated session | Corporate team manages separate credentials for each plant system |
| Offline mobile work orders | Field technicians in remote plants work without connectivity — data syncs automatically when back in range, never lost | Mobile app abandoned within 60 days when connectivity fails in field areas |
| Cross-plant spare parts visibility | Critical spares at sister plants visible to local teams — reduces emergency stockouts and cross-site parts sharing for unplanned repairs | Each plant carries full safety stock independent of sister plant inventory |
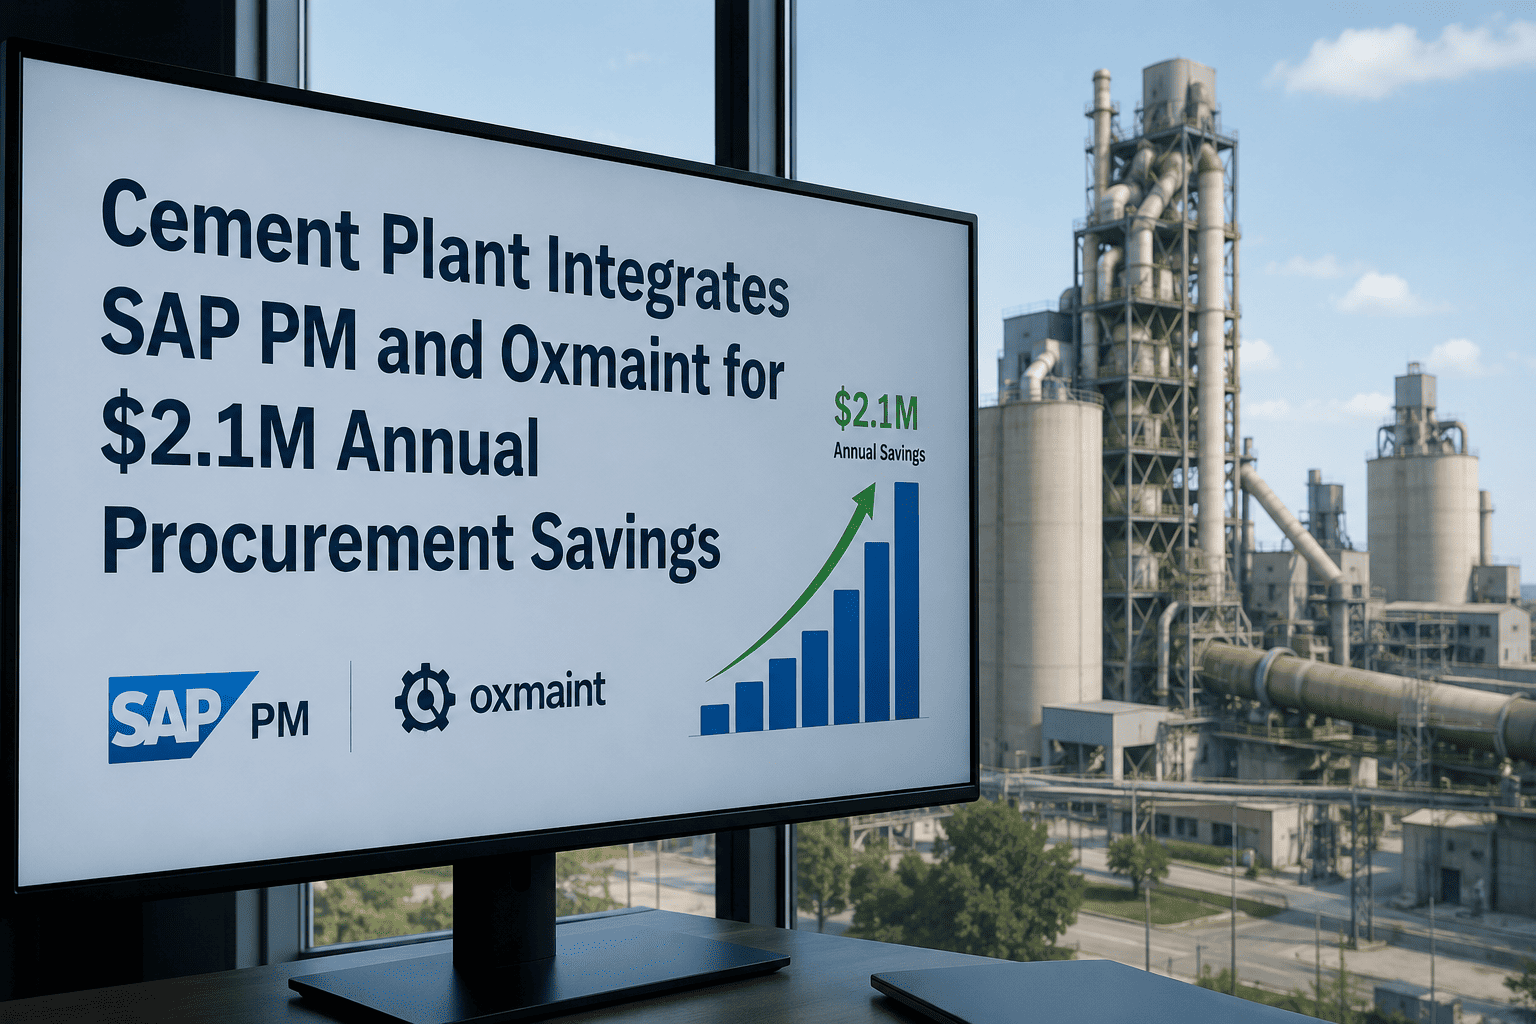
| Portfolio CapEx aggregation | Group-level capital forecast from plant-level RUL data — CFO sees total group capital exposure, not five separate plant budget requests | Annual CapEx process involves manual data collection from each plant team |
| PM template push from corporate | Best practice PM procedures from top-performing plants deployed to all sites without requiring local IT work at each plant | Best practice procedures documented but never operationalized at underperforming plants |
What cement groups achieve in the first 12 months of unified CMMS
What group operations leaders ask about multi-site CMMS rollouts
Stop managing a collection of disconnected plants. Start governing a high-performance network.
Oxmaint's enterprise cement CMMS gives corporate maintenance leaders the infrastructure to standardize PM procedures, benchmark every plant from a single dashboard, and generate group-level CapEx forecasts without monthly data collection exercises. Portfolio-level visibility. Plant-level control.