Every cement plant manager who has walked into a capital review meeting armed only with production tonnage and last quarter's downtime numbers knows the feeling: the CFO asks a benchmark question you cannot answer, and the room goes quiet. The 2026 landscape of cement industry reports from organizations like GCCA, IEA, PCA, IFC, and McKinsey contains precisely the data you need to frame maintenance investment, justify ESG targets, and benchmark your plant's performance against global peers. The challenge is that these reports are lengthy, densely technical, and scattered across different organizations with different metrics. This guide distills the most actionable insights from the top five 2026 cement industry reports, maps them to real plant decisions, and shows how the right CMMS platform converts benchmark data into measurable operational improvement. For maintenance and operations teams ready to translate industry standards into plant-level action, Oxmaint provides the operational infrastructure to close the gap between where your plant is and where the benchmarks say it should be.
INDUSTRY INTELLIGENCE · 2026 CEMENT REPORTS GUIDE
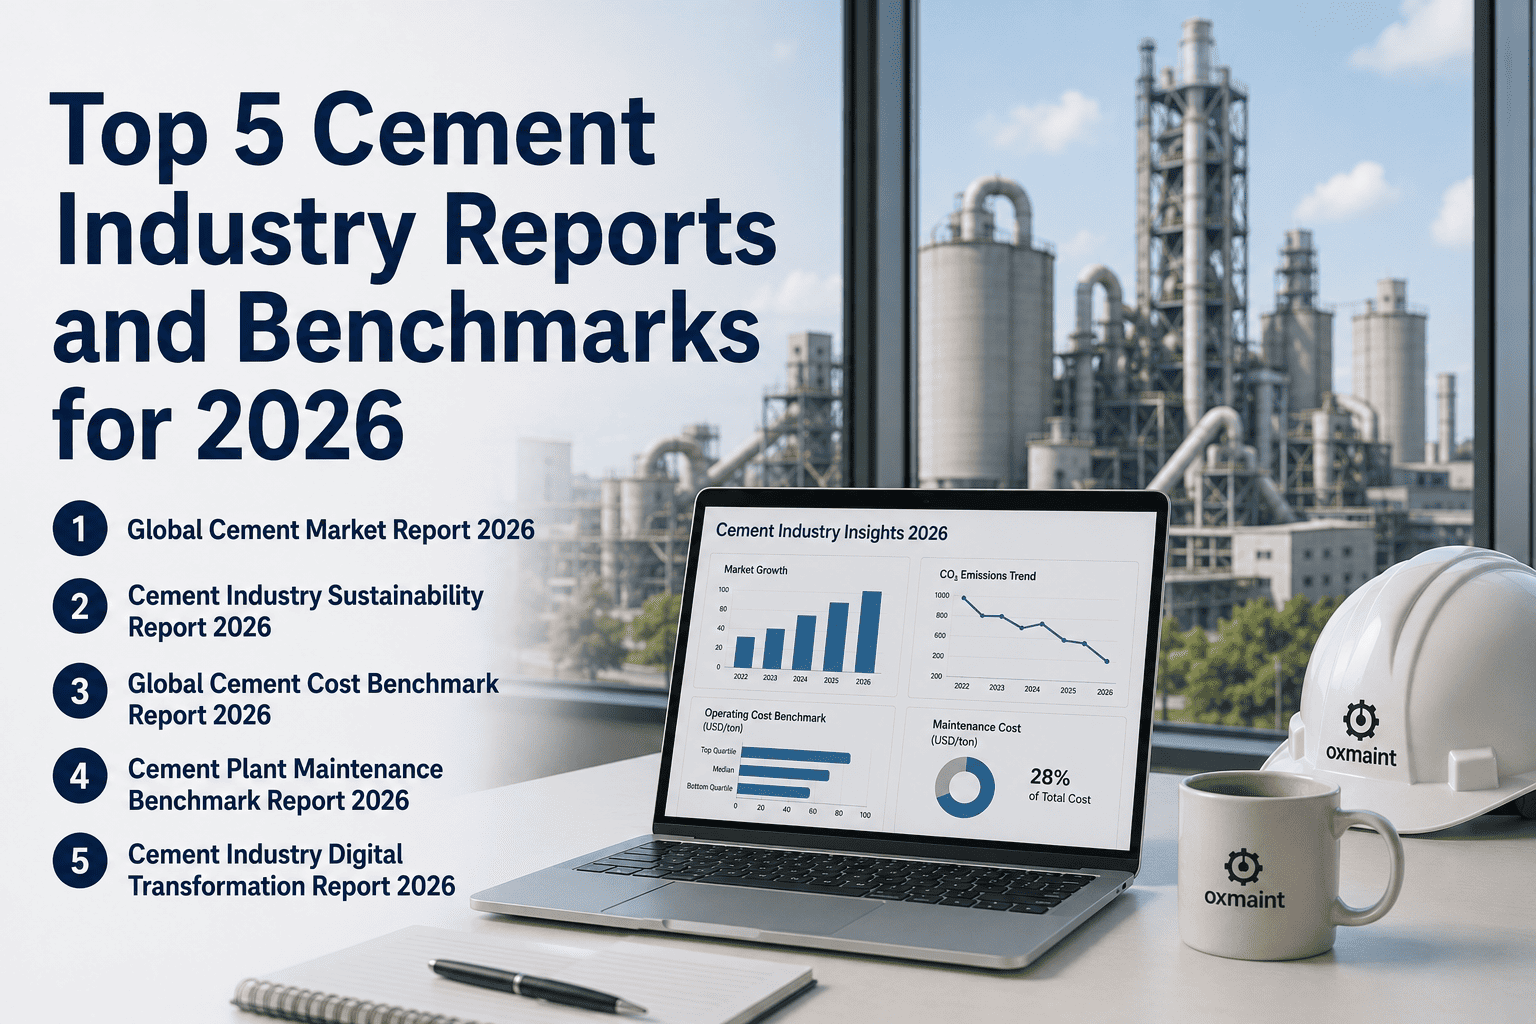
Top 5 Cement Industry Reports and Benchmarks for 2026
GCCA, IEA, PCA, IFC, and McKinsey publish data every year that defines what world-class cement operations look like. Here is what the 2026 editions say — and what it means for your maintenance strategy, decarbonization targets, and capital planning.
4.1B
tonnes of global cement production annually
7-8%
of global CO2 emissions from cement (IEA 2023)
0.60
tonnes CO2 per tonne cement — current global average intensity
3%
annual emissions reduction needed for NZE 2030 alignment
01
GCCA
Cement and Concrete Industry Net Zero Action and Progress Report 2025/26
Published: November 2025 | Scope: Global | Focus: Decarbonization progress and policy gaps
The GCCA's flagship annual report documents that the global cement industry has achieved a 25% CO2 intensity reduction and that nearly 50% of production outside China is now covered by formal decarbonization roadmaps. It features over 60 standout projects spanning CCUS deployment, alternative fuel transitions, clinker substitution, and renewable energy integration.
Key Insights for Plant Managers
Free ETS allowances in Europe decline 4.3% annually from 2027 — plants without completed AFR transitions face full carbon cost exposure with no buffer period
The report calls urgently for policies promoting waste-to-energy as alternative fuel for kilns — regulatory tailwinds favor plants that can demonstrate co-processing capability
Maintenance and asset reliability are identified as foundational enablers of AFR scale-up — equipment that fails during fuel transitions destroys decarbonization economics
CMMS connection: Plants tracking AFR rate, CEMS compliance, and emission maintenance logs in a unified CMMS can directly populate GCCA-format progress reporting without manual data assembly.
02
IEA
IEA Cement Sector Tracking and Net Zero Emissions by 2050 Scenario
Published: Ongoing updates | Scope: Global | Focus: Energy intensity and emissions pathway modeling
The IEA tracks that the global clinker-to-cement ratio has risen at 1.1% annually since 2015, reaching 0.71 in 2022. Cement emissions intensity has remained at approximately 0.60 t CO2 per tonne for several years. The Net Zero Emissions Scenario requires average thermal energy intensity below 3.4 GJ per tonne of clinker and electricity intensity below 90 kWh per tonne of cement by 2030.
Key Insights for Plant Managers
Fossil fuels still represent 90% of thermal energy — the shift to alternative fuels requires reliable preprocessing and dosing equipment that generic maintenance programs cannot track accurately
NZE scenario thermal targets (3.4 GJ/t clinker) require consistent burner, kiln, and heat recovery maintenance — equipment degradation silently inflates energy intensity above benchmark
CCUS deployment adds energy penalty of approximately 5 kWh per tonne cement — plants need precise energy performance tracking to separate CCUS overhead from operational inefficiency
CMMS connection: EnPI tracking in CMMS links kiln and burner maintenance events to specific energy consumption data, making it possible to measure the direct energy impact of each maintenance intervention.
03
PCA
Portland Cement Association Plant Information Summary
Published: Annual | Scope: North America | Focus: Plant capacity, fuel use, and operational benchmarks
The PCA Plant Information Summary provides the most granular North American benchmarks for kiln capacity, fuel type distribution, production efficiency, and maintenance investment levels. The 2026 edition reinforces the trend of clinker-to-cement ratio reduction efforts in the US and Canada while documenting widening performance gaps between plants operating structured maintenance programs and those running reactive.
Key Insights for Plant Managers
US clinker-to-cement ratio remains high at 0.89 versus global average of 0.71 — reducing it requires reliable supplementary cementitious material processing equipment, not just procurement
Plants with structured preventive maintenance programs consistently outperform reactive operations by 15-20% on production efficiency KPIs in PCA benchmarking data
Clean Air Act and EPA NHSM Rule compliance documentation requirements are increasing — maintenance records tied to fuel qualification are becoming a regulatory necessity, not optional
CMMS connection: PCA benchmark KPIs — OEE, MTBF, specific energy consumption — are trackable natively in purpose-built cement CMMS, enabling direct comparison against PCA peer group data.
04
IFC / World Bank
IFC Environmental, Health and Safety Guidelines for Cement and Lime Manufacturing
Published: Active standard, updated periodically | Scope: Global (developing markets focus) | Focus: EHS compliance and operational standards
The IFC EHS Guidelines define minimum performance standards for cement plants seeking international financing and ESG rating credibility. They set specific thresholds for emissions, noise, effluent, and occupational safety that are increasingly referenced by ESG analysts and institutional investors when evaluating cement company disclosures in India, Southeast Asia, the Middle East, and Africa.
Key Insights for Plant Managers
IFC guidelines are referenced in ESG analyst frameworks for cement companies — plants seeking investment-grade ESG ratings need maintenance documentation that directly addresses IFC thresholds
Emissions monitoring and CEMS maintenance records are explicitly required under IFC standards — CMMS-linked compliance documentation satisfies these requirements automatically
Occupational health and safety inspection records must be audit-ready — plants with paper-based maintenance logs face IFC compliance gaps that can affect project financing approvals
CMMS connection: Safety inspection records, CEMS maintenance logs, and environmental equipment PM history stored in CMMS provide the audit-ready documentation trail that IFC compliance reviews require.
05
McKinsey
McKinsey Global Cement Industry Decarbonization and Productivity Analysis
Published: 2025-2026 series | Scope: Global | Focus: Operational productivity, decarbonization economics, and technology adoption
McKinsey's cement sector analysis in 2026 reinforces the widening gap between digital leaders and laggards in the industry. Plants deploying predictive maintenance and digital asset management achieve 15-25% better OEE than peer group averages. The analysis documents that maintenance-related downtime represents the single largest controllable driver of cost-per-tonne variance within peer groups operating similar equipment.
Key Insights for Plant Managers
Maintenance-related downtime is the largest controllable cost-per-tonne driver within plant peer groups — organizations that digitize maintenance first outperform those that invest in new equipment with poor maintenance programs
Digital maintenance leaders achieve 15-25% better OEE than peer group averages — the gap compounds over time as data quality improves and predictive models become more accurate
Carbon cost exposure for plants without structured decarbonization tracking is being priced into cement sector valuations by institutional investors — board-level visibility requires operational data, not just strategy documents
CMMS connection: CMMS OEE dashboards, MTBF tracking, and cost-per-tonne maintenance analytics directly address the McKinsey performance benchmarks — and provide the board-level visibility that investment analysts increasingly require.
BENCHMARK COMPARISON
2026 cement industry KPI benchmarks across performance tiers
| KPI |
Reactive Plants |
Structured PM Plants |
Digital Leaders |
Source |
| OEE |
62-68% |
74-80% |
85-91% |
McKinsey / iFactory Benchmark |
| Unplanned downtime (hrs/year) |
180-220 |
90-130 |
40-70 |
Industry Benchmark Report 2026 |
| PM compliance rate |
45-60% |
75-85% |
90-97% |
Oxmaint deployment data |
| Specific energy (GJ/t clinker) |
3.8-4.2 |
3.5-3.8 |
3.2-3.5 |
IEA NZE Scenario benchmarks |
| Emergency repair % of maintenance spend |
40-55% |
20-30% |
8-15% |
McKinsey Operations Analysis |
| CO2 intensity (t CO2/t cement) |
0.65-0.72 |
0.58-0.65 |
0.48-0.58 |
GCCA Progress Report 2025/26 |
Where does your plant stand against these benchmarks?
Oxmaint calculates your plant's current OEE, PM compliance rate, and maintenance cost structure against 2026 industry benchmarks — and shows you exactly what closing the gap looks like in financial terms.
FROM REPORTS TO ACTION
Translating benchmark data into plant-level decisions
If your OEE is below 75%
McKinsey data shows this gap is almost always attributable to unplanned downtime and missed PM — not equipment age. The fastest path to the 80%+ tier is structured preventive maintenance with mobile work order execution and automated scheduling.
If your emissions intensity is above 0.62
IEA benchmarks place this above the current global average, which means regulatory exposure is growing. AFR rate improvement and kiln energy efficiency maintenance are the two fastest levers — both require CMMS-tracked maintenance protocols.
If emergency repairs exceed 30% of maintenance spend
PCA and McKinsey data both identify this threshold as the dividing line between reactive and structured programs. Plants above 30% emergency spend are paying 3-4x the cost of planned maintenance for the same repair work — CMMS PM compliance is the antidote.
If your ESG documentation is manual
IFC and GCCA reporting standards are increasingly referenced by lenders and institutional investors. Plants that cannot produce audit-ready maintenance and emissions compliance records on demand face growing cost of capital risk as sustainability disclosure requirements tighten.
FREQUENTLY ASKED QUESTIONS
What readers ask about cement industry benchmarks and CMMS
Stop reading benchmarks. Start closing the gap.
GCCA, IEA, PCA, IFC, and McKinsey all point to the same conclusion: structured, data-driven maintenance is the fastest path to world-class performance. Oxmaint gives your cement plant the platform to measure every KPI these reports track — and improve them, month by month.