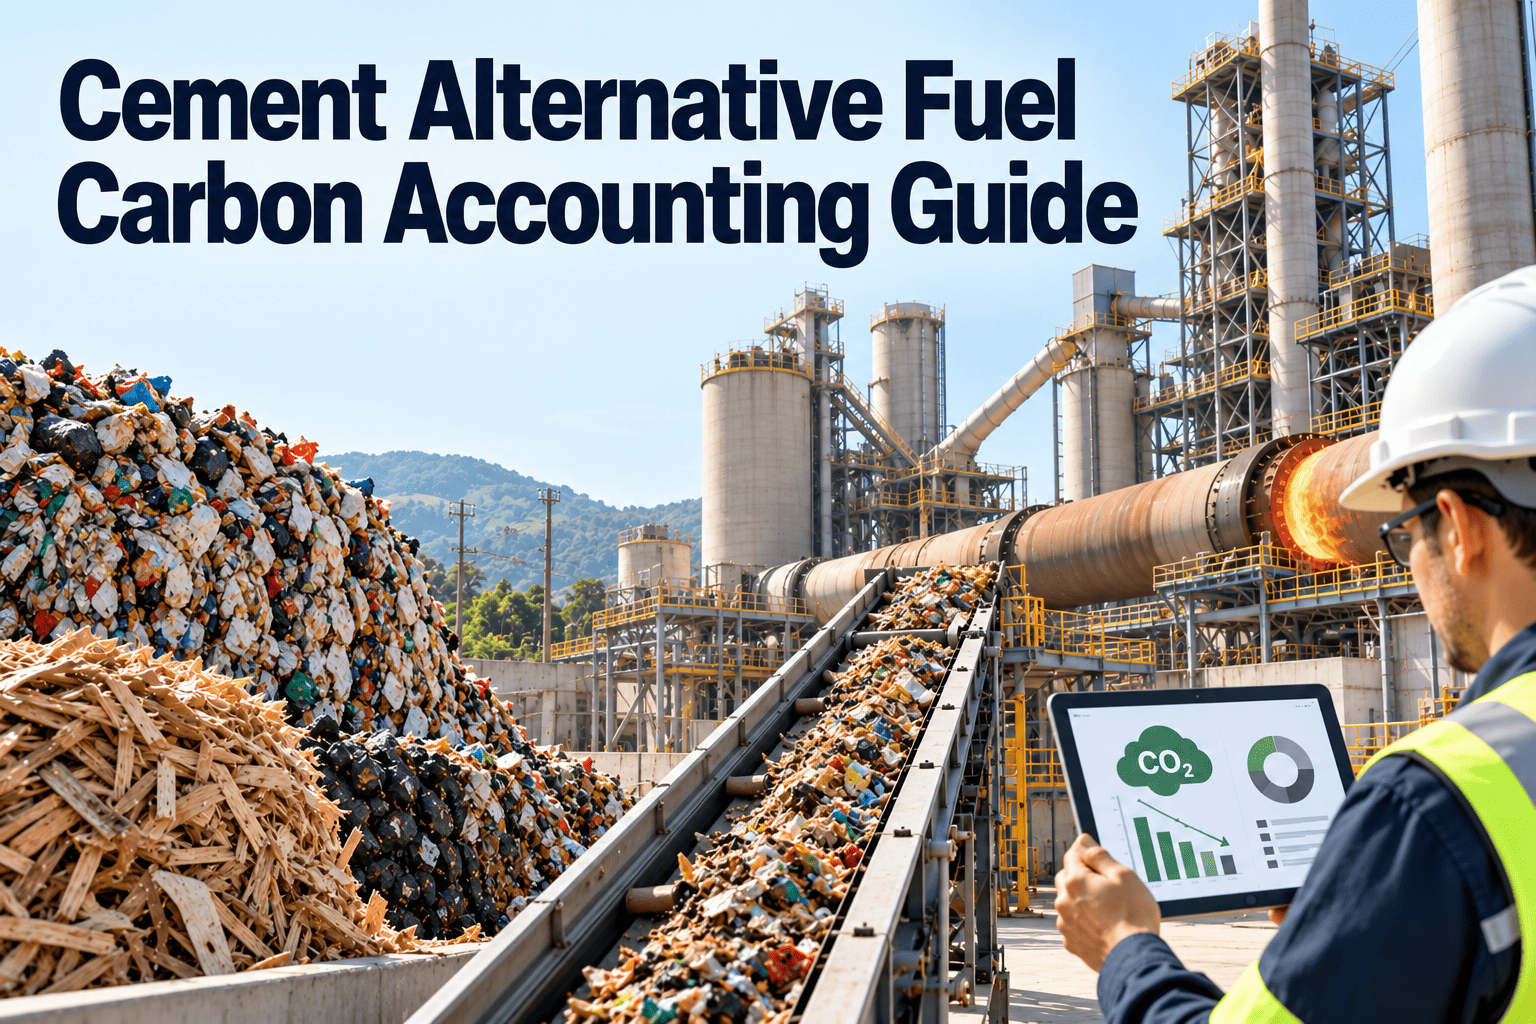
Burning alternative fuels in a cement kiln can lower fossil CO2, but only if the numbers behind the claim are defensible. Every tonne of refuse-derived fuel, biomass, or tyre chips needs a weight, a calorific value, a carbon factor, and a biomass share that auditors can trace. Those inputs depend on weighfeeders, samplers, and lab routines that must stay calibrated and documented. This guide explains how alternative fuel carbon accounting works and how a cement maintenance management platform protects the data behind it.
Alternative Fuel Carbon Accounting That Stands Up to Verification
Accurate carbon reporting starts at the feeder and the sampler. Keep metering equipment, inspections, and calibration records under control so substitution claims hold up.
1. Fuel in
Tonnes weighed at feeder
Net calorific value
Moisture and ash
Split
2. Carbon split
Fossil carbon share
Biogenic carbon share
Emission factor source
Report
3. Reported result
Gross and net CO2
Thermal substitution rate
Audit trail
Audit Lens
Four Questions a Verifier Will Ask About Your Alternative Fuels
Most reporting problems are not calculation errors. They are evidence gaps. Prepare answers to these questions before the audit window opens.
Q1
How was the quantity measured?
Which weighfeeder or scale, when it was last calibrated, and how drift was detected.
Q2
How representative is the sample?
Sampling point, frequency, sample preparation, and whether the sampler was working.
Q3
Where does the biomass share come from?
Method used, laboratory, update frequency, and the fuel batches covered.
Q4
Can you reproduce the figure?
Raw data, factors, and calculation steps that lead to the reported tonnes of CO2.
Fuel Types
Carbon Character of Common Cement Kiln Fuels
Carbon treatment differs by fuel. Mixed wastes need the most care because fossil and biogenic carbon sit together.
| Fuel | Carbon character | Key data needed | Main handling risk |
|---|---|---|---|
| Coal and petcoke | Fossil | Tonnes, calorific value, carbon content | Weigher drift |
| Biomass such as husk or sawdust | Mostly biogenic | Tonnes, moisture, source documents | Fire and moisture variation |
| Refuse-derived fuel | Mixed fossil and biogenic | Biomass fraction, calorific value, moisture | Variable composition, feeder blockage |
| Waste tyres | Mixed, with a biogenic part | Rubber composition, tonnes | Dosing accuracy |
| Solvents and liquid wastes | Usually fossil | Batch analysis, density, volume | Pump and meter calibration |
Accounting Flow
From Delivery to Reported CO2: Six Control Points
Each step below is a place where equipment condition or missing records can weaken the final figure.
1
Receive and classify
Weighbridge, delivery documents, fuel code
2
Sample
Representative increments, labelled and stored
3
Dose to kiln
Weighfeeders and meters at main burner and calciner
4
Analyse
Calorific value, moisture, carbon, biomass share
5
Calculate
Apply factors, aggregate by period
6
Verify
Review evidence, correct, archive
Data Quality
Maintenance Issues That Quietly Distort Carbon Numbers
Equipment faults rarely trigger an alarm, yet they change reported emissions. Link each risk to a scheduled check.
| Equipment issue | Effect on accounting | Preventive control |
|---|---|---|
| Weighfeeder drift or belt wear | Over or under reported fuel tonnes | Scheduled calibration and zero checks |
| Sampler blockage or poor sampling point | Unrepresentative calorific value or biomass share | Inspection and cleaning route |
| Bridging in bins and chutes | Feed interruptions logged as normal feeding | Level and flow inspections |
| Unlogged meter replacement | Broken measurement history | Asset change records |
| Lab equipment out of calibration | Analysis results challenged | Calibration schedule with certificates |
When a measuring device is repaired or replaced, record the date and time. Verifiers often ask what changed and how the data gap was handled.
Keep Calibration and Inspection Evidence Audit Ready
Schedule feeder calibrations, sampler inspections, and meter checks, then store results beside the asset so evidence is ready when verification starts.
Core Metrics
Thermal Substitution Rate and Net Emissions Explained
Two figures dominate alternative fuel reporting. Understand what drives each one.
Thermal substitution rate
Alternative fuel heat input divided by total kiln heat input
Depends on accurate tonnes and calorific value for every fuel stream.
Net CO2 from fuels
Gross fuel CO2 minus the share allowed as biogenic
Depends on a documented biomass share and the rules of the scheme in use.
Specific fuel emission
Fuel CO2 divided by clinker produced
Also affected by kiln heat consumption, so stable operation matters.
A higher substitution rate does not automatically mean lower emissions. Fuel chemistry, moisture, and kiln stability all change the result, which is why measurement quality matters.
Compliance Landscape
Frameworks That Shape Alternative Fuel Reporting
Requirements differ by country and scheme. Confirm the current text with your regulator or verifier before publishing figures.
Industry protocols
The GCCA cement CO2 and energy protocol sets common methods for gross and net emissions and alternative fuel reporting across producers.
Emissions trading schemes
Systems such as the EU ETS set monitoring rules, including how biomass and waste fuels are treated and what evidence is required.
Carbon border mechanisms
The EU CBAM covers cement and requires embedded emissions data from producers, with the definitive period applying from 2026.
Customer and investor disclosure
Buyers and lenders increasingly request product-level emissions, so sound fuel data supports every downstream claim.
Before and After
Spreadsheet Reporting vs Maintenance-Linked Carbon Data
Disconnected records
- Calibration certificates stored in different folders
- Feeder faults known only to operators
- Sampling gaps found during verification
- Manual rework to explain data anomalies
Linked maintenance and carbon evidence
- Calibration history attached to each measuring asset
- Faults and repairs logged with date and time
- Sampler inspections scheduled and signed off
- Reports pulled by asset, period, and work type
Equipment Plan
Maintenance Priorities for Alternative Fuel Systems
Measurement assets
- Weighfeeder calibration and belt condition
- Load cell and speed sensor checks
- Flow meters for liquid fuels
- Automatic sampler cleaning and function tests
Handling assets
- Shredder and screen wear parts
- Bin discharge, airlocks, and conveying lines
- Fire detection and suppression in storage
- Burner and calciner feed points
Handling assets affect carbon data indirectly. Blockages cause unstable kiln heat input, which changes fuel use per tonne of clinker and complicates comparison between periods.
Biomass Share
Methods Used to Determine Biomass Fraction in Mixed Fuels
Mixed fuels such as refuse-derived fuel need a tested biomass share. Standards such as EN 15440 and ASTM D6866 describe common approaches, and your scheme or verifier decides which are accepted.
| Method | How it works | Practical consideration |
|---|---|---|
| Selective dissolution | Chemicals dissolve the biogenic part of a sample, and the remainder is measured | Needs careful sample preparation and a competent laboratory |
| Radiocarbon analysis | Measures carbon-14 content to separate biogenic from fossil carbon | Accurate but costly, so sampling plans matter |
| Manual sorting | Sample is separated by material type and weighed | Labour intensive and depends on operator consistency |
| Balance method | Calculates the share from plant energy and mass balances | Depends on well-maintained process measurements |
Whichever method you use, the sample must represent the batch it covers. A perfect laboratory result from a poor sample still produces a weak figure.
Common Pitfalls
Six Mistakes That Weaken Alternative Fuel Carbon Reports
These issues appear again and again in plant reviews. Most can be avoided with clear procedures and disciplined records.
1
Mixing wet and dry basis
Moisture changes tonnes and calorific value, so every figure needs a stated basis.
2
Using default factors by habit
Measured values are often more representative than generic factors when data exists.
3
Unclear reporting boundaries
Fuels used in dryers, kilns, and calciners must be assigned consistently.
4
Unlogged feeder changes
Replaced load cells or revised settings break the link between old and new data.
5
Stale biomass share
Supplier changes can shift composition long before the next scheduled test.
6
Evidence held by one person
Records kept in personal files disappear when staff change roles.
Kiln Impact
How Fuel Quality Affects Kiln Stability and Maintenance Load
Alternative fuels influence more than carbon. Their chemistry and physical form change wear, buildup, and feed reliability.
Chlorine and alkalis
Higher input can increase buildup in preheater and kiln inlet
Plan cleaning, inspection, and bypass checks where the process requires them.
Moisture and particle size
Wet or oversized material causes bridging and uneven feeding
Inspect bins, screens, and airlocks more often when fuel quality varies.
Abrasive contaminants
Metals, glass, and stones speed wear on shredders and conveying lines
Track wear parts by tonnes handled, not only by calendar time.
Annual Rhythm
A Year-Round Plan for Verification-Ready Fuel Data
Quarter 1: Prepare
Close the previous reporting period, review audit findings, and update monitoring plans and fuel codes.
Quarter 2: Calibrate
Complete weighfeeder, meter, and laboratory calibrations before the heaviest production months.
Quarter 3: Test and review
Refresh biomass share testing, review sampler performance, and check data gap hours.
Quarter 4: Assemble evidence
Collect certificates, repair logs, and calculations so verification starts with complete files.
Readiness
Pre-Verification Readiness Checklist
Equipment evidence
- Current calibration certificates for every metering point
- Repair and replacement dates for measuring devices
- Sampler inspection records for the full period
- Explanation notes for any estimated data
Fuel evidence
- Delivery records and fuel classification codes
- Laboratory reports linked to batches
- Latest biomass share test results
- Factors and sources used in calculations
Oxmaint Workflow
How Oxmaint Supports Carbon Data Integrity
Oxmaint does not replace emissions calculation tools. It keeps the equipment records and tasks behind those calculations organised.
01
Asset records for measuring equipment
Register weighfeeders, samplers, meters, and lab instruments with serial numbers and history.
02
Preventive calibration schedules
Generate recurring calibration and inspection work orders with due dates and owners.
03
Mobile inspection checklists
Capture sampler checks, bin conditions, and photos on a phone during rounds.
04
Corrective work and downtime notes
Log feeder faults and repairs so data gaps can be explained to verifiers.
05
Spares and compliance records
Track load cells, belts, and sampler parts, and keep calibration documents attached.
06
Reports and dashboards
Review overdue calibrations and repeat faults before the reporting period closes.
KPIs
Indicators to Track Alongside Carbon Reports
Calibration compliance
Percentage of measuring assets calibrated on or before the due date
Feeder availability
Hours each alternative fuel feeder was ready compared with planned hours
Sampling completeness
Share of planned samples collected and analysed
Data gap hours
Time when fuel measurement was unavailable or estimated
Repeat fuel system faults
Failures on the same feeder, chute, or sampler within a set period
Risk Ranking
Which Fuel Data Risks Deserve Attention First
Rank each measurement point by how much it affects reported emissions and how likely it is to fail. Start maintenance effort where both are high.
| Measurement point | Impact on reported CO2 | Failure likelihood | Suggested control level |
|---|---|---|---|
| Main fuel weighfeeders | High | Medium | Frequent calibration and drift checks |
| Refuse-derived fuel feeders | High | High | Short inspection interval and spare parts on site |
| Automatic samplers | Medium to high | High | Cleaning routes and function tests |
| Liquid fuel meters | Medium | Low to medium | Scheduled calibration with certificates |
| Weighbridge | Medium | Low | Periodic verification and logbook |
Review this ranking whenever you add a new fuel stream or change a feeder. New equipment often changes both impact and failure likelihood.
Responsibilities
Who Owns Each Part of the Carbon Data Chain
Clear ownership prevents gaps between teams. Write down who acts at each step and where evidence is stored.
| Team | Main responsibility | Evidence produced |
|---|---|---|
| Maintenance | Keep measuring and handling equipment accurate and available | Calibration, inspection, and repair records |
| Operations | Run feeders within set limits and report abnormal events | Shift logs and downtime notes |
| Quality laboratory | Analyse samples and manage laboratory calibration | Test reports and method records |
| Environment and sustainability | Calculate and report emissions to schemes and customers | Calculations, factors, and verification files |
Quick Reference
Key Terms in Alternative Fuel Carbon Accounting
Use consistent definitions across maintenance, operations, and sustainability teams so reports and work records speak the same language.
AF
Alternative fuel
Waste-derived or biomass fuel used instead of conventional fossil fuel in the kiln.
TSR
Thermal substitution rate
Share of kiln heat input supplied by alternative fuels.
NCV
Net calorific value
Usable heat released per unit of fuel, after accounting for moisture.
RDF
Refuse-derived fuel
Processed non-hazardous waste with mixed fossil and biogenic content.
BIO
Biogenic carbon
Carbon from recently living material, treated differently by many schemes.
EF
Emission factor
Value that converts fuel quantity or energy into tonnes of CO2.
MRV
Monitoring, reporting, and verification
The cycle of measuring emissions, reporting them, and having them independently checked.
EE
Embedded emissions
Emissions attributed to a tonne of product, used in border carbon reporting.
FAQ
Alternative Fuel Carbon Accounting Questions
What is the difference between gross and net CO2?
Gross includes all fuel and process CO2. Net removes the biogenic share and credits allowed by the chosen protocol.
Why does biomass fraction need regular testing?
Waste composition changes by supplier and season. Regular testing keeps the reported share defensible. Book a demo to see test scheduling.
Which equipment records do verifiers usually request?
Calibration certificates, repair logs, and sampling records for key meters and feeders. Get started to organise them.
Does a higher substitution rate always cut emissions?
Not always. Moisture, fuel chemistry, and kiln stability affect results, so monitor fuel use per tonne of clinker too.
Can maintenance software calculate emissions?
It supports the evidence trail by managing calibration, inspections, and repairs. Use your carbon reporting tool for the calculation itself.
Protect the Measurements Behind Every Carbon Claim
Bring calibration, inspection, and repair records for your alternative fuel systems into one maintenance platform built for cement plants.