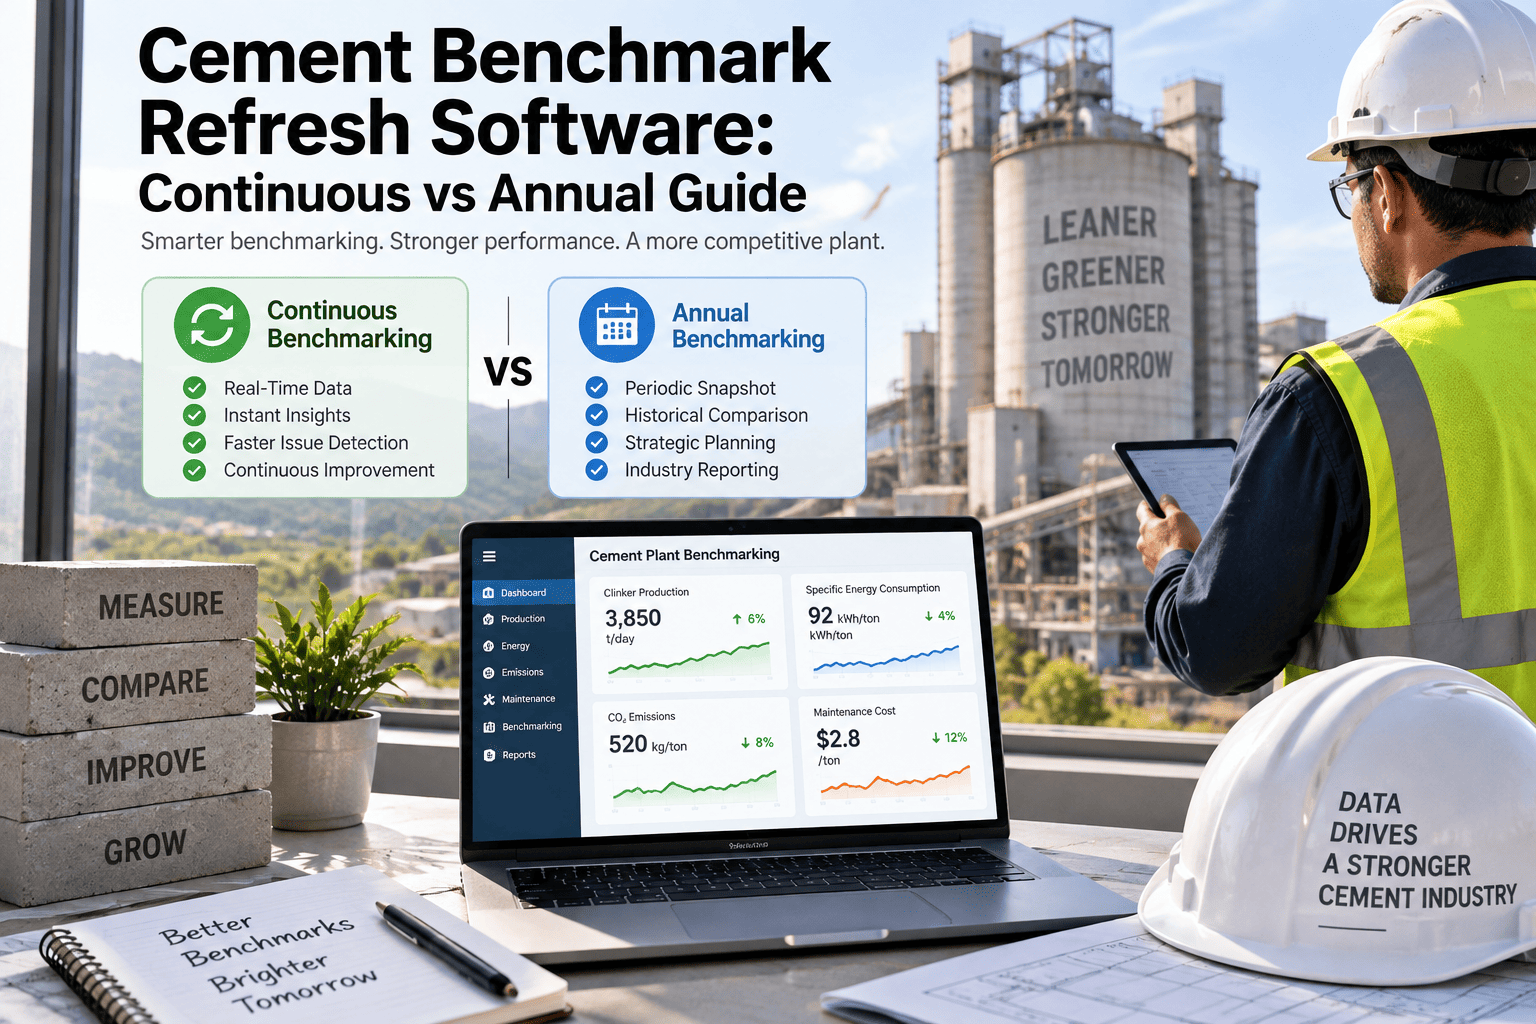
Most cement plants still benchmark performance the way they did a decade ago: an annual audit, a consultant's spreadsheet, and a set of KPI targets that get pinned to the wall in January and forgotten by March. By the time next year's audit rolls around, the plant has drifted 6-9 months away from its own baseline without anyone noticing. A continuous benchmark refresh model — built on live CMMS data instead of a once-a-year snapshot — closes that gap and catches performance drift while it is still cheap to fix.
Stop benchmarking your cement plant once a year and calling it reliability management
Move from a static annual audit snapshot to a weekly benchmark refresh cycle that surfaces specific power consumption, kiln availability, and maintenance cost drift while there is still time to act on it.
Why a once-a-year benchmark is already stale the day it's published
An annual benchmarking exercise — whether run internally, through a consultant, or against a database like the GCCA's Getting the Numbers Right initiative — captures a single point in time. It takes weeks to compile, so the numbers it reports are already three to six months old before the report reaches a plant manager's desk.
Data is stale before it's read
Compilation, review, and consultant sign-off routinely add 8-12 weeks between the data-collection window and the final report landing on a director's desk.
Drift compounds silently between audits
Specific heat consumption, specific power draw, and maintenance cost per tonne can each drift several percentage points across twelve months without triggering any alert.
Root cause gets lost
An annual report shows that kiln availability fell from 93% to 88% — but by the time anyone reads it, nobody can reconstruct which seal, which bearing, or which outage caused it.
Corrective action misses the budget cycle
Findings from a Q1 audit often can't be funded until the following year's capital plan, turning a fixable six-month problem into an eighteen-month one.
Where the annual audit still fits
External benchmarking frameworks — the GCCA's Getting the Numbers Right database, ECRA studies, or a regional cement association survey — remain useful for comparing a plant against its industry peers on an apples-to-apples basis.
In practice, the plants that get the most value from their annual industry benchmark are the ones that already know, week to week, where they stand against their own baseline. The external audit then becomes a confirmation exercise rather than the first time anyone sees the number.
Annual audit snapshot vs continuous benchmark refresh
The two approaches aren't mutually exclusive — most plants still want an external annual audit for board reporting. But it should sit on top of a continuous internal refresh, not replace it.
| Dimension | Annual audit snapshot | Continuous CMMS refresh |
|---|---|---|
| Refresh frequency | Once per year | Weekly or daily |
| Data source | Manual collection, spreadsheets, consultant survey | Live work order, meter, and inspection data |
| Time to detect drift | Up to 12 months | 1-2 weeks |
| Root-cause traceability | Limited — context is lost by report time | Full — linked to the originating work order |
| Cost to correct drift | Higher — problem has compounded | Lower — caught near the source |
| Best used for | External/board benchmarking, industry comparison | Internal reliability management, budget defense |
What twelve months of silence actually costs a plant
This is a representative drift pattern seen when specific power consumption is only checked at the annual audit, based on typical cement kiln operating ranges.
Baseline set at annual audit — 102 kWh/t cement, no visible drift yet.
Separator bypass creeps up; power draw rises roughly 2%, unrecorded until next audit.
Idler friction and false-air ingress compound; specific heat consumption up 4-5%.
Maintenance cost per tonne trending above plan; nobody has flagged it as a single issue.
Annual audit finally reports the full drift — now a multi-department correction project instead of a small fix.
What a caught drift looks like in practice
Consider a 4,500 tonne-per-day plant whose last audit set a specific power baseline of 100 kWh per tonne of cement. Under an annual model, the next reading of this number comes twelve months later.
The annual audit a few months later shows a clean baseline instead of a multi-month drift that would otherwise have cost an estimated 25,000-40,000 kWh in avoidable grinding energy before anyone noticed. Scaled across a full year and a full mill circuit, that is the difference between a footnote in a maintenance log and a line item a plant manager has to explain to a corporate energy team.
Where continuous benchmark programs tend to break down
A weekly refresh cycle is simple in concept but easy to let slide in practice. These are the failure patterns that show up most often once the initial rollout enthusiasm fades.
Tracking too many KPIs from day one
Plants that try to refresh twenty metrics weekly usually stop reviewing any of them within two months. Five well-chosen KPI families sustain far better than twenty loosely tracked ones.
No owner assigned to the variance review
A dashboard nobody is accountable for reviewing quietly turns back into an annual exercise, just with a nicer chart. Ownership has to be named, not implied.
Thresholds set too tight or too loose
A band that's too tight generates alert fatigue within weeks; one that's too loose lets real drift through unnoticed. Thresholds should be revisited after the first quarter of data.
Refresh data and work order data live in separate systems
If the KPI dashboard can't link back to the originating work order, the root-cause tracing that makes continuous refresh valuable disappears entirely, and the program quietly reverts to being a chart nobody can act on.
See what a weekly refresh would show for your plant
Connect your existing meters and work order data and get a live view of drift against last year's baseline.
Building a continuous benchmark refresh cycle inside your CMMS
A continuous refresh doesn't require new hardware in most plants. It requires wiring the meters and work order data you already have into a recurring comparison cycle.
Lock a baseline from your last audit
Import last year's external audit figures — specific power, specific heat, kiln availability, maintenance cost per tonne — as the reference line every refresh compares against.
Map each KPI to a live data source
Power draw comes from motor control center meters, kiln availability from downtime-logged work orders, and maintenance cost from parts and labor postings already inside the CMMS.
Set a weekly refresh cadence
A weekly pull is granular enough to catch drift early without drowning reliability engineers in daily noise. Monthly rollups feed the plant scorecard shown to leadership.
Flag variance beyond a threshold band
A KPI drifting more than roughly 3% from baseline for two consecutive refresh cycles should generate a review task, not wait for the next audit. Requiring two consecutive cycles rather than acting on a single reading filters out the ordinary measurement scatter that would otherwise generate alerts nobody trusts.
Route the flagged variance to a root-cause work order
Because the refresh is tied to live work order data, a drifting KPI can be traced back to the specific asset, shift, or event that started it — while the trail is still fresh.
The five KPI families worth tracking on a continuous cycle
Not every metric needs weekly attention. These five categories cover the KPIs that move fastest and cost the most when left unchecked between audits.
Energy intensity
Specific power consumption (kWh/t cement) and specific heat consumption (kcal/kg clinker), pulled weekly from mill and kiln meters. These two numbers alone typically account for the largest share of a plant's controllable operating cost, so even a small weekly variance is worth tracing back to its source.
Availability & reliability
Kiln availability, mean time between failures on critical rotating equipment, and unplanned downtime hours logged by shift. A slow decline here is often the earliest signal of a bigger reliability problem building elsewhere in the process line.
Maintenance cost
Maintenance cost per tonne of clinker, split between preventive, corrective, and emergency spend categories inside the CMMS. A rising emergency share, even with total spend flat, usually means preventive coverage is quietly slipping.
Asset condition
Refractory campaign life, separator bypass percentage, and idler bearing temperature trends against last year's baseline curve. These lead indicators typically move weeks before the downstream cost or availability numbers do.
Compliance & audit readiness
Inspection completion rate and overdue PM percentage, so the plant walks into next year's audit with a clean record instead of a scramble to backfill months of missed documentation.
Who should actually own the weekly refresh
A continuous benchmark refresh fails when it becomes one more report that nobody is accountable for. The plants that sustain it assign clear ownership at three levels, each looking at a different slice of the same underlying data.
Reliability engineer — weekly variance review
Reviews the flagged KPIs each week, opens a root-cause work order for anything outside the threshold band, and closes the loop before it reaches leadership as a surprise.
Plant manager — monthly rollup
Sees the monthly trend against baseline for all five KPI families, approves corrective spend where the variance justifies it, and tracks progress on open drift items.
Corporate reliability lead — quarterly portfolio view
Compares drift patterns across every plant in the portfolio, identifies which sites are repeatedly missing their own baseline, and feeds findings into next year's audit scope — often surfacing a best-practice fix from one site that the rest of the portfolio hasn't adopted yet.
A realistic first-90-day rollout
Plants that try to benchmark everything at once usually abandon the effort within a quarter. A narrower rollout, expanded gradually, is what actually sticks.
| Phase | Focus | Outcome |
|---|---|---|
| Weeks 1-2 | Import last audit baseline; map power and fuel meters | Working baseline for two KPIs |
| Weeks 3-6 | Add availability and maintenance cost from CMMS work orders | Four of five KPI families live |
| Weeks 7-10 | Add asset condition trends; set variance thresholds | Full five-family refresh running weekly |
| Weeks 11-13 | Build the monthly leadership rollup and portfolio view | Refresh cycle owned and reviewed on schedule |
By the end of week thirteen, the plant has a working refresh cycle covering all five KPI families, a named owner at each review level, and a rollup format leadership actually reads — well ahead of the next scheduled annual audit.
Frequently asked questions
Does a continuous refresh replace our annual third-party benchmark audit?
No. Most plants still keep the external annual audit for board and industry-comparison purposes. The continuous refresh sits underneath it, catching drift between audits so the annual number is never a surprise, and often makes the audit itself faster since the underlying data is already organized.
What data do we need before we can start a weekly refresh cycle?
At minimum, meter readings for power and fuel consumption, and downtime-tagged work orders in your CMMS. Most plants already generate this data through existing motor control center meters and work order logs — it simply isn't pulled together and compared on a recurring schedule today.
How is variance threshold decided for each KPI?
Thresholds are typically set as a percentage band around the last audited baseline — tighter for energy intensity, which tends to be stable week to week, and wider for maintenance cost, which naturally fluctuates with outage scheduling and parts lead times.
Can this work across a multi-plant cement portfolio?
Yes. A shared baseline structure lets a corporate reliability team compare drift across sites on the same KPI set, rather than waiting for each site's separate annual audit cycle to line up. You can Book a Demo to see a multi-site view.
How long does setup take for a single plant?
Most plants map their first five KPIs and get a working weekly refresh running within two to three weeks, once meter and work order data sources are identified. You can Start Free Trial to begin mapping your own baseline.
Your last benchmark audit is already out of date
Set a baseline, connect your live data, and see drift the week it starts — not the year it's reported.
Free 14-day trial · No credit card