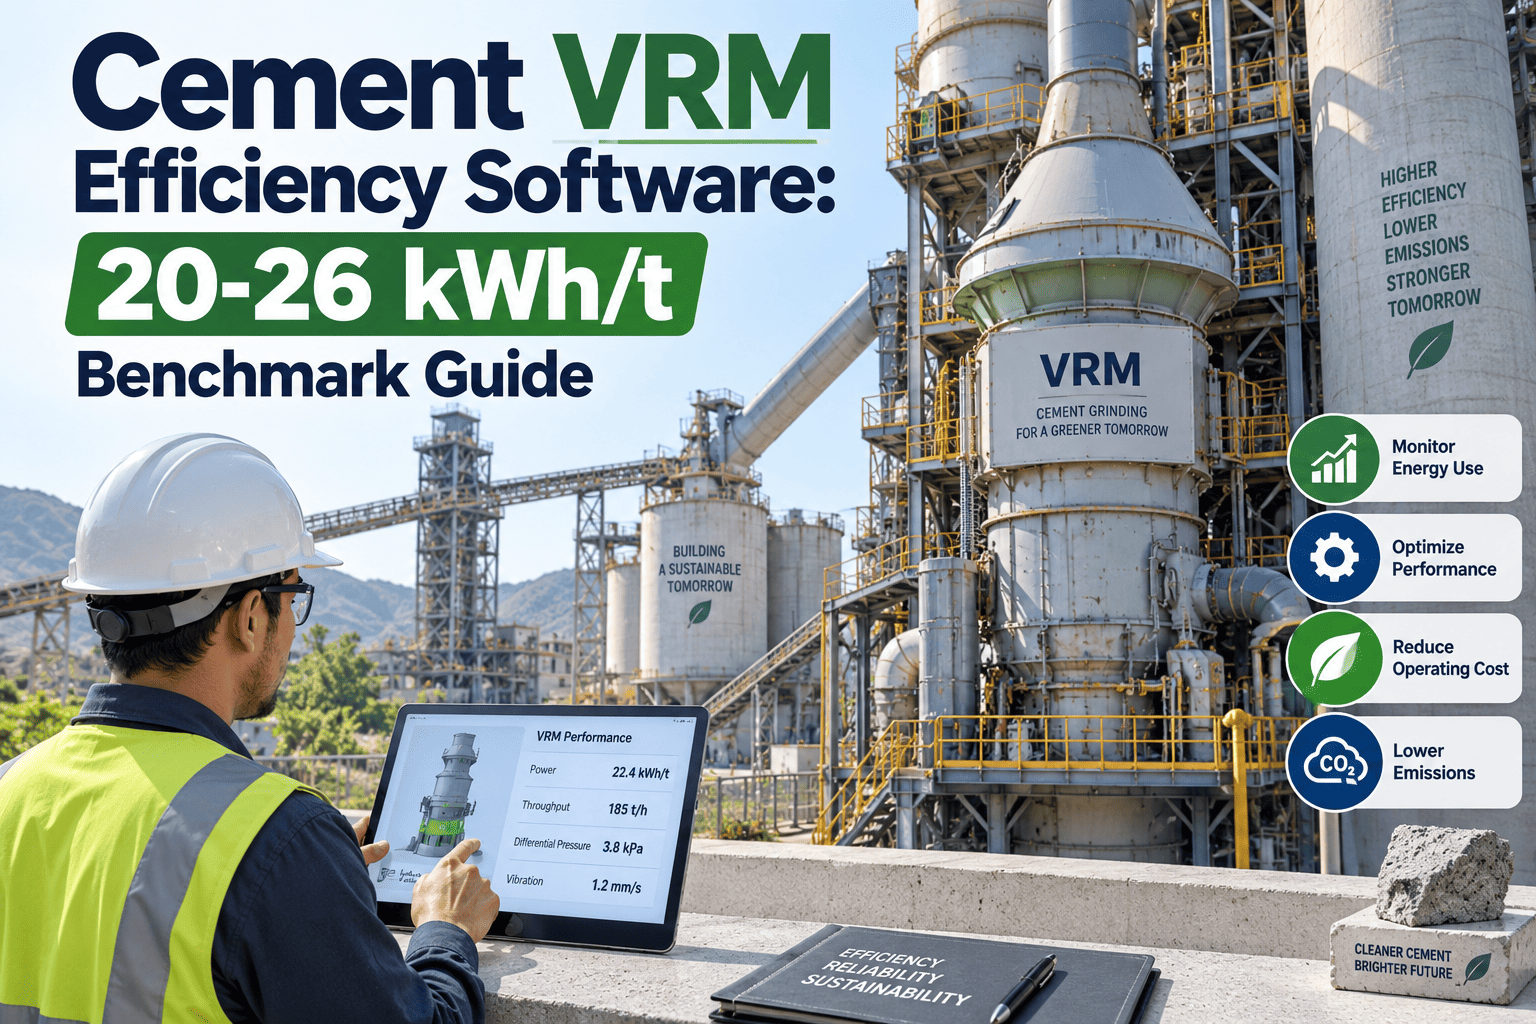
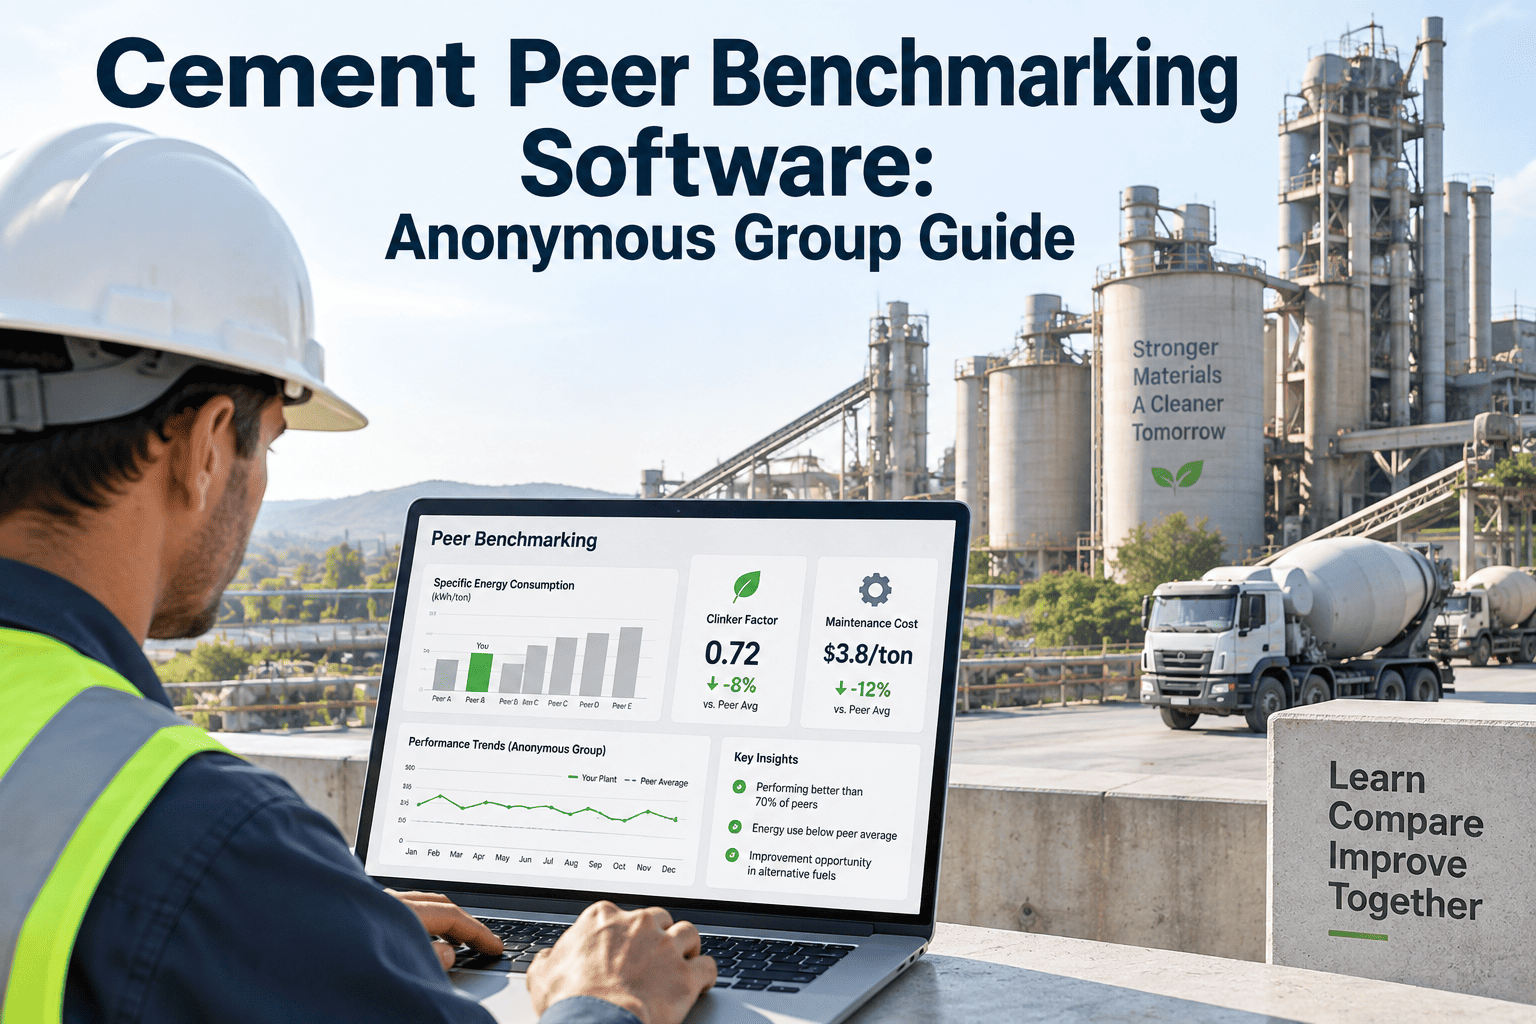
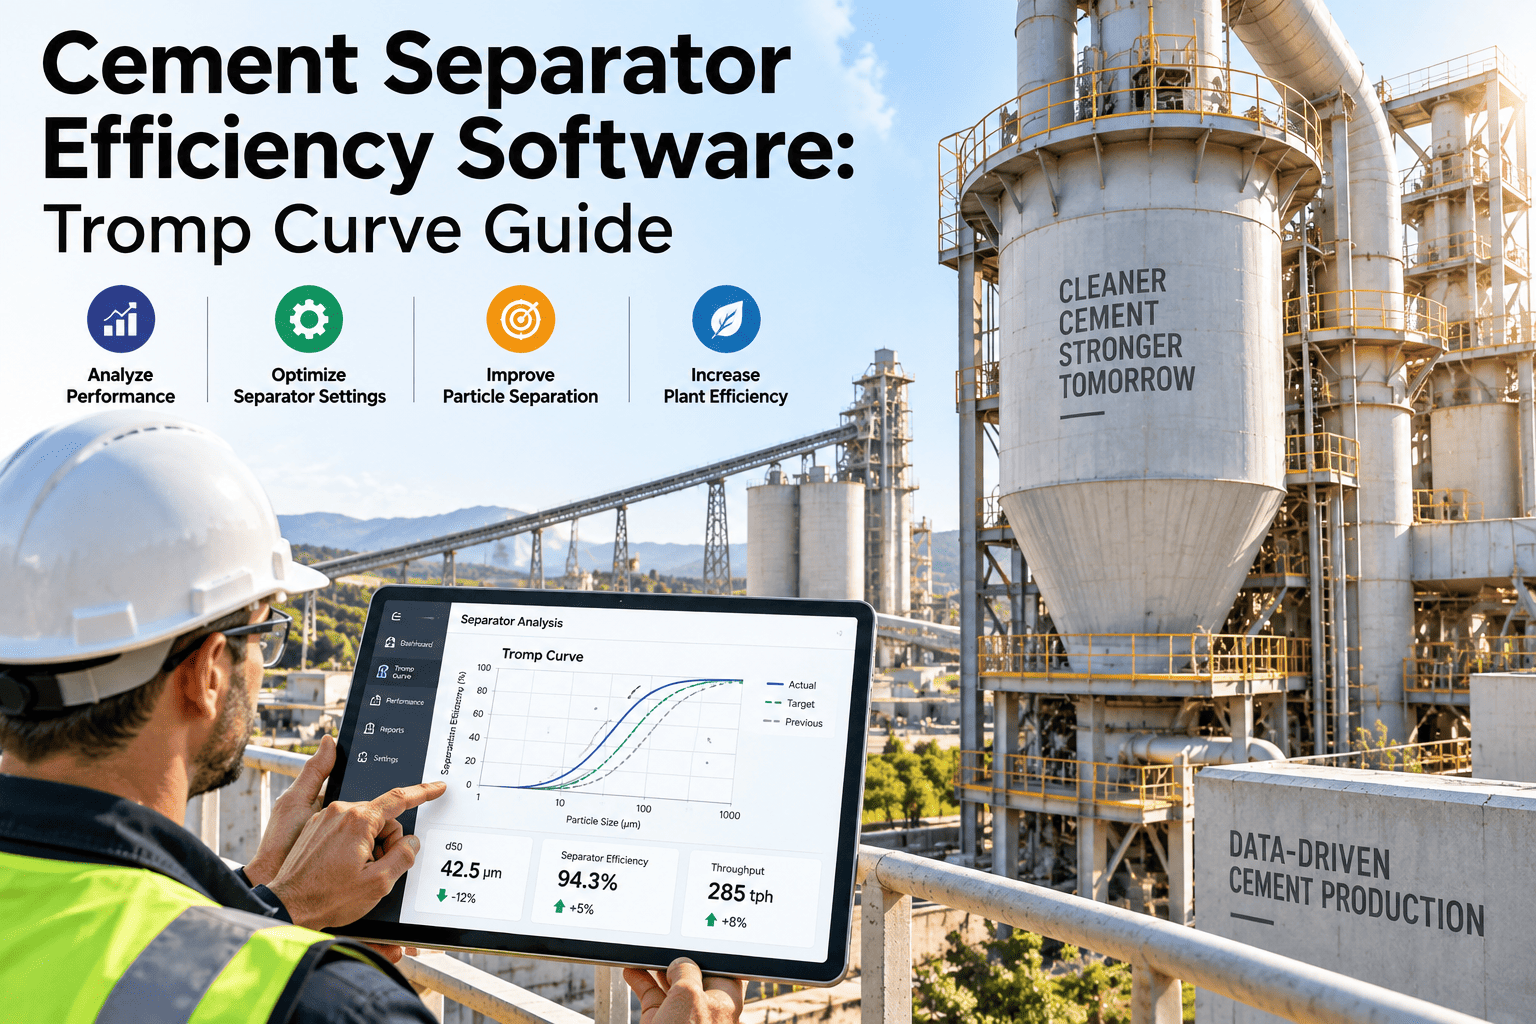
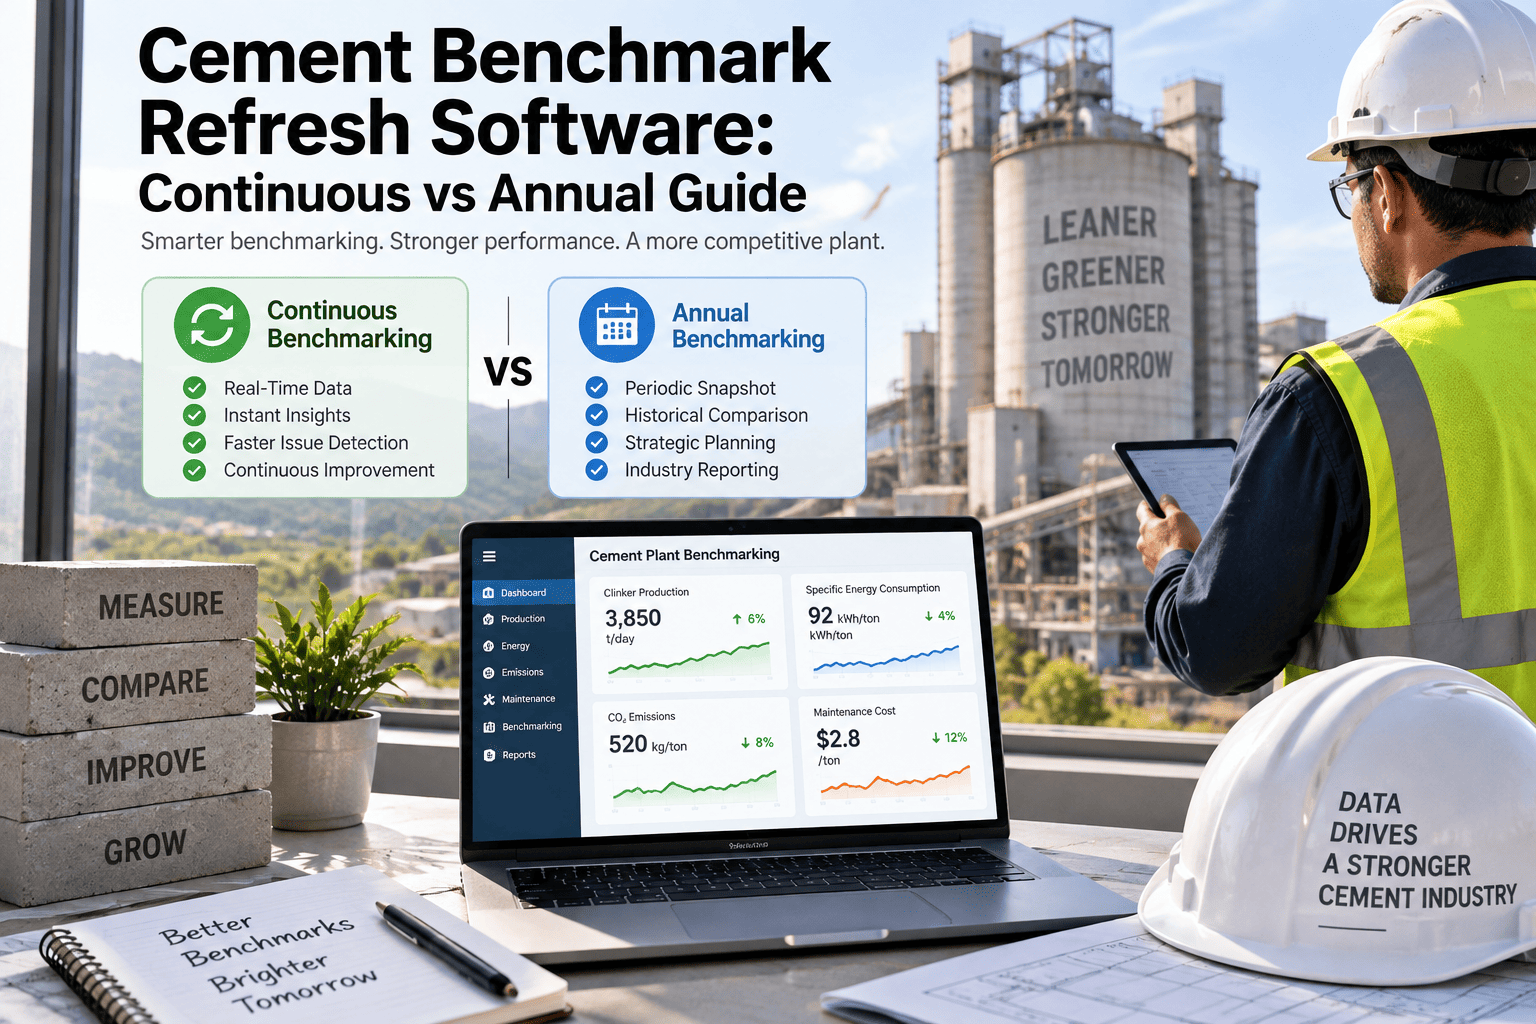
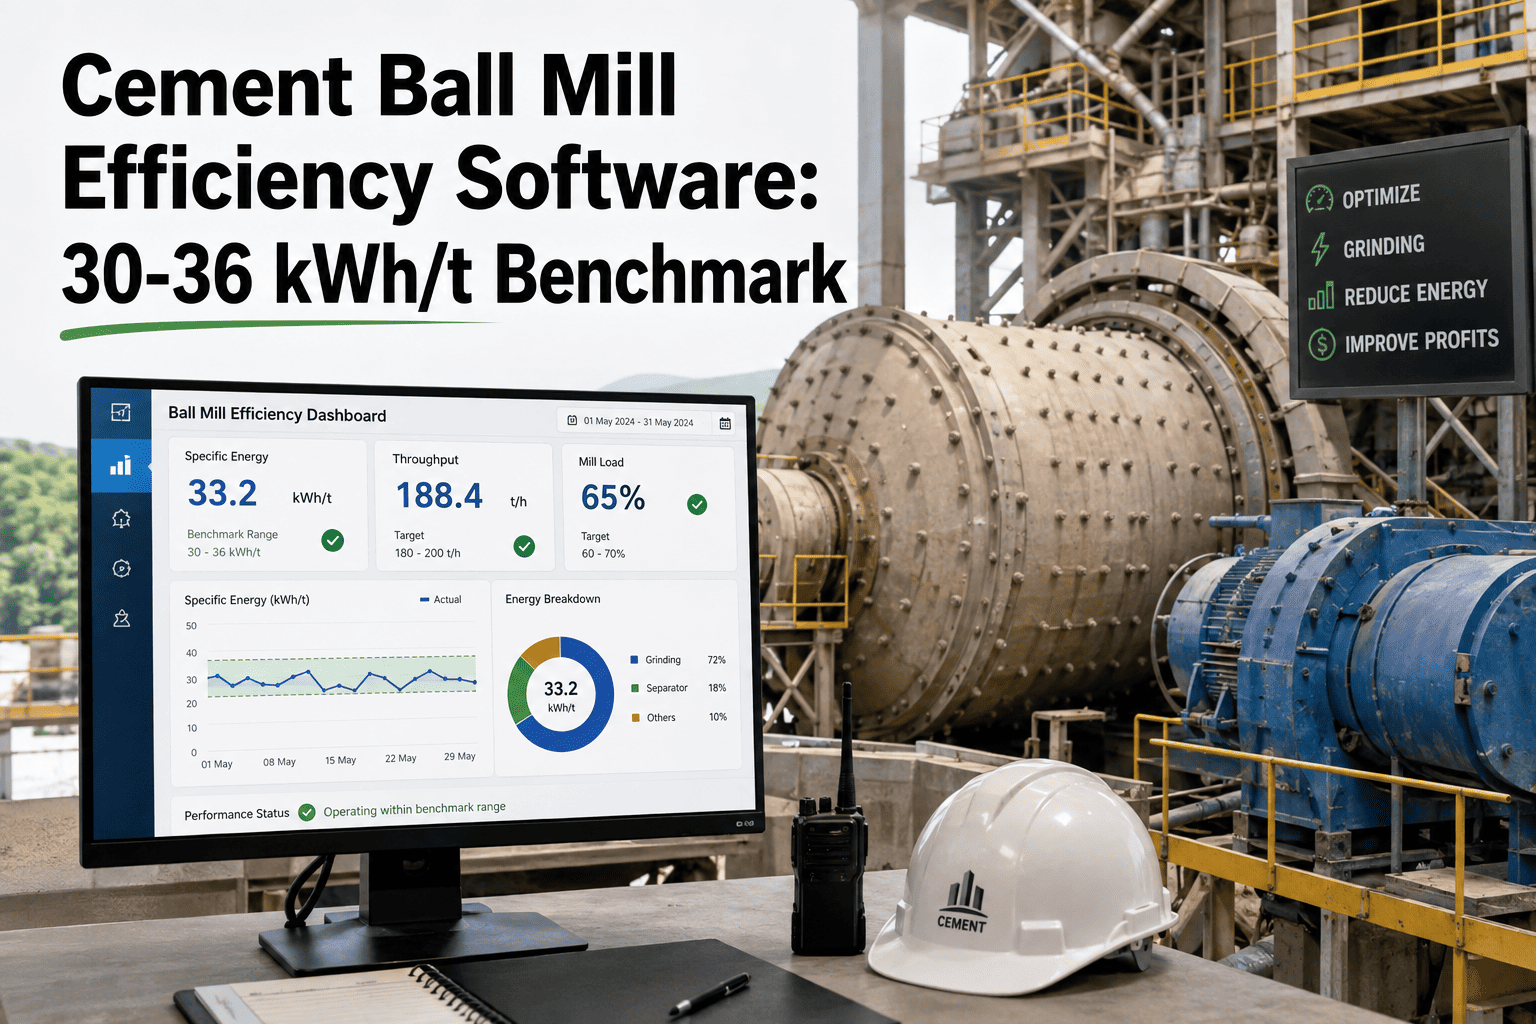
Cement grinding is the single largest electricity cost inside a plant, and the vertical roller mill was built to attack that cost directly. A ball mill finishing circuit typically runs 30 to 36 kWh per tonne, while a VRM handling the same clinker and fineness target should settle into a 20 to 26 kWh/t band — yet most plants running VRMs never see that number on a shift report. The gap between design SEC and actual SEC almost never comes from the machine itself; it comes from table roller pressure drifting off target, grinding bed depth swinging with feed moisture, and classifier speed left uncorrected as product specification changes. Reliability and process teams who close that gap do it with continuous data, not a quarterly energy audit — which is where a CMMS built around live VRM parameters, like Oxmaint, changes the outcome.
VRM Efficiency · CMMS-Driven
Cement VRM Efficiency Software
Vibration trips, drifting classifier speed and a grinding bed that never quite locks in are the reasons your vertical roller mill sits at 32 kWh/t when the same OEM design should run in the 20–26 kWh/t band. Oxmaint turns table roller pressure, bed depth and separator speed into tracked parameters that trigger maintenance action before specific energy consumption creeps upward and before the vibration alarm forces an unplanned stop.
20–26 kWh/t
Achievable SEC band for a well-tuned VRM finish circuit, against 30–36 kWh/t for a ball mill at equal fineness
45%
Share of VRM vibration trips traced back to material bed instability from insufficient grinding bed depth
$18K–$32K
Cost per hour of unplanned VRM stoppage once a vibration trip forces an emergency shutdown
2–4 kWh/t
Typical recoverable savings once roller pressure, dam ring height and nozzle ring velocity are corrected together
The Core Levers
Four Parameters That Decide Where Your VRM Actually Sits
A vertical roller mill does not drift toward higher SEC through one dramatic failure — it drifts through four ordinary parameters slowly moving out of their control band. None of them show up on a monthly energy report until the kWh/t number has already climbed. Reliability teams who hold SEC near the 20–26 kWh/t benchmark are the ones tracking these four levers shift by shift, not quarter by quarter, and treating a parameter that has drifted outside its band as a maintenance event rather than something to note and revisit later.
01
Table Roller Pressure
Grinding pressure is the force each roller applies to the bed, and it is the most direct lever on both fineness and energy. Running pressure higher than the target Blaine or residue actually requires wastes 1.0 to 1.8 kWh/t — roughly 4 to 7 percent of total VRM specific consumption — without producing a finer product. Oxmaint logs hydraulic pressure against Blaine and residue results shift by shift, flagging the moment pressure and product quality decouple so operators can trim back to the minimum that still holds specification.
02
Grinding Bed Depth
A stable material bed separates a quiet, efficient VRM from one that trips on vibration. Bed depth that runs too thin lets the rollers make direct metal-to-metal contact with the table, and that single mechanism accounts for close to 45 percent of all VRM vibration trips. Bed depth that runs too thick collapses the pressure differential the rollers depend on. Feed rate swings, moisture variation and changing raw mix grindability are the usual triggers, and Oxmaint correlates feed data with differential pressure trends to catch bed instability before the vibration alarm does.
03
Classifier and Separator Speed
Classifier speed sets how sharply coarse and fine particles are separated, and a mismatch between rotor speed and the current fineness target is one of the most common — and most invisible — sources of wasted grinding energy. Run the separator too slow for the required Blaine and oversize material escapes to product; run it too fast and already-fine particles are needlessly reground and returned to the mill, inflating recirculating load and kWh per tonne. Oxmaint tracks rotor speed against Blaine or residue results automatically so classifier drift shows up as a maintenance flag, not a quality complaint weeks later.
04
Dam Ring and Nozzle Ring Setting
The dam ring holds material on the grinding table long enough for the rollers to work it, and typical design heights sit between 45 and 75 millimetres depending on mill size and product. Nozzle ring airflow fluidises that bed and carries fines up to the separator — too little airflow and material settles instead of lifting; too much and partially ground particles are dragged out prematurely. Combined correction of dam ring height, nozzle ring velocity and roller wear is where the larger energy wins live, typically worth 2 to 4 kWh/t once tuned together rather than adjusted one variable at a time.
See Your Own SEC Gap
Turn Table Pressure, Bed Depth and Classifier Speed Into Tracked Parameters
Most plants find their SEC gap the moment live VRM parameters sit next to Blaine, residue and vibration data in one workspace instead of four separate screens. Oxmaint maps your existing sensor tags to a live control-band dashboard during onboarding — no new instrumentation required in most cases.
Technology Comparison
VRM vs Ball Mill: Where the Energy Gap Actually Comes From
Grinding technology sets the energy floor before a single parameter gets tuned. The table below lines up what a well-run VRM should deliver against a comparable ball mill finish circuit — the gap is the reason most greenfield cement lines default to vertical roller technology despite the higher upfront capital cost.
| Metric | Ball Mill | Vertical Roller Mill | Typical Gap |
|---|
| Finish grinding SEC | 30–36 kWh/t (up to 42 on worn circuits) | 20–26 kWh/t | 20–38% lower |
| Raw material grinding SEC | 25–35 kWh/t | 15–25 kWh/t | Roughly 30% lower |
| Drying and milling | Requires a separate drying stage | Integrated in a single pass | Simplifies the circuit |
| Relative capital cost | Baseline | 1.3–1.5x baseline | Higher upfront, lower opex |
| Maintenance profile | Simpler — ball charge and liner wear | Hydraulic system, roller and table wear | More sensors, higher CMMS payback |
The mill design sets the ceiling on efficiency; separator tuning, classifier speed and grinding bed control decide how close a plant actually operates to it. Two VRMs grinding the same clinker to the same Blaine can post SEC figures 30 percent apart, and the difference is almost never the equipment — it is whether the four core levers are being tracked continuously or checked once a quarter. Plants that recently converted a ball mill circuit to VRM technology often assume the energy problem is solved by the upgrade alone, then find their new mill running closer to 28 or 30 kWh/t because commissioning parameters were never revisited once production ramped up. A CMMS that keeps the original commissioning bands next to live readings makes that drift visible from month one instead of year three.
Failure Analysis
What Actually Causes a VRM Vibration Trip
VRM vibration trips are not random — four mechanisms account for essentially all of them, and three of the four are directly visible in maintenance data long before the trip alarm fires.
Material bed instability45%
Hydraulic accumulator pressure loss30%
Differential roller wear15%
Gearbox or bearing defects10%
Bed instability and hydraulic pressure loss together explain three out of every four vibration trips, and both are parameters a CMMS can trend continuously rather than check on a fixed inspection interval. Oxmaint logs accumulator pre-charge pressure against its own decay curve and flags the reading days before it reaches the threshold that causes roller bounce, and it correlates feed rate swings with bed differential pressure so an unstable bed is caught while it is still a trend, not yet an alarm.
CMMS Integration
How a VRM Signal Becomes an Oxmaint Work Order
When a VRM parameter drifts outside its band, the value of catching it depends entirely on what happens next. Oxmaint's maintenance planning layer turns a sensor drift into a scoped work order automatically, with the trend data attached, so the reliability team is acting on a documented signal instead of a hallway conversation.
| VRM Signal | Parameter Monitored | CMMS Action Triggered | Lead Time |
|---|
| Pressure trending below accumulator pre-charge band | Roller hydraulic cylinder pressure | Inspection work order, nitrogen top-up scheduled | 5–9 days |
| Bed depth fluctuation beyond control band | Differential pressure across grinding bed | Feed rate and nozzle ring inspection work order | 2–5 days |
| Classifier speed and Blaine result mismatch | Separator rotor speed vs lab fineness | Classifier calibration work order with trend report | 3–7 days |
| Roller or table liner wear trending toward minimum | Liner thickness measurement | Scheduled liner replacement PM, parts reserved | 14–21 days |
| Vibration RMS approaching trip threshold | Mill body vibration amplitude | Emergency inspection work order, shutdown flag | Immediate |
From The Field
What Process and Reliability Teams Say About Tracking VRM Parameters
We spent two years chasing SEC with quarterly energy audits and never moved the number in a meaningful way. The change came when we started trending table pressure against Blaine every shift instead of every quarter — the mill was telling us exactly when it was over-pressured, we just were not listening in real time. Within four months our finish circuit settled into the low twenties on kWh per tonne and stayed there.
Our VRM was tripping on vibration roughly four times a month before we linked accumulator pressure to a maintenance schedule. That dropped to under one trip a month within a quarter, and the mill has not needed an emergency roller liner replacement since.
Book a demo and ask specifically about accumulator pre-charge tracking — it was the single highest-value parameter for our circuit.
Close The SEC Gap
Get Table Pressure, Bed Depth and Vibration Trends in One Workspace
Plants that track the four core VRM levers continuously see SEC move within weeks, not quarters. Oxmaint connects to your existing SCADA, PI historian or PLC tags — no new control hardware needed in most implementations.
Performance Benchmarks
Cement VRM Efficiency — Before vs After CMMS Tracking
These figures reflect the typical shift plants report in the first two to three quarters after moving from periodic energy audits and paper logbooks to continuous, CMMS-tracked VRM parameters, with the SEC and vibration-trip improvements usually visible well before the liner-life and PM-compliance gains fully mature.
| Metric | Without CMMS Tracking | With Oxmaint VRM CMMS | Change |
|---|
| Specific energy consumption | 30–34 kWh/t | 21–24 kWh/t | -30% average |
| Vibration trips per month | 3.8 average | 0.9 average | -76% |
| Unplanned stoppage hours per month | 22 hours | 5 hours | -77% |
| Roller and table liner service life | Baseline | +35% longer | +35% |
| PM compliance rate | 54% | 91% | +37 pts |
| Emergency spare parts spend | Baseline | -46% vs baseline | -46% |
Common Questions
What Process Teams Ask Before Tracking VRM SEC in a CMMS
What SEC number should our VRM actually be hitting?
A finish-grinding VRM handling ordinary portland cement to standard Blaine should land in the 20–26 kWh/t range; the same circuit grinding raw material typically runs 15–25 kWh/t. If your mill sits meaningfully above that band, the gap is almost always in pressure, bed depth or classifier tuning rather than the machine design itself.
Why does our VRM run above benchmark even though the OEM design specification is lower?
Design SEC assumes a stable bed, a correctly set dam ring and nozzle ring, and a classifier matched to current product fineness. Any one of those drifting — most often bed depth or over-pressured rollers — pushes real-world consumption well above the commissioning report number. A gap audit against your own trend data is the fastest way to find which lever moved.
How does Oxmaint turn a sensor drift into a maintenance action automatically?
Live parameters — hydraulic pressure, bed differential pressure, separator speed, vibration amplitude — feed into Oxmaint against defined control bands. When a reading drifts outside its band, Oxmaint opens a scoped work order with the trend chart attached.
Sign up free to see your own parameter bands mapped in a live workspace.
Can we connect live VRM parameters without replacing our SCADA or PLC?
Yes — Oxmaint reads existing OPC-UA, PI historian or direct SCADA tags rather than requiring new control hardware. Your existing pressure transmitters, vibration sensors and separator speed feedback become the data source for the CMMS layer.
How long before we see the SEC number actually move?
Plants with 12 or more months of historical trend data typically see calibrated control bands and their first flagged work orders within 4 to 6 weeks of go-live. Plants starting from limited history run an observation window of 60 to 90 days first.
Book a demo to review your own data foundation.
Start Tracking Your VRM Today
Bring Table Pressure, Bed Depth and Classifier Speed Into One CMMS
Reliability and process teams at leading cement groups use Oxmaint to close the gap between VRM design SEC and what the mill actually delivers shift after shift. Sensor drift becomes a work order. Trend data trains better maintenance decisions. Plant leadership finally gets a real kWh/t number they can trust.