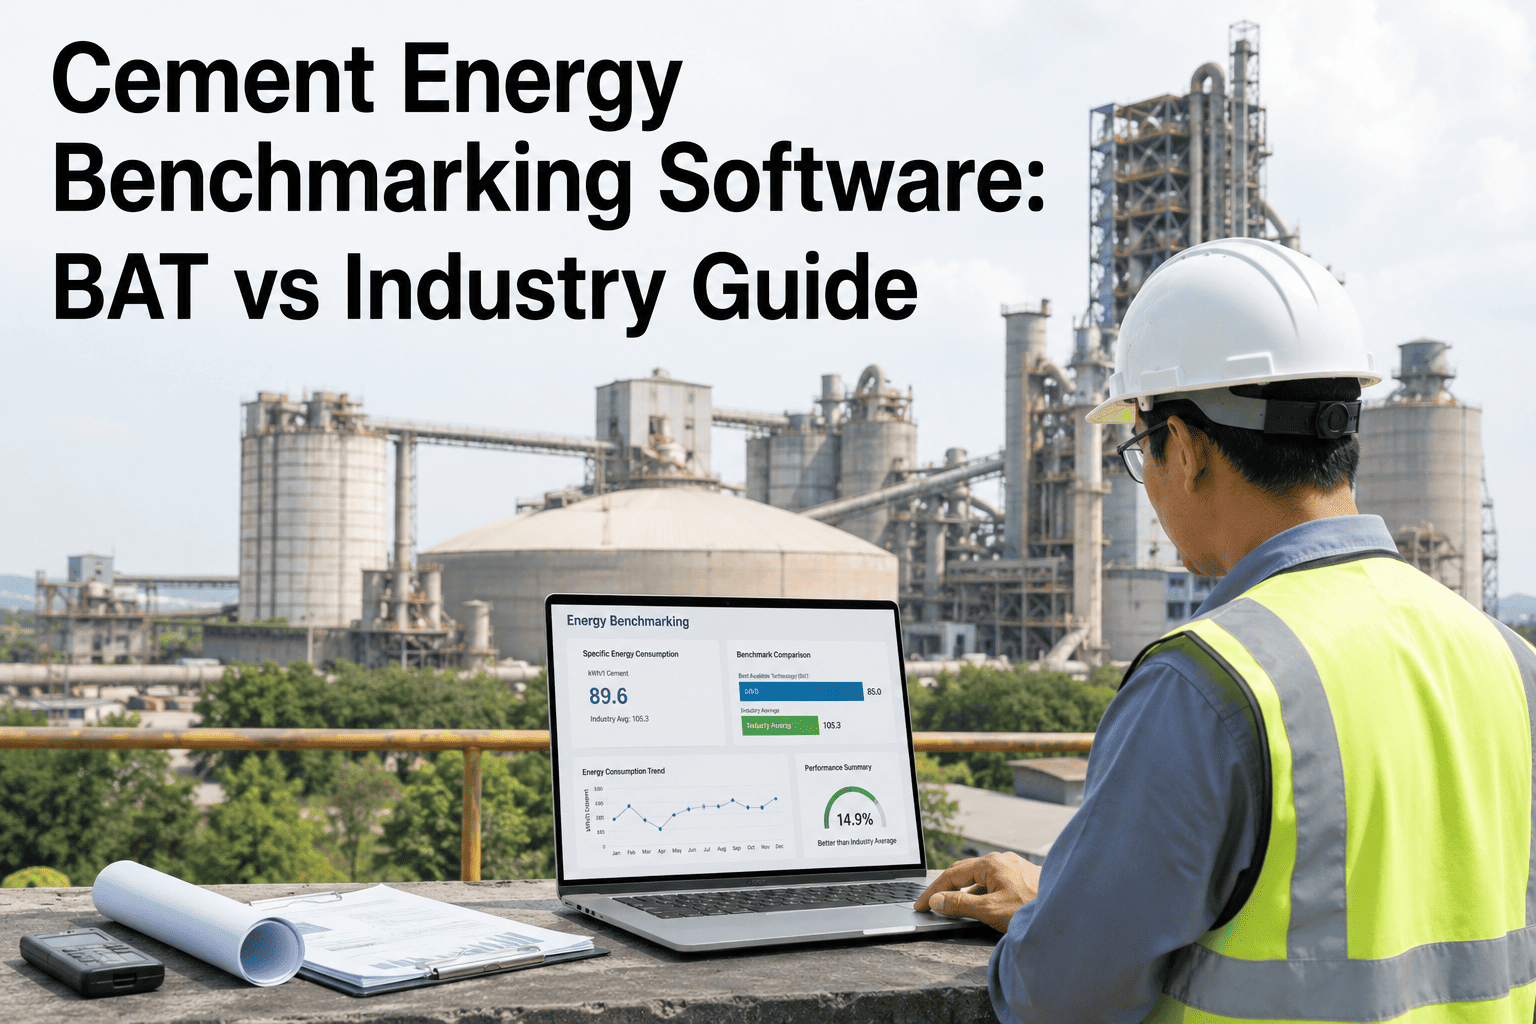
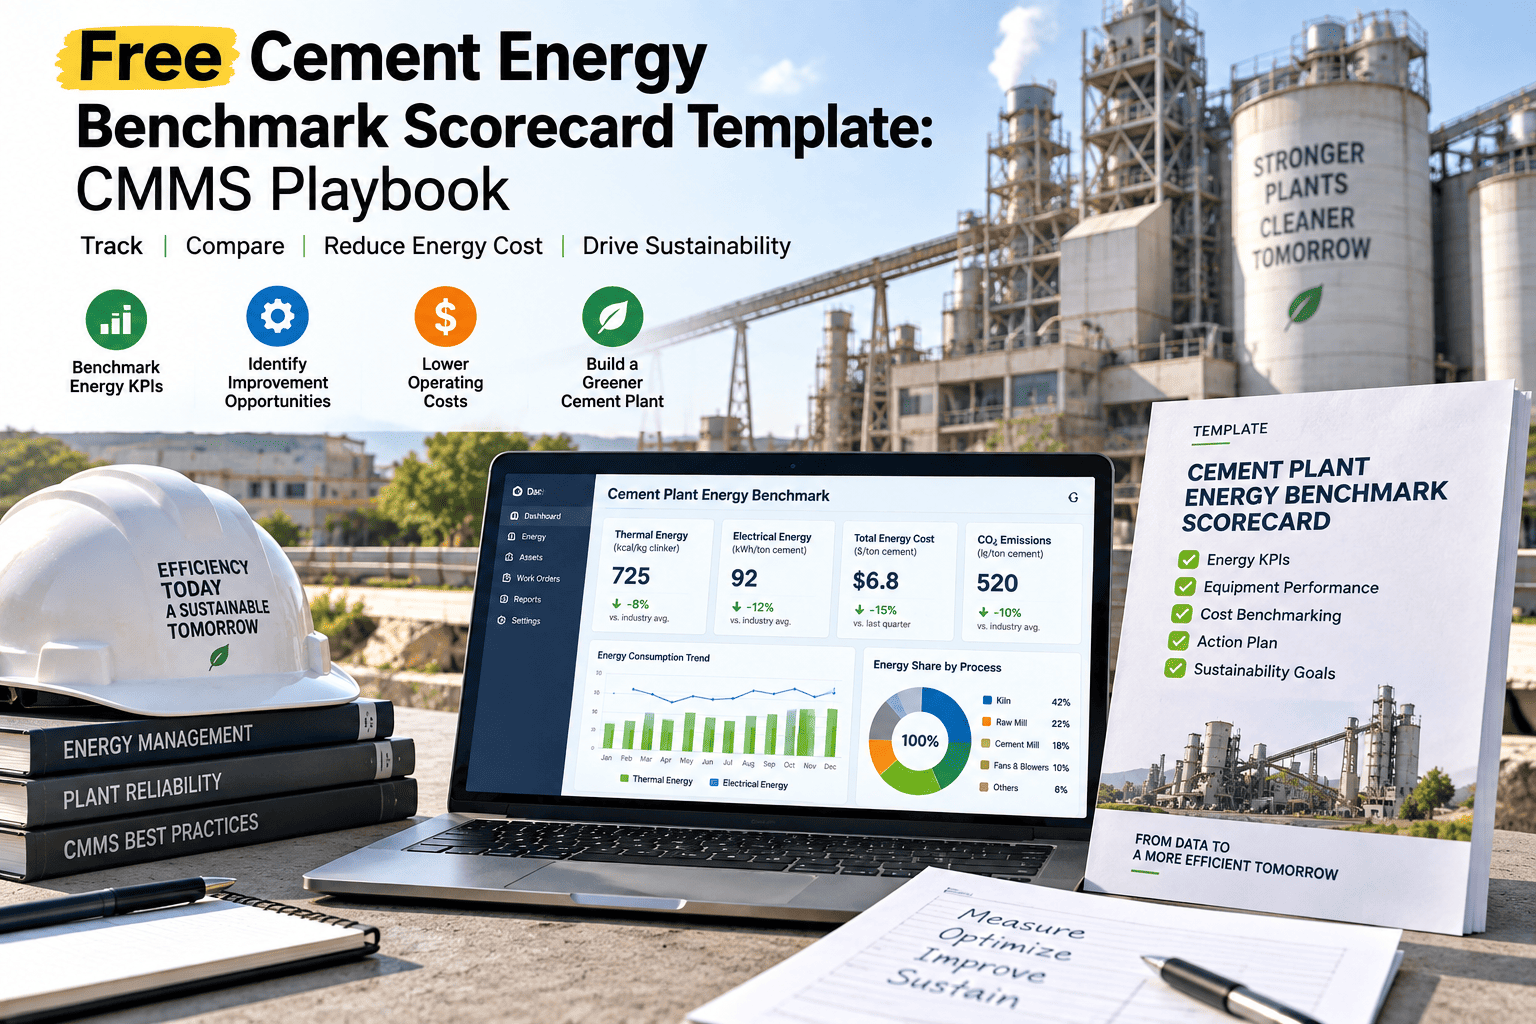
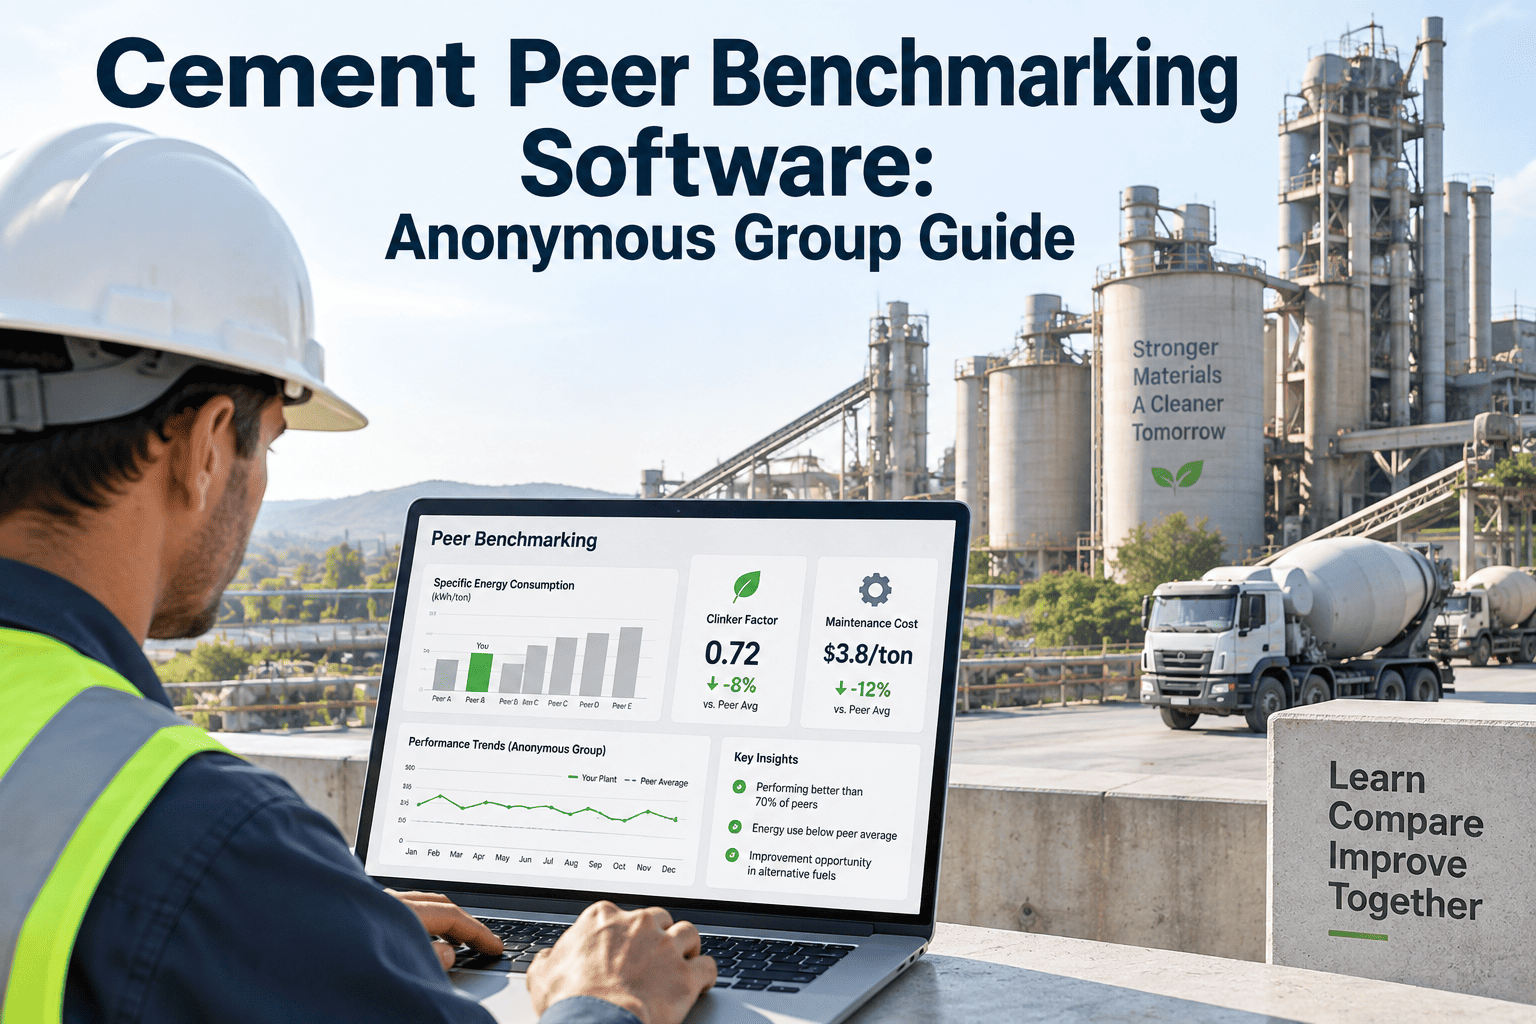
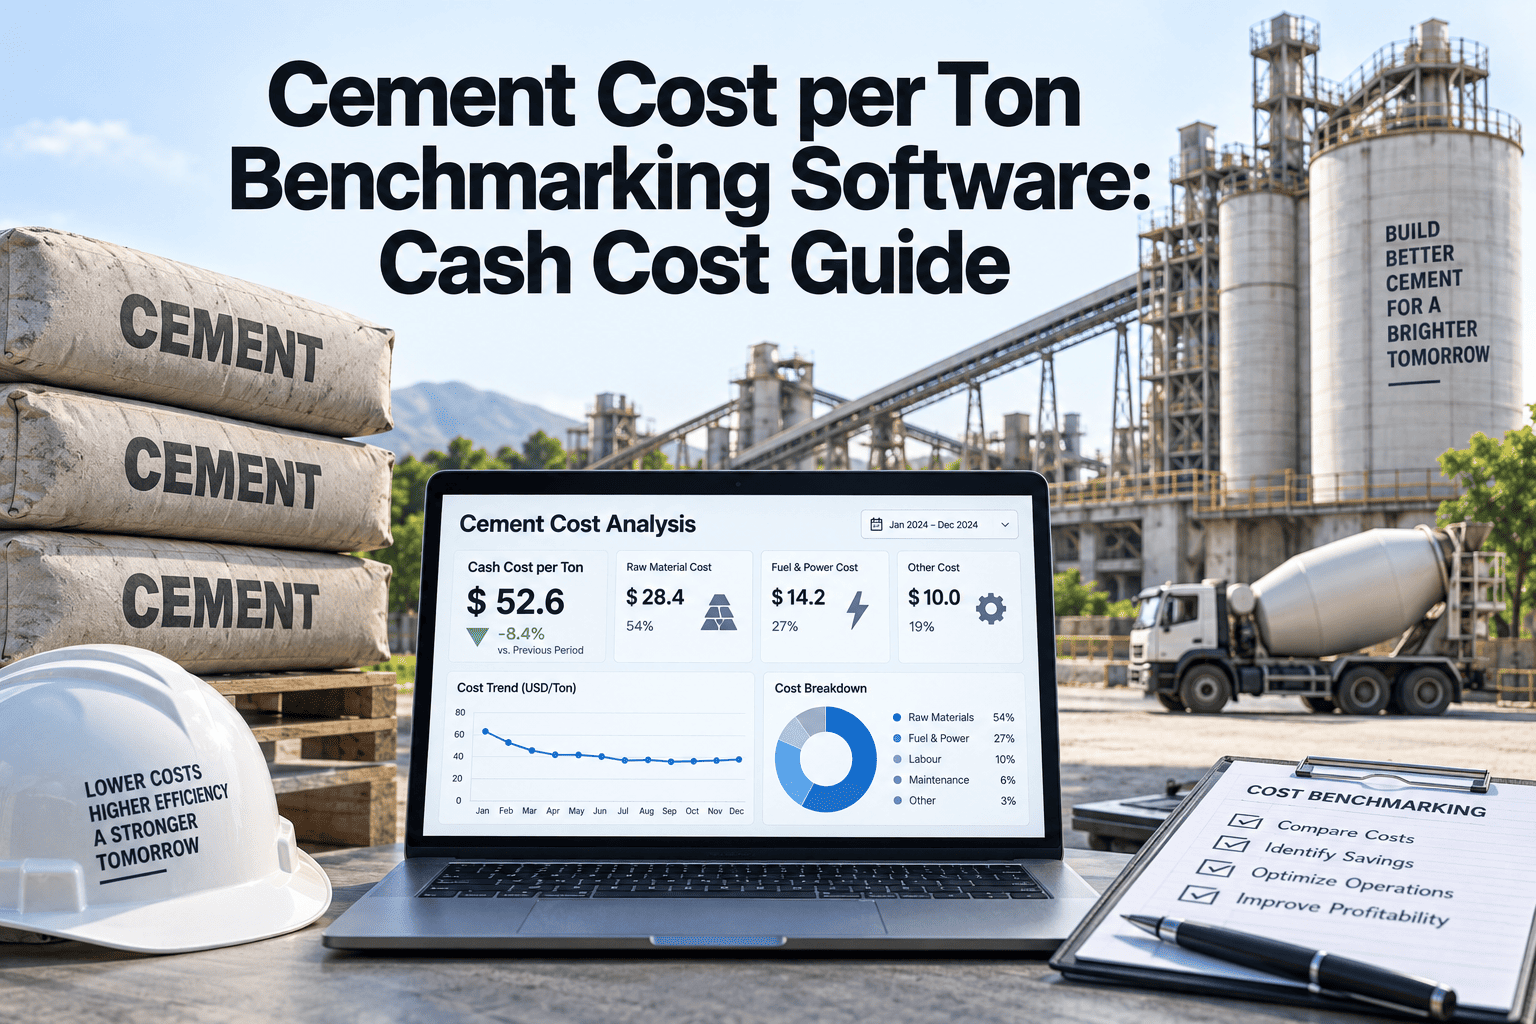
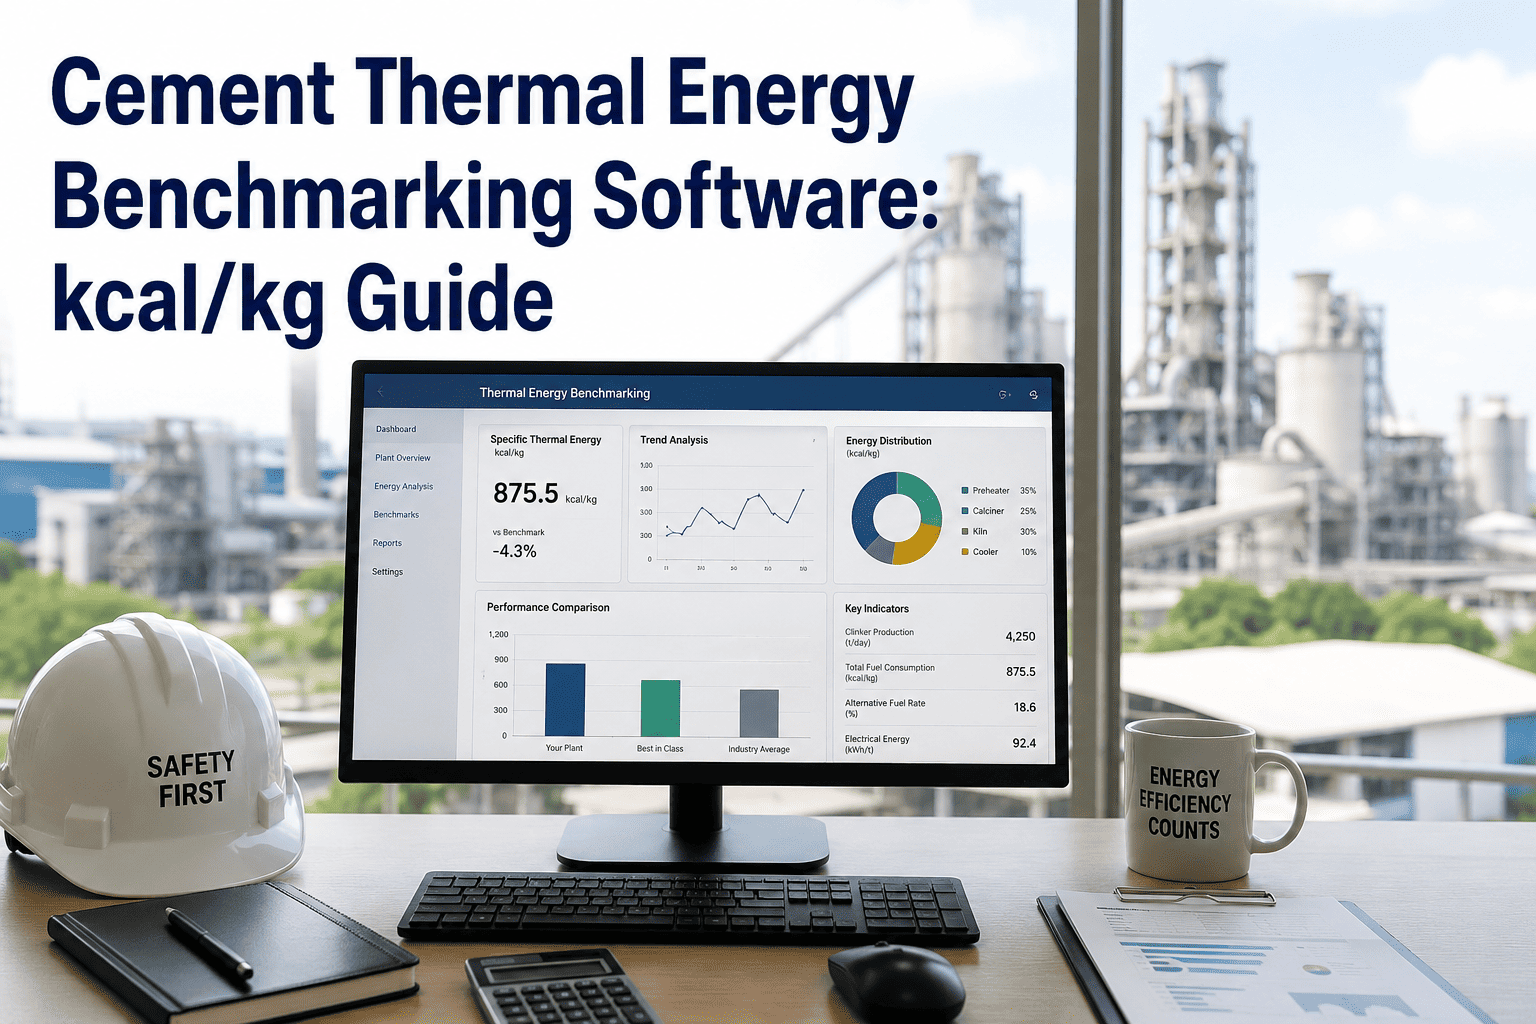
Every cement plant energy report eventually gets compared against two reference points: Best Available Techniques figures published by regulators and industry bodies, and the average performance of comparable kiln lines across the sector. The problem is not knowing these numbers exist — it is that most plants only check where they stand once a year, during an energy audit, by which point a grinding circuit or kiln section may have drifted well past its own baseline without anyone noticing. BAT figures for cement typically sit meaningfully below what most operating plants actually achieve, and that gap is where the real savings live. This guide breaks down where BAT, industry average, and typical plant performance actually diverge across raw grinding, clinker burning, and cement grinding, and why continuous, CMMS-linked benchmarking catches drift in days instead of the twelve months an annual audit takes, a gap teams can close with Oxmaint's energy benchmarking tools built into its CMMS platform.
Guide · Cement Energy Benchmarking
BAT vs Industry Average vs Your Plant: Where Is The Real Gap?
Most cement plants benchmark energy once a year and call it done. This guide shows where BAT, industry average, and typical plant performance actually diverge across the raw mill, kiln, and cement mill, and how continuous CMMS-linked benchmarking closes that gap instead of just measuring it.
The Benchmarking Gap In Numbers
15-20%
Typical gap between BAT thermal energy figures and average plant performance on clinker burning
12 mo
How long most plants wait between formal energy benchmarking reviews under an annual audit cycle
110-130
kWh per tonne of clinker typically consumed across grinding and kiln operations combined
Days
How quickly SEC drift shows up when sub-meter data feeds a CMMS instead of a spreadsheet
BAT vs Industry Average vs Typical Plant, By Process Area
These three reference points rarely get placed side by side, which is exactly why the gap goes unnoticed. Below is where each process area typically lands relative to Best Available Techniques.
Clinker Burning (Thermal)
Best Available Techniques
Industry Average
Typical Operating Plant
Why The Annual Audit Snapshot Misses The Drift
An annual energy audit is not wrong, it is just too slow for how quickly grinding and kiln performance actually moves. Four gaps show up consistently once benchmarking moves from a yearly event to a continuous process.
The Baseline Is Already Stale
By the time an annual audit report is finalized, the equipment condition it was based on is already months old. Bearing wear, refractory degradation, and feed variability have all moved the real SEC away from the reported figure.
Drift Hides Inside A Single Average
A yearly average can look acceptable even while one shift, one mill, or one kiln campaign is running well above BAT, because the good months quietly offset the bad ones in the final number.
No Link Back To The Asset That Caused It
Audit reports typically show plant-level or process-area figures, not the specific mill, fan, or bearing responsible, so the same drift often returns the following year with no root cause ever fixed.
Corrective Action Arrives Too Late To Matter
Even when an audit correctly identifies a gap, the recommended fix is scheduled into next year's budget cycle, meaning the plant absorbs another twelve months of avoidable consumption before anything changes.
The Metrics Continuous Benchmarking Actually Tracks
SEC By Asset, Not Just By Plant
Sub-meter data tied to the raw mill, cement mill, and kiln auxiliaries separately, so a drift in one circuit cannot hide inside a plant-wide average.
Thermal Energy Per Tonne Of Clinker
Kiln fuel consumption tracked against production output daily, catching combustion or refractory issues while they are still cheap to correct.
EnPI Trend Against Baseline
Energy Performance Indicators plotted against the original baseline rather than reported as a single point-in-time number, which is what ISO 50001 auditors actually want to see.
Deviation Alerts, Not Monthly Reports
Threshold-based alerts that flag an asset the moment it crosses its expected SEC range, instead of waiting for someone to notice it in a spreadsheet.
Benchmarking against BAT only matters if the gap gets closed, not just reported. Oxmaint connects sub-meter data, PM records, and asset-level SEC tracking inside one CMMS, so your team sees drift the same week it starts instead of in next year's audit.
Moving From Snapshot To Continuous Benchmarking
1
Set An Asset-Level Baseline
Record current SEC for the raw mill, cement mill, and kiln separately, rather than relying on a single blended plant figure from the last audit.
2
Install Sub-Metering On Major Loads
Wire utility meters on the highest-consumption assets first so real consumption data starts flowing before the full rollout is complete.
3
Link Meters To The CMMS
Feed sub-meter readings into the same system that already runs preventive maintenance, so an SEC alert can trigger a work order without manual handoff.
4
Review Weekly Against BAT
Replace the annual audit meeting with a short weekly review of asset-level SEC against BAT and the internal baseline, closing gaps while they are still small.
Frequently Asked Questions
What does BAT mean in a cement energy context?
Best Available Techniques figures represent the energy performance achievable using current proven technology and operating practice, and are used as the reference ceiling that industry average and individual plant performance are measured against.
Why is industry average not a good enough target on its own?
Industry average already includes plants running well above BAT, so matching it still leaves real savings on the table. Treating BAT as the target, with industry average only as context, produces a more accurate improvement plan.
How does a CMMS actually help with energy benchmarking?
A CMMS already holds asset history and maintenance schedules, so linking sub-meter data to the same assets lets SEC alerts trigger maintenance work orders directly.
Oxmaint's platform is built around this exact connection.
How often should SEC actually be reviewed once sub-metering is in place?
Weekly is enough to catch drift before it compounds into a full billing cycle, though high-criticality assets like the kiln and cement mill often benefit from daily review during the first few months.
Does continuous benchmarking replace the annual ISO 50001 audit?
No, but it makes that audit far easier to pass, since the EnPI trend and corrective action history are already documented rather than assembled right before the certification visit.
Book a demo to see the reporting view.
Stop Waiting For Next Year's Audit To Find The Gap
Oxmaint gives cement plant energy and maintenance teams asset-level SEC tracking, sub-meter integration, and BAT-referenced benchmarking inside the same CMMS that already runs preventive maintenance. Start free today and see where your plant actually stands against BAT.