Cement plant P&Ls rarely collapse in a single bad month — they erode for two or three quarters first, one uncounted overtime shift and one unplanned gearbox repair at a time, while the monthly cost report still shows a number that looks defensible. Most plants still calculate cash cost per ton once a month, in a spreadsheet, well after the coal has been burned and the crew has gone home. By the time energy, maintenance, labor, and logistics costs are reconciled into one figure, the quarter that mattered is already closed, and whatever caused the overrun has usually already repeated itself at least once. Plants that consistently hold cash cost below the regional benchmark are the ones tracking cost per ton continuously against live maintenance and production data, not reconstructing it from invoices thirty days later. Start benchmarking cash cost per ton against your plant's own history in Oxmaint free and see which cost line is quietly pulling your number up Start a free OxMaint trial or book a 30-minute demo
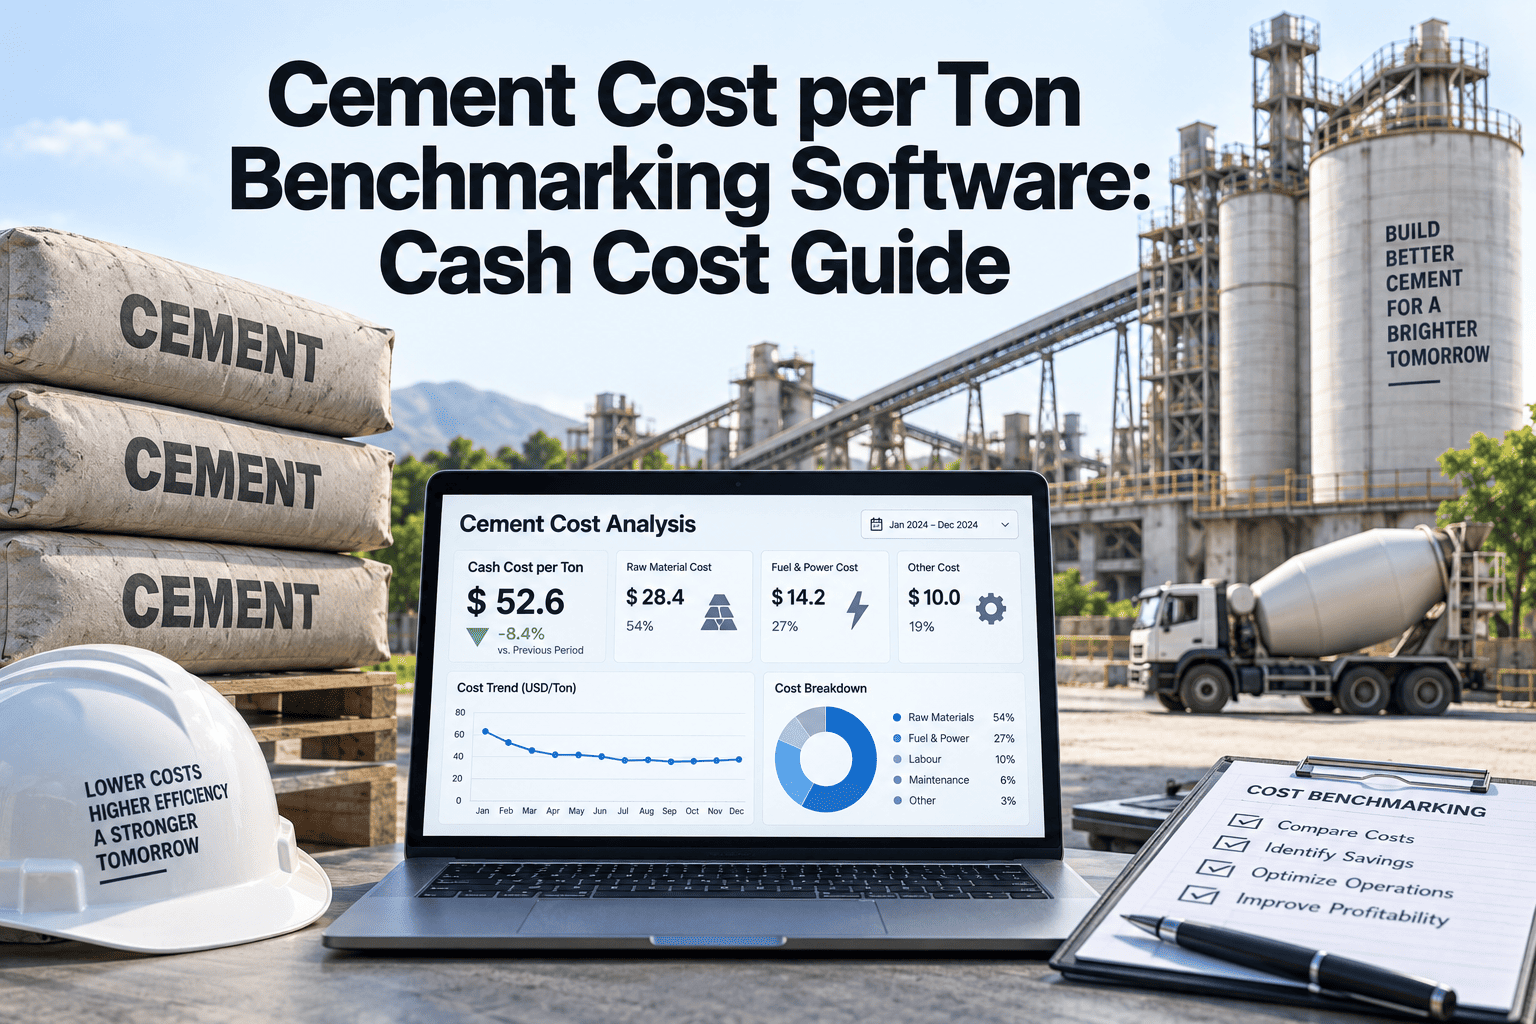
Cement Cost Per Ton Benchmarking Software: The Cash Cost Guide Plant GMs Defend to Holding CFOs
Turn energy, maintenance, labor, and logistics spend into one live cash-cost-per-ton number — benchmarked against your own plant history, updated daily instead of at month-end, and connected to the work orders that actually move it.
Why Cash Cost Per Ton Is the Number Every Plant Reports Late and Explains After the Fact
Cash cost per ton is the single figure a holding company CFO actually asks about, yet it is usually the hardest number in the plant to produce quickly. Energy cost lives in the power and fuel ledger. Maintenance cost lives in the CMMS or, worse, in paper work orders. Labor cost lives in payroll. Logistics and packaging cost live in dispatch records. Nobody owns the number until the accounts team stitches all four together, weeks after the production month has closed — which means the plant GM is always explaining a number that is already history, not managing one that is still moving. This is not a data problem so much as a plumbing problem: the raw numbers exist somewhere in the plant on the day they happen, but nothing routes them into one place fast enough to act on. The table below shows why traditional month-end costing consistently misses the window where cost leaks are still cheap to fix, and why a benchmark built on that lag can only ever explain the past instead of protecting the next quarter.
Where Every Dollar of Cement Cash Cost Actually Goes
Cash cost per ton is not one number — it is six lines stacked on top of each other, and the plants that control cost are the ones that can see the stack, not just the total. Across most dry-process plants, fuel and power together are consistently the largest share, maintenance and spares sit second when a reactive repair strategy is in place, and labor, raw materials, and logistics fill out the rest. Knowing the total tells a GM whether the month was good or bad; knowing the stack tells the GM which lever to pull first, and by how much, before the number is locked in for the quarter. The bar below reflects a typical cash cost stack for a mid-size integrated dry-process plant running on a mixed fuel supply.
Stop reconstructing cash cost per ton after the month closes — track it live in Oxmaint
Oxmaint ties every work order, spare part, and labor hour to the asset and the tons it produced, so maintenance and energy cost per ton update continuously instead of arriving thirty days late in a spreadsheet nobody has time to double-check.
Cash Cost Per Ton Benchmark by Plant Type and Cost Driver
A single global benchmark is close to useless — a captive-power plant in a low-cost coal region and a grid-dependent plant running mostly gas do not belong on the same line. The table below groups typical cash cost drivers by plant profile so a plant GM can identify which peer group actually applies before comparing numbers, rather than getting an unfair read from a benchmark built on a completely different power and fuel mix. Matching the right profile first is what turns a benchmark from a vanity metric into a number a CFO will actually accept.
| Plant Profile | Dominant Cost Driver | Energy Share of Cash Cost | Maintenance Share | Benchmark Signal |
|---|---|---|---|---|
| Captive power, coal-fired | Fuel procurement and kiln SEC | 32–38% | 13–16% | Watch fuel GCV variance |
| Grid-dependent, mixed fuel | Power tariff and peak demand | 38–45% | 12–15% | Watch tariff and load factor |
| High AFR, waste-fuel blend | Alternative fuel logistics | 25–32% | 14–18% | Watch AFR handling cost |
| Reactive maintenance strategy | Emergency repairs, overtime, and spares | 30–36% | 18–24% | Highest-risk cost profile |
| CMMS-driven planned maintenance | Fuel and power remain largest, maintenance held under control | 32–38% | 9–12% | Benchmark-leading profile |
Scroll horizontally on smaller screens to view all columns
The Minimum Data a Plant Needs Before It Can Trust Its Own Cash Cost Benchmark
A benchmark is only as trustworthy as the data feeding it, and most plants already generate the raw inputs — they just live in five different systems that never talk to each other. Before comparing cash cost per ton against a peer group or an industry target, a plant needs these six inputs flowing continuously rather than reconstructed at month-end from invoices, paper logs, and separate spreadsheets that nobody has time to fully reconcile.
From Cost Leakage to Cost Control: How the Loop Closes Inside a CMMS
Cash cost per ton only becomes manageable once every dollar is tagged to the asset, shift, and ton that generated it. Benchmarking software without a CMMS underneath it just produces a nicer chart of the same late number, because the source data is still trapped in disconnected logs and spreadsheets. The value only shows up once cost capture is built into the same system that already tracks the work order, the spare part, and the shift — so nothing needs to be re-entered or reconciled after the fact. Here is how Oxmaint ties cost capture directly to the work being done on the floor.
What Changes Once a Plant Benchmarks Cash Cost Per Ton Continuously
These are the outcomes plant teams typically report after moving cash cost per ton tracking out of a monthly spreadsheet and into a system that ties cost to assets and production in real time. None of them require a capital project or a new production line — they come from shrinking the gap between when a cost happens and when someone can see it clearly enough to act.
Frequently Asked Questions on Cement Cash Cost Per Ton Benchmarking
Put your plant's cash cost per ton on one live screen — before next month's board deck
Oxmaint ties energy, maintenance, labor, and logistics cost directly to the assets and tons that generate them, so your cash-cost-per-ton benchmark updates continuously instead of arriving after the month has already closed and the chance to correct it has already passed.