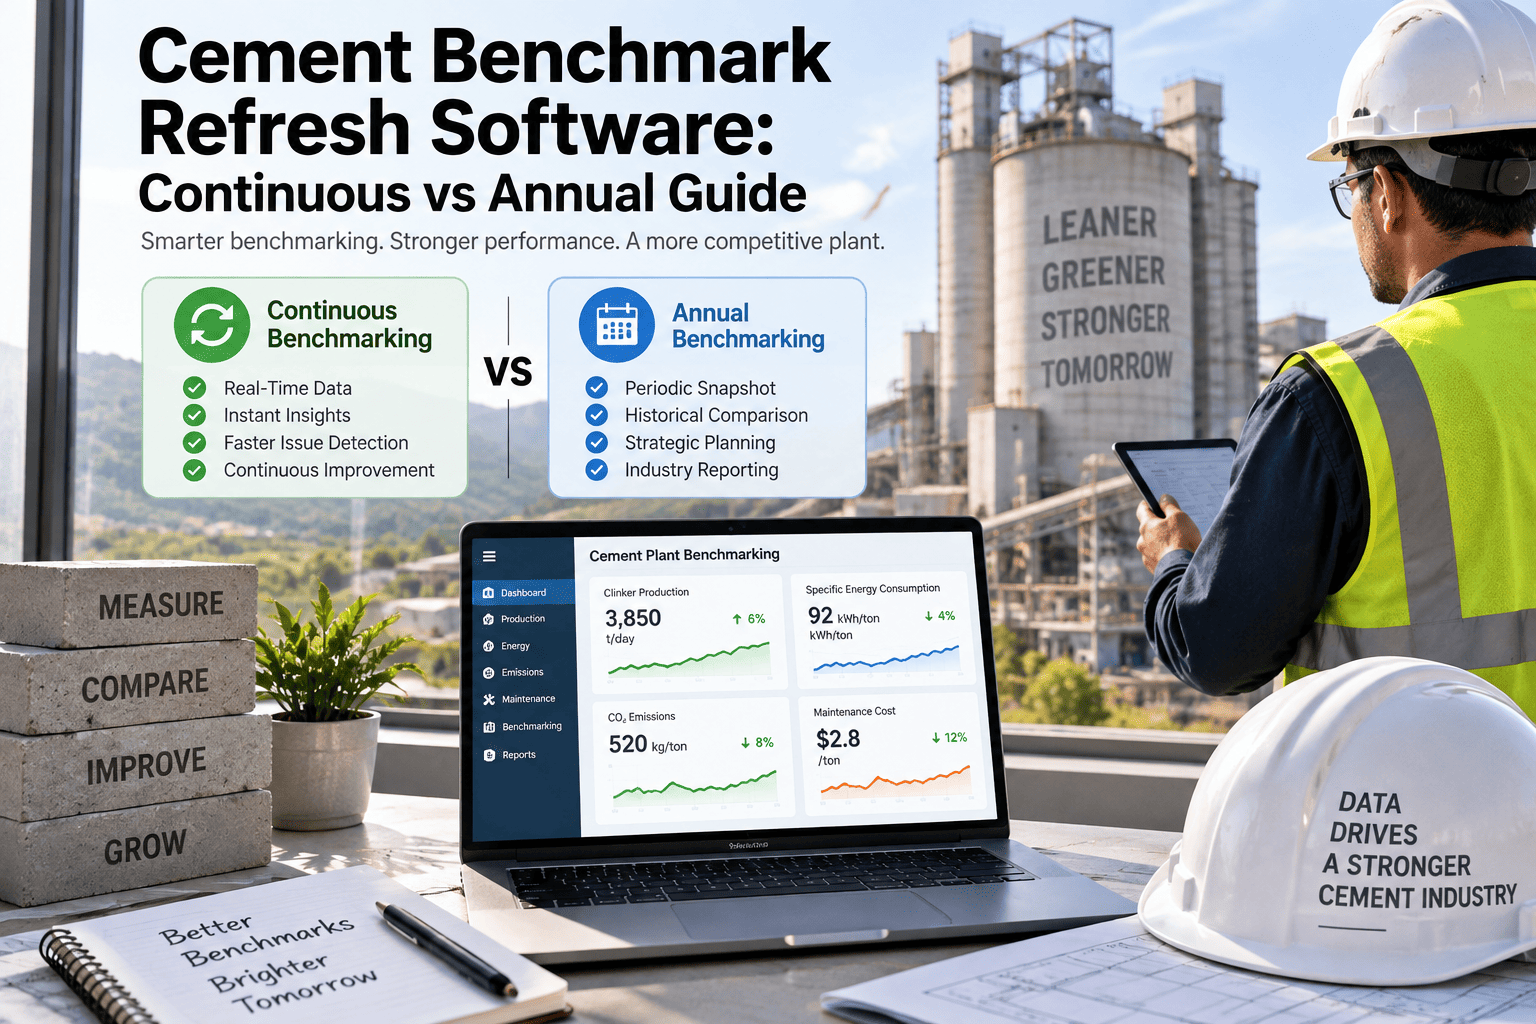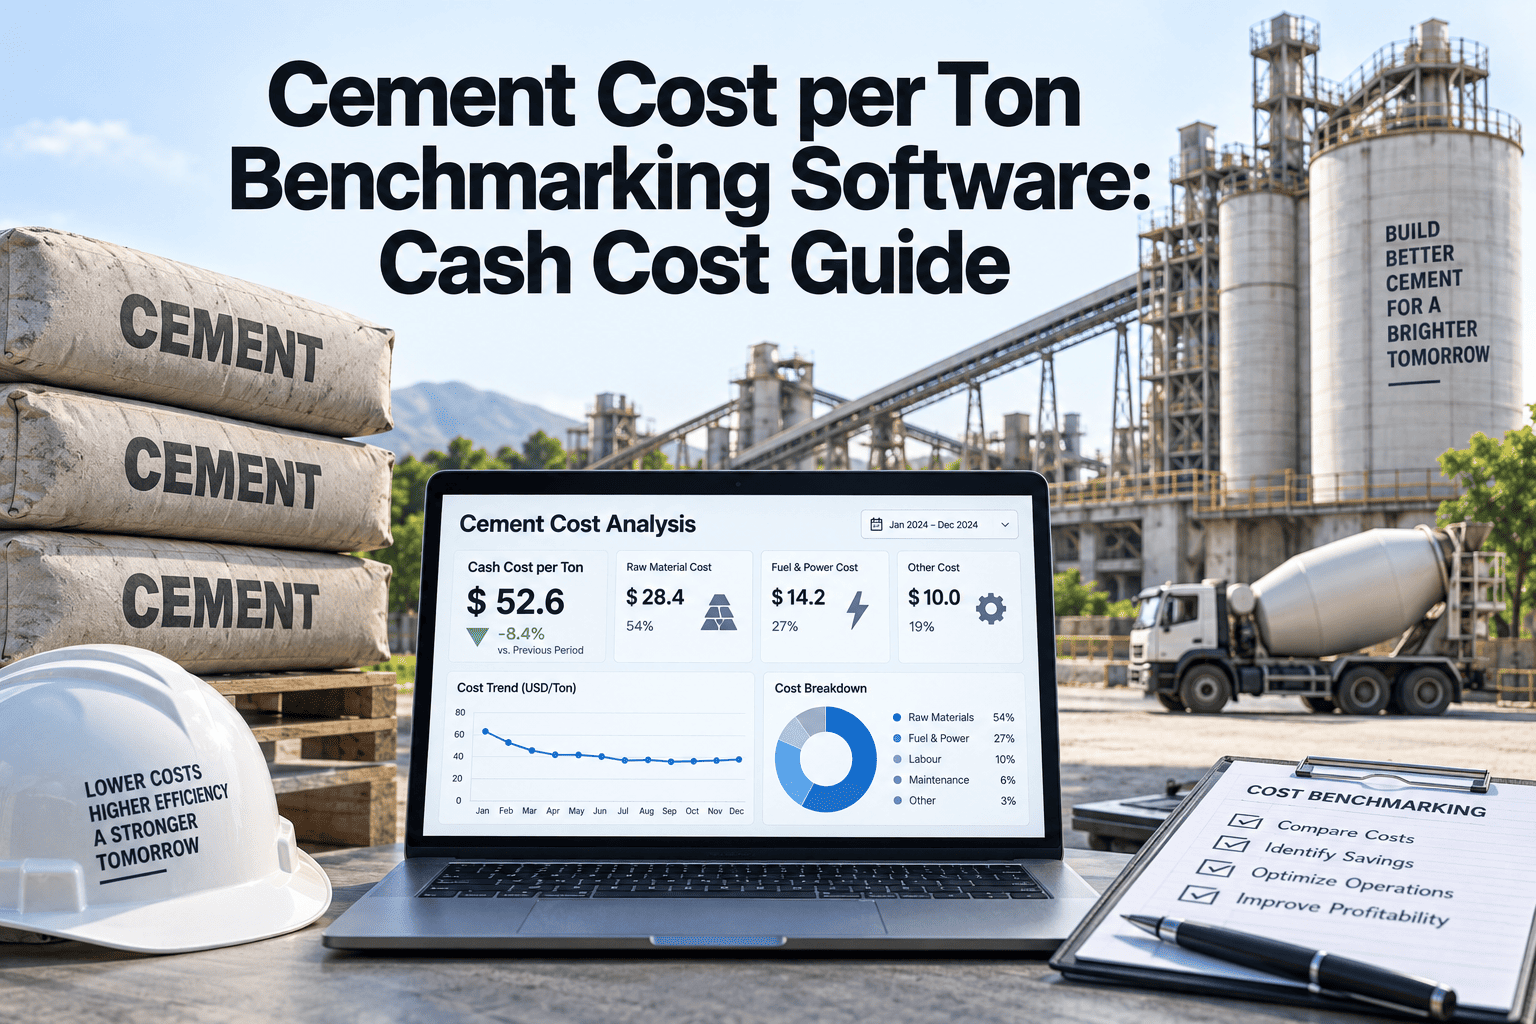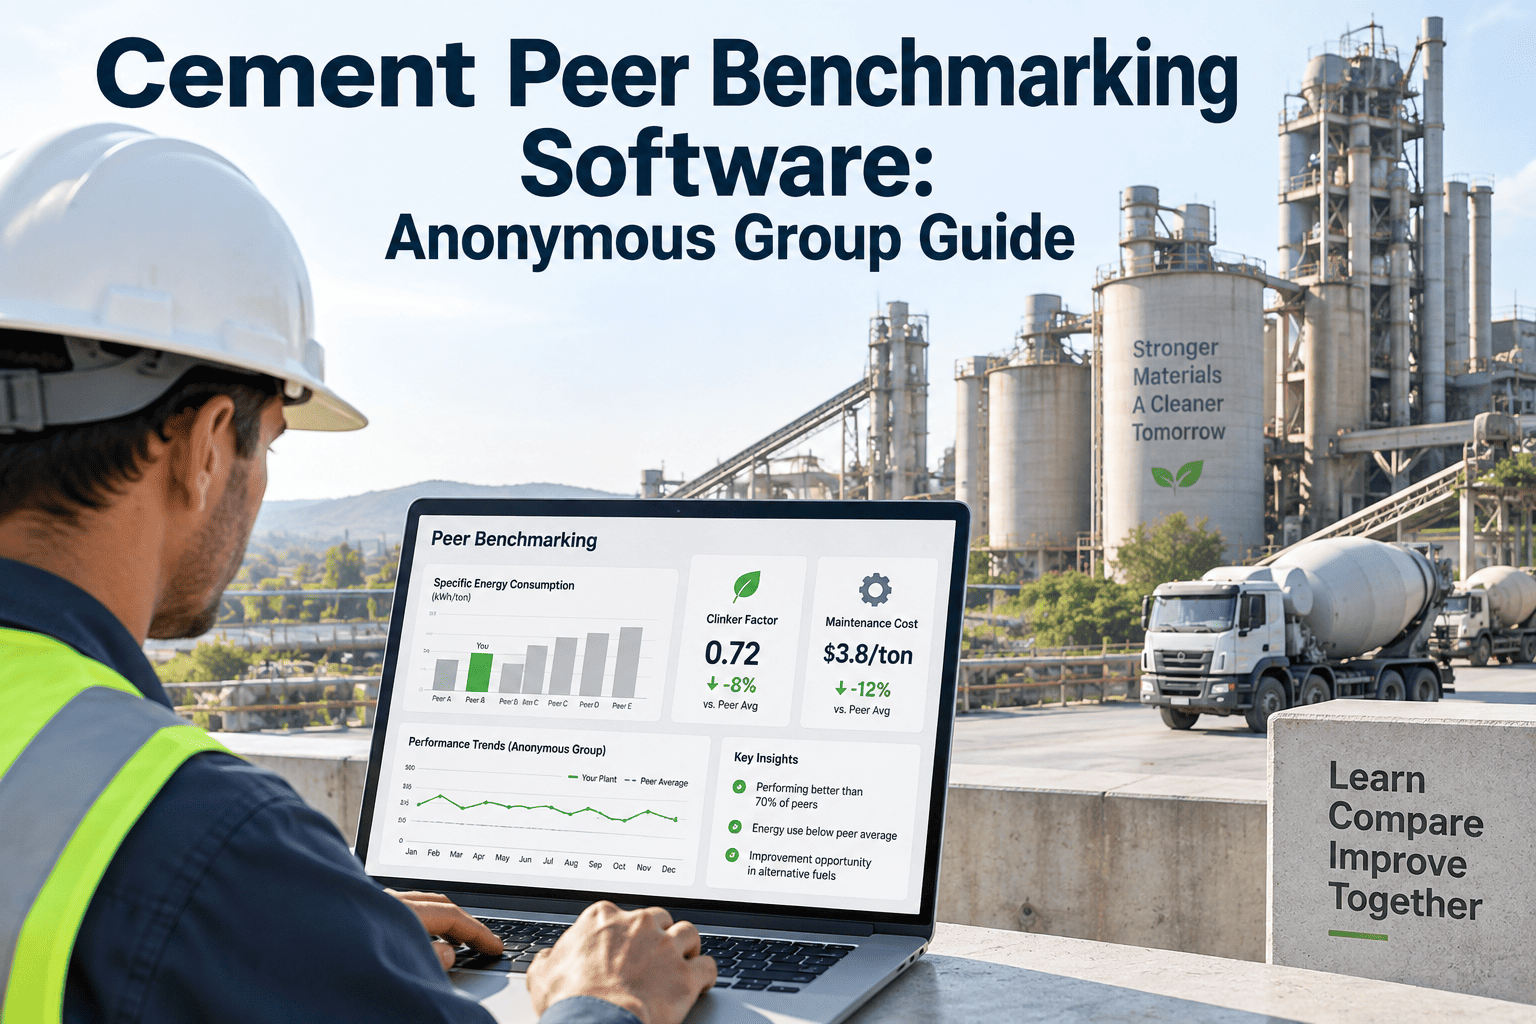
Every cement plant manager knows two things about benchmarking. The first is that a single peer-comparison number — how your kiln availability, specific heat consumption, or maintenance spend per tonne actually ranks against similar plants — is worth more than a hundred internal dashboards. The second is that no cement group in the world is willing to share raw plant numbers with a competitor down the road, even for the promise of that comparison. This is the paradox that has kept cement industry benchmarking stuck in slow annual reports, expensive consulting studies, and self-declared "world-class" claims that no one can verify. OxMaint's anonymous peer benchmarking module solves the paradox at the data layer — not the trust layer — using k-anonymous aggregation, percentile-only outputs, and hard participation caps. That is what makes the cement peer benchmarking software inside OxMaint work where paper studies fail.
Compare Your Plant Against Real Peers — Without Exposing a Single Number
Kiln availability, SHC, SPC, clinker factor, PM:CM ratio, MTBF — benchmarked against anonymous peer groups matched to your plant configuration, region, and AF profile. Rank in percentiles. Never in identifiers.
Why Cement Benchmarking Has Been Broken Until Now
Cement is one of the most benchmark-hungry industries in heavy manufacturing — the process is standardised enough that comparison is meaningful, and the margins are thin enough that a 2% SHC improvement matters. Yet the industry has relied for years on the same three flawed inputs: aging consulting reports priced at €40,000+ per plant, GCCA's excellent but 24-month-lagged GNR data, and self-declared "top quartile" claims from marketing brochures. Every cement CFO knows a real-time, verified, per-KPI percentile position for their plant would be worth more than all three combined.
The reason it did not exist is that the data engineering problem — collect real production numbers from dozens of plants, prove no one can reverse-engineer another plant's data, normalise across configurations, and deliver percentile insight in a fresh enough cadence to be useful — was not solved for cement specifically. Consulting firms lacked the automation. Industry associations were bound by disclosure rules. Individual CMMS vendors did not have enough participating plants to hit statistical significance. The unlock is a CMMS with a large enough cement customer base, purpose-built aggregation architecture, and a compliance-safe output layer built into the product from day one. That is precisely what OxMaint runs across its cement plant customer base — anonymous, k-safe, normalised, and refreshed monthly rather than annually.
The Trust Blueprint — 5 Guarantees Anonymous Cement Benchmarking Runs On
Nothing about anonymous benchmarking is magic. It is a stack of five specific data-engineering guarantees — the same stack used by compensation platforms serving 8,000+ enterprises, financial-services roundtables, and pharmaceutical R&D consortia. What OxMaint has done is port this stack into the cement operations context, applied to production, maintenance, and energy KPIs rather than salary bands. Every one of these guarantees is what makes a plant manager willing to feed real numbers into the system — and what keeps the group's data valuable rather than gamed. Book a demo to see the trust blueprint in a live account.
The 8 Cement KPIs Every Peer Group Benchmarks
Cement is unusual in that the set of KPIs worth benchmarking is small, standardised, and universally agreed upon. Every cement plant manager, every reliability engineer, every CFO tracking the sector uses roughly the same eight numbers. These are the metrics OxMaint's benchmarking module ships preconfigured — no consultant discovery workshop required — and the metrics that answer the questions cement leadership actually asks. Each carries an industry benchmark range from published sources; your plant's percentile position within your matched peer group is what fills the gap between "typical" and "us specifically."
| KPI | Unit | Published Benchmark | What Peer Rank Reveals |
|---|---|---|---|
| Kiln Availability | % | 88–93% (modern dry) | Reliability programme strength vs. peers |
| Specific Heat Consumption | kcal/kg clinker | 700–750 | Kiln thermal efficiency + AF discipline |
| Specific Power Consumption | kWh/t cement | 75–90 | Grinding + auxiliary efficiency |
| Clinker Factor | ratio | 0.71 global · 0.75 India · 0.78 US | SCM adoption and blended-cement mix |
| Thermal Substitution Rate | % | ~18% global · ~50% Europe | AF programme maturity and infrastructure |
| Refractory Campaign Length | days | 300–360 | Coating discipline + AF stability control |
| PM : CM Work Order Ratio | ratio | < 0.5 world-class | Maintenance strategy and PM coverage |
| Kiln OEE | % | 74–85% typical to world-class | Combined availability × performance × quality |
How OxMaint Builds Your Anonymous Peer Group
A benchmark is only useful when the plants you are compared against actually look like your plant. A wet-process kiln in a mature market is not a peer to a modern precalciner in an emerging market. A 100% coal-fired site is not a peer to a 45% TSR site. OxMaint's peer-group engine solves the comparator problem by matching your plant against four configuration dimensions before it ever shows you a percentile. If the matched pool falls below the 25-plant k-anonymity floor for a given KPI, the pool widens on the least-critical dimension until the floor is met. You always get a real peer group. You never see who is in it.
See a Live Peer-Group Match for Your Cement Plant
Walk through the k-anonymity floor, contribution cap, and 4-dimension configuration match against your own plant profile — no data commitment required for the demo run.
What Cement Leadership Actually Does With Peer Rank Data
A percentile is not a project. What matters is the decision loop the percentile drives — the capex prioritisation call, the PM programme investment, the AF ramp target, the M&A due-diligence question. Every cement group we have worked with runs the same three workflows on peer benchmark data: annual capital allocation, monthly plant performance reviews, and portfolio-level M&A screening. Corporate finance uses it to defend capital ratios to the board. Reliability leadership uses it to prove that the PM investment is paying back. Operations uses it to challenge complacent "target hit" reports at the shift level. OxMaint is used across all three levels because the underlying data lives in the same asset record as every work order, PM completion, and stability signal that produced it. The percentile always traces back to the operational cause — the CFO never has to trust a number without being able to pull its lineage in three clicks. That auditable connection between a benchmark rank and the actual maintenance history behind it is the difference between a benchmark that changes decisions and a benchmark that gets filed with the annual report.
For years we suspected our SHC was middling but had no way to prove it. The consulting benchmark cost $58,000 and was 14 months old by the time we saw it. OxMaint showed us we sit at the 41st percentile among 2,000–5,000 tpd dry precalciner plants at 30–60% TSR — updated monthly. That data alone rerouted our next $2.4M kiln burner project.
The strategic shift, once a group turns anonymous peer benchmarking on, is subtle but permanent. Plant directors stop debating whether internal targets were appropriately set and start debating whether the plant is closing the percentile gap to its matched peers. Corporate stops asking whether a plant "did well this quarter" and starts asking whether it moved up or down against comparable operations. Reliability leads stop reporting availability numbers in isolation and start reporting availability rank alongside the specific PM programme investments that moved it. The scoreboard becomes the shared operating vocabulary across shift, plant, and corporate levels — and because OxMaint keeps every ranked number tied to the underlying maintenance history, every peer position leads to a conversation about what to actually do next. That is what separates benchmarking that changes plant behaviour from benchmarking that becomes another annual PDF.
Frequently Asked Questions
Turn Benchmarking From an Annual Report Into a Monthly Decision Tool
OxMaint's cement peer benchmarking software — k-anonymous, percentile-only, monthly-refreshed, 4-dimension matched. Trusted by cement groups because the trust is engineered in.