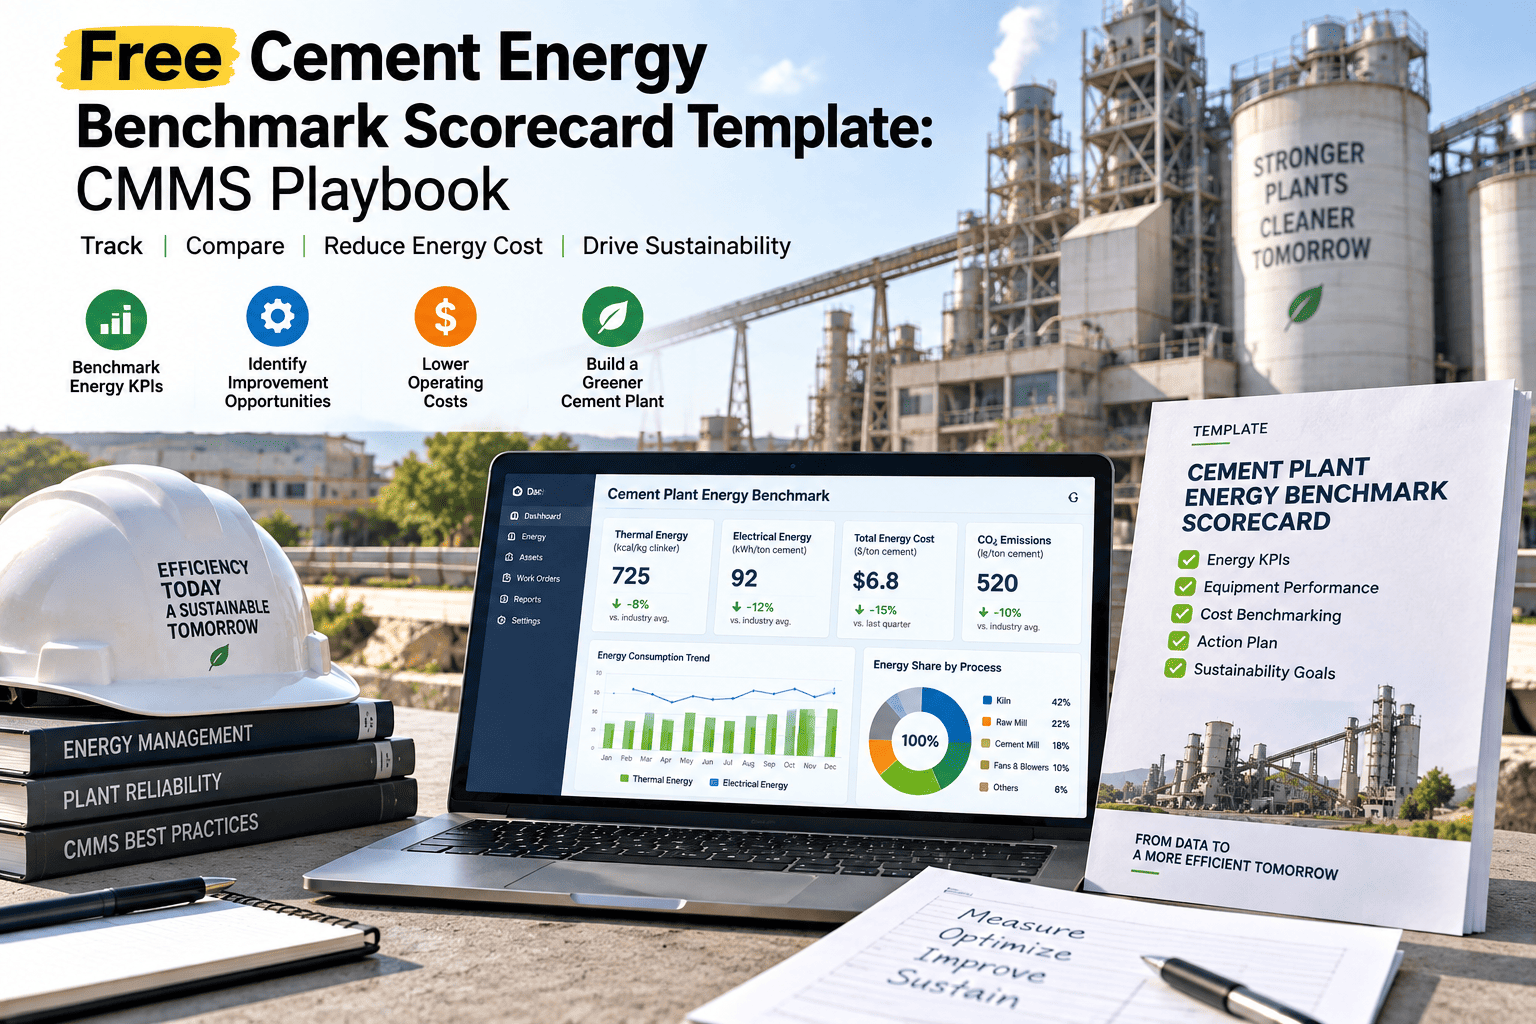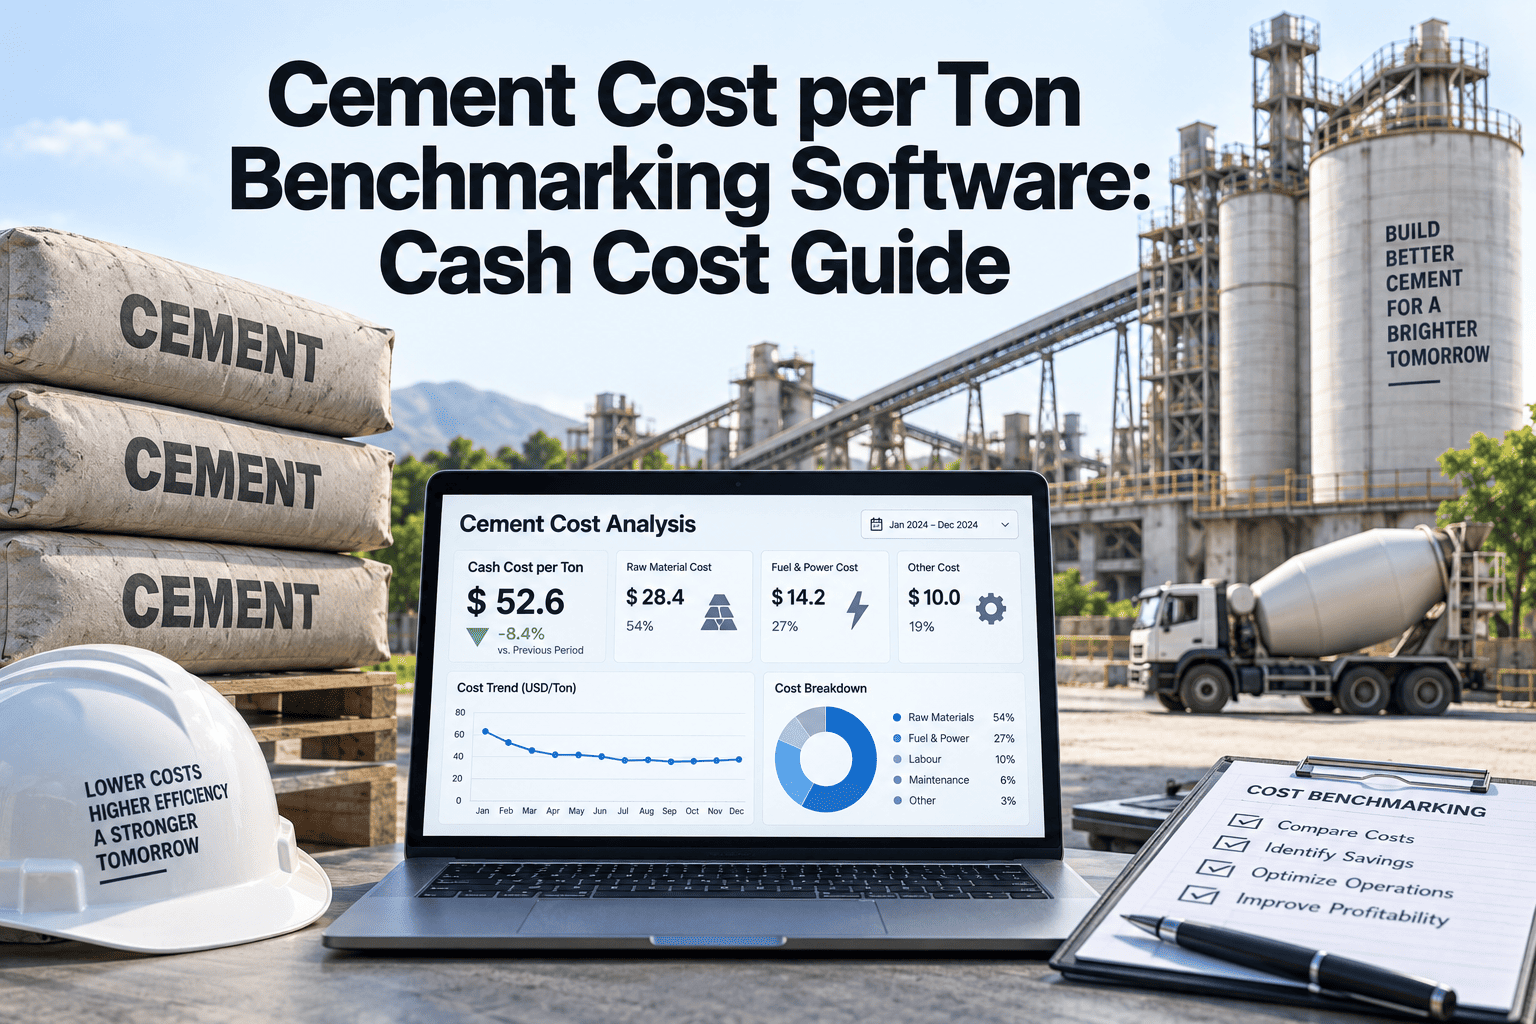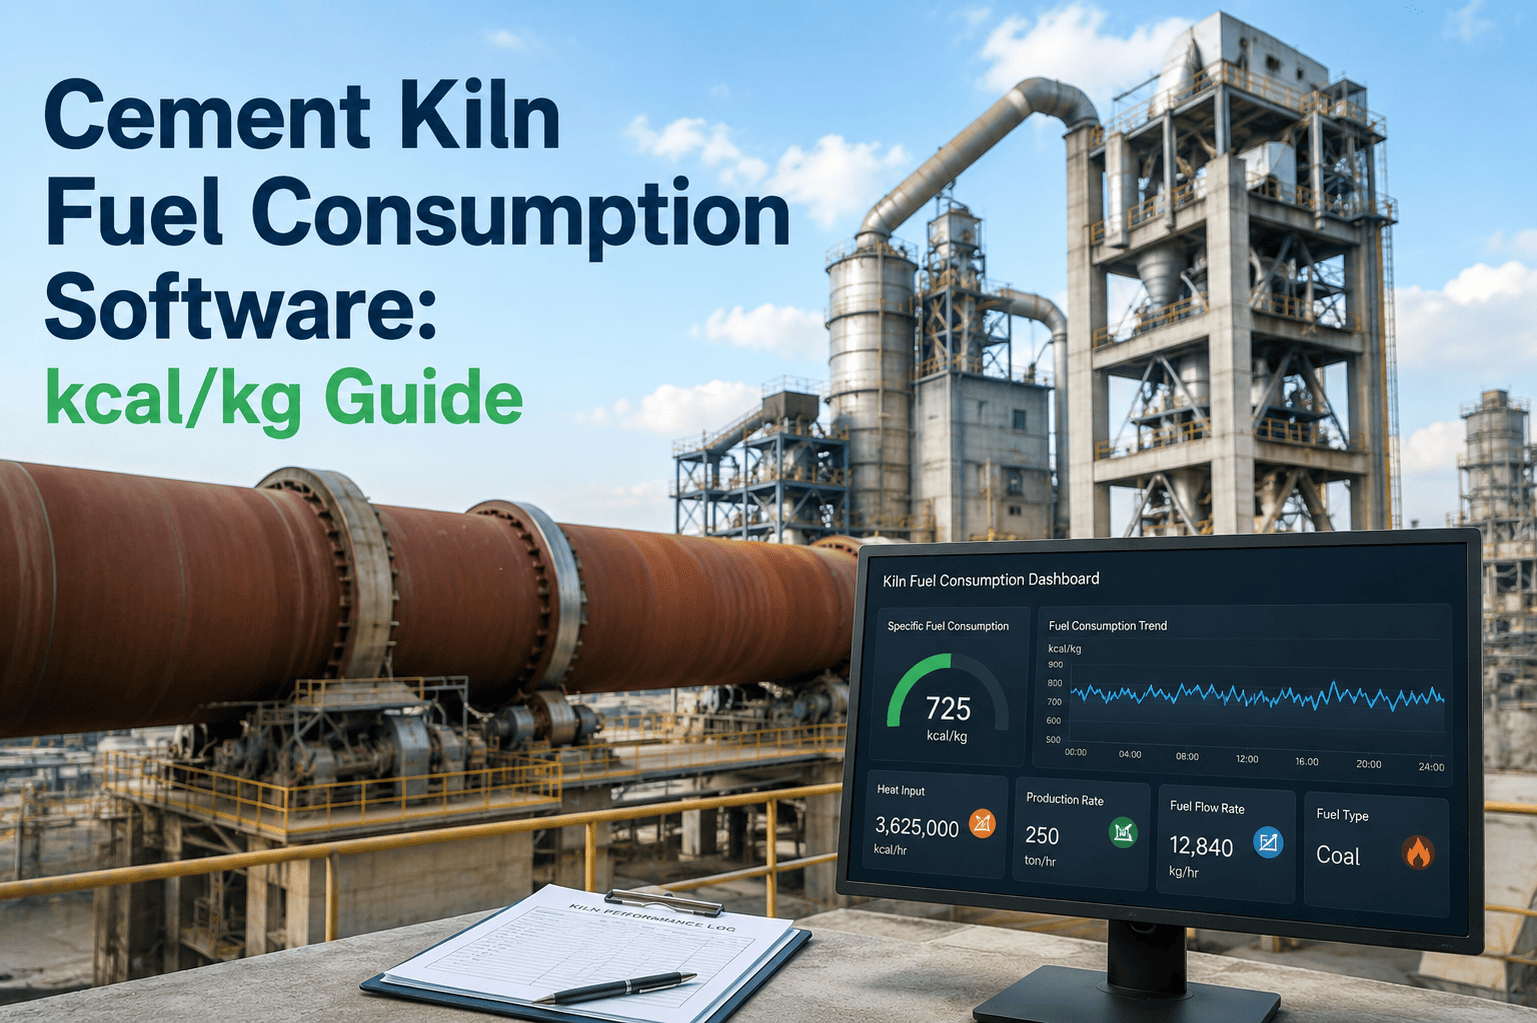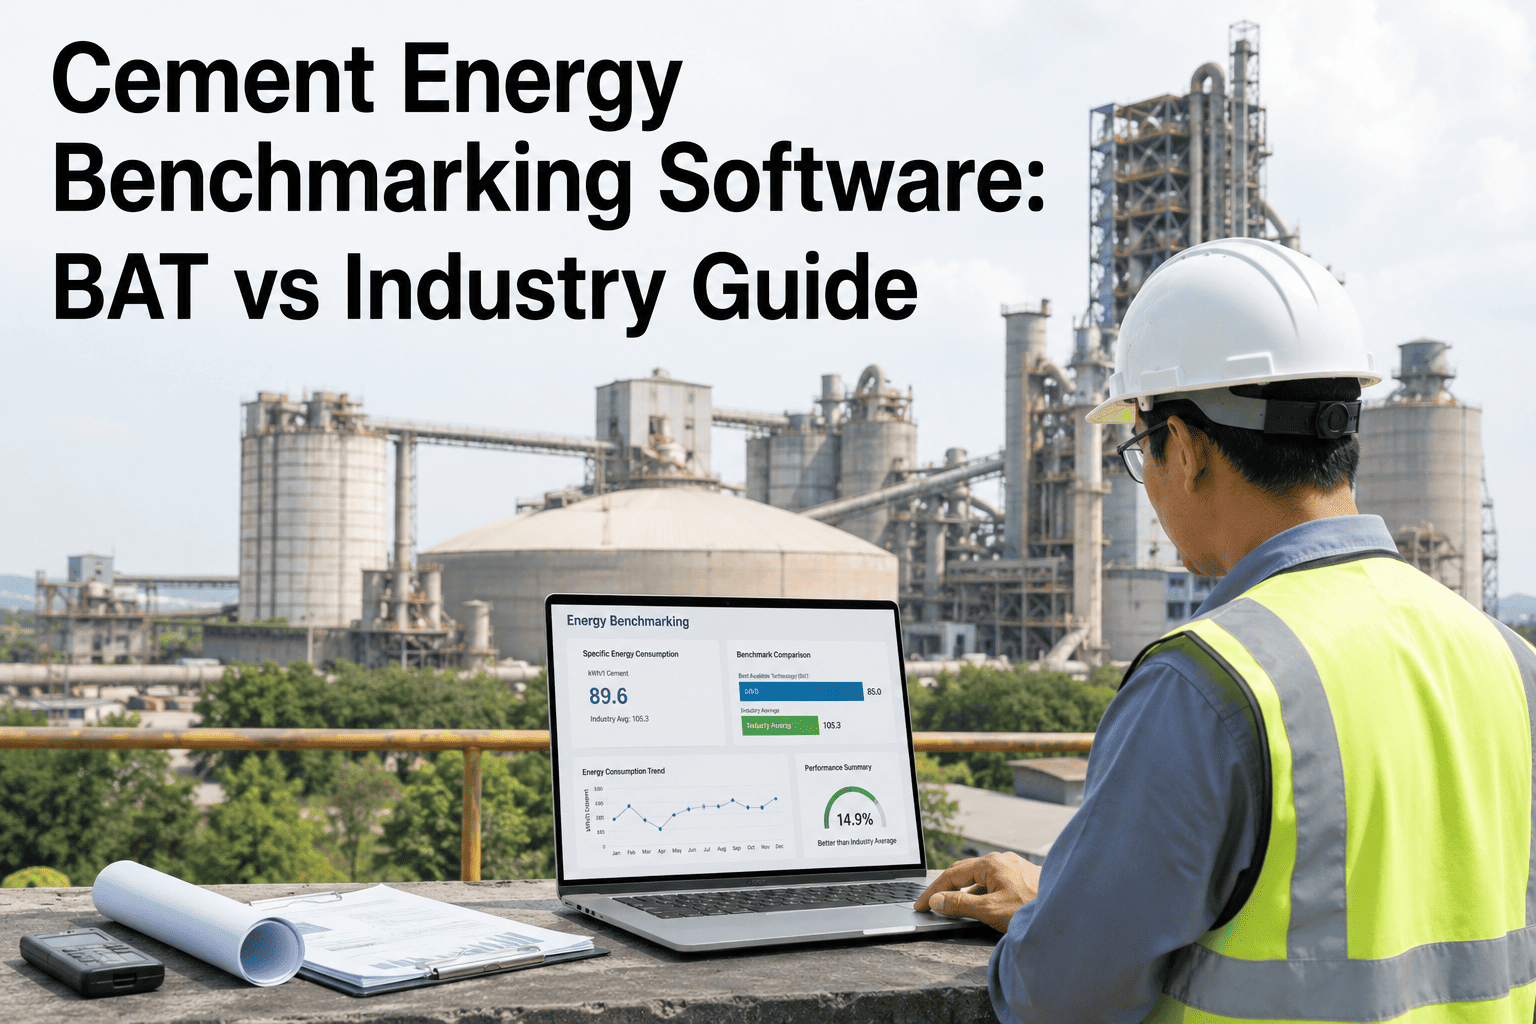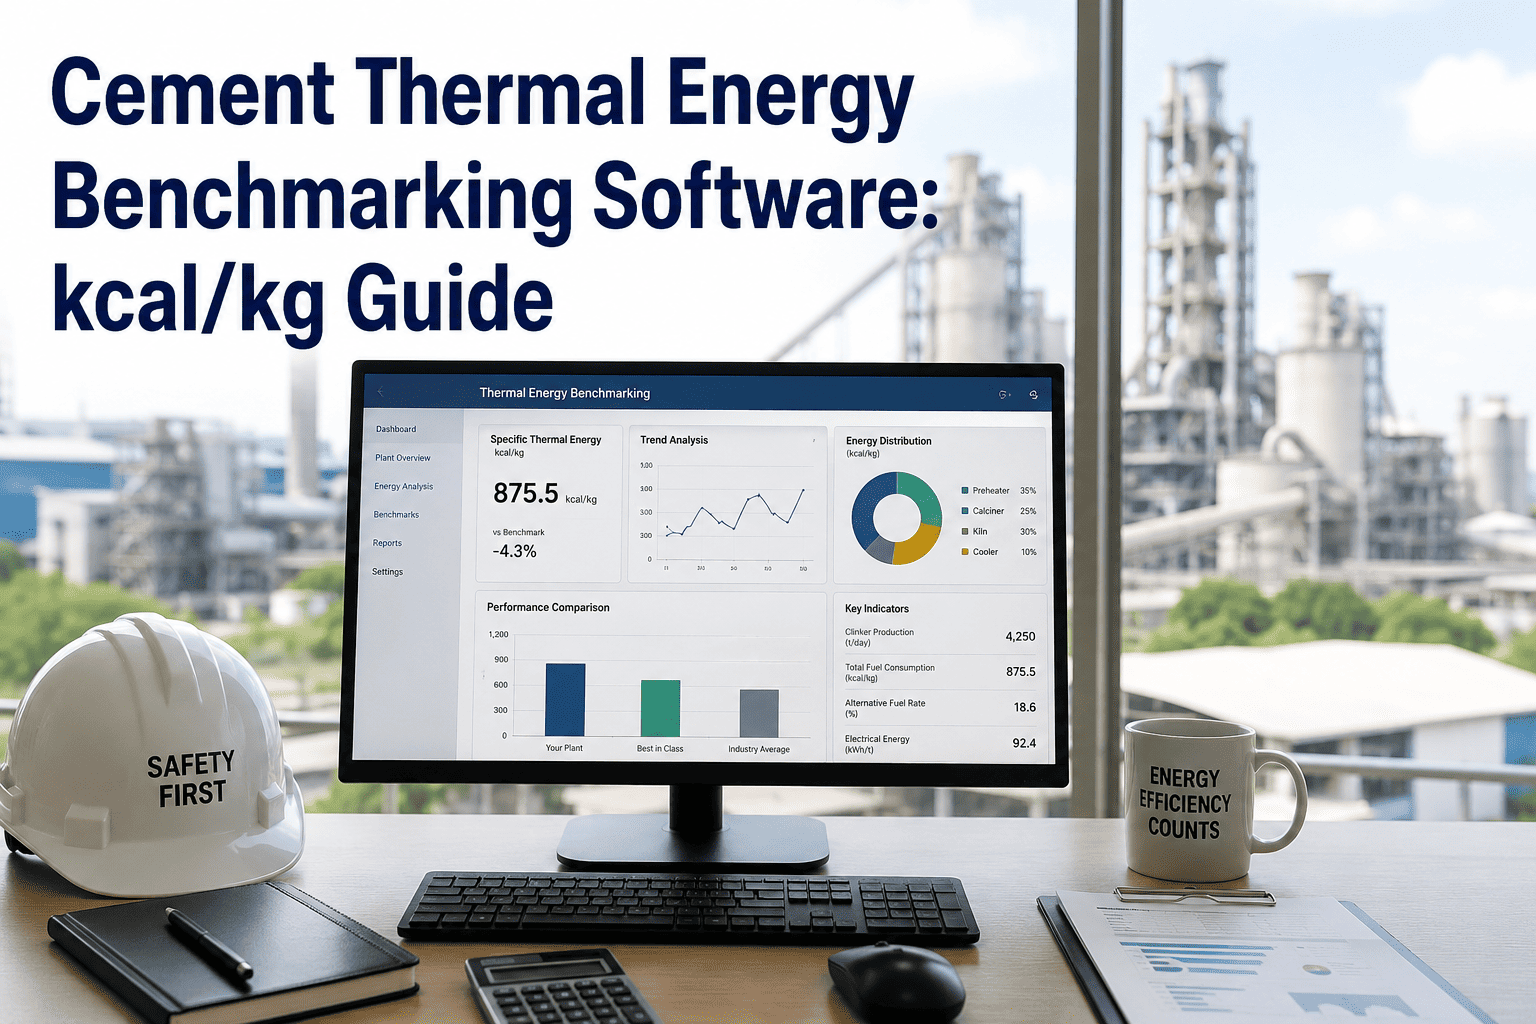
Kiln thermal energy consumption is the single number every cement plant GM asks about first, and it is also the number most plants track the least precisely. A kiln burning 20 kcal/kg more than it should on a 4,000 tonne-per-day line adds up to real fuel cost every single month, yet many plants still calculate specific heat consumption from a monthly manual spreadsheet pull instead of a live number tied to actual clinker output. Without continuous tracking, a slow drift caused by coating buildup, poor combustion air balance, or fuel quality change goes unnoticed until the quarterly energy audit flags it, long after the fuel bill absorbed the loss. Best Available Technology benchmarks sit in the 690–720 kcal/kg clinker range, and plants that cannot see where they stand against that line in real time have no way to defend their thermal KPI in a management review. A benchmarking platform like OxMaint ties kiln fuel input, feed rate, and clinker output together automatically so specific heat consumption updates in real time. That turns thermal efficiency from a quarterly report into a number the kiln team manages every shift.
Know Your kcal/kg Clinker Number Every Shift, Not Every Quarter
Specific heat consumption drifts quietly through coating loss, poor combustion balance, and fuel quality swings. Track kcal/kg clinker against BAT benchmarks continuously and catch the drift while it still costs pennies, not thousands.
Where Does Your Kiln Sit on the Thermal Efficiency Scale?
Specific heat consumption is measured in kilocalories of fuel energy per kilogram of clinker produced. Global benchmarking bodies group kiln performance into four bands, and most plants can place themselves within one of these ranges just by pulling last month's fuel and production totals.
How Specific Heat Consumption Is Actually Calculated
The formula behind the kcal/kg number is simple, but getting a reliable input feed is where most plants struggle. Manual spreadsheet entry means the number is only as fresh as the last data pull, usually days old by the time anyone reviews it.
Regional Thermal Benchmarks: How Plants Compare
| Region / Kiln Type | Typical kcal/kg Clinker | Gap to BAT (690) |
|---|---|---|
| Modern 6-stage preheater, precalciner | 690–710 | 0–20 kcal/kg |
| 4-stage preheater, precalciner | 730–760 | 40–70 kcal/kg |
| Older 4-stage preheater, no precalciner | 780–830 | 90–140 kcal/kg |
| Long dry kiln (no preheater) | 1,050–1,200 | 360–510 kcal/kg |
A 30 kcal/kg gap on a 4,000 tonne-per-day line translates into real monthly fuel cost. See how live kcal/kg tracking pinpoints exactly where that gap is coming from on your kiln.
What a Thermal Benchmarking Dashboard Should Track
A useful thermal KPI dashboard goes beyond a single kcal/kg number. It breaks the figure into the variables that actually move it, so the kiln team knows what to adjust instead of just watching the number climb.
Plant Case: Closing a 45 kcal/kg Gap in Two Quarters
We knew our kiln was running above BAT range, but our monthly spreadsheet only told us that after the fact. Once we put live fuel and production data into a benchmarking dashboard, we saw the specific heat number was spiking every time false air ingress rose around a worn kiln inlet seal. We scheduled seal replacement within weeks instead of waiting for the next annual shutdown. Our specific heat consumption dropped from 758 kcal/kg to 713 kcal/kg over two quarters, and we now defend that KPI in every management review with real-time data instead of a lagging estimate.
Frequently Asked Questions — Cement Kiln Thermal Energy Benchmarking
Turn kcal/kg Clinker Into a Number You Manage, Not Report
OxMaint ties fuel input, feed rate, and clinker output into one live thermal benchmarking dashboard — so your kiln team catches efficiency drift the same shift it starts, not the quarter after. Free to start, live across your plant in days.