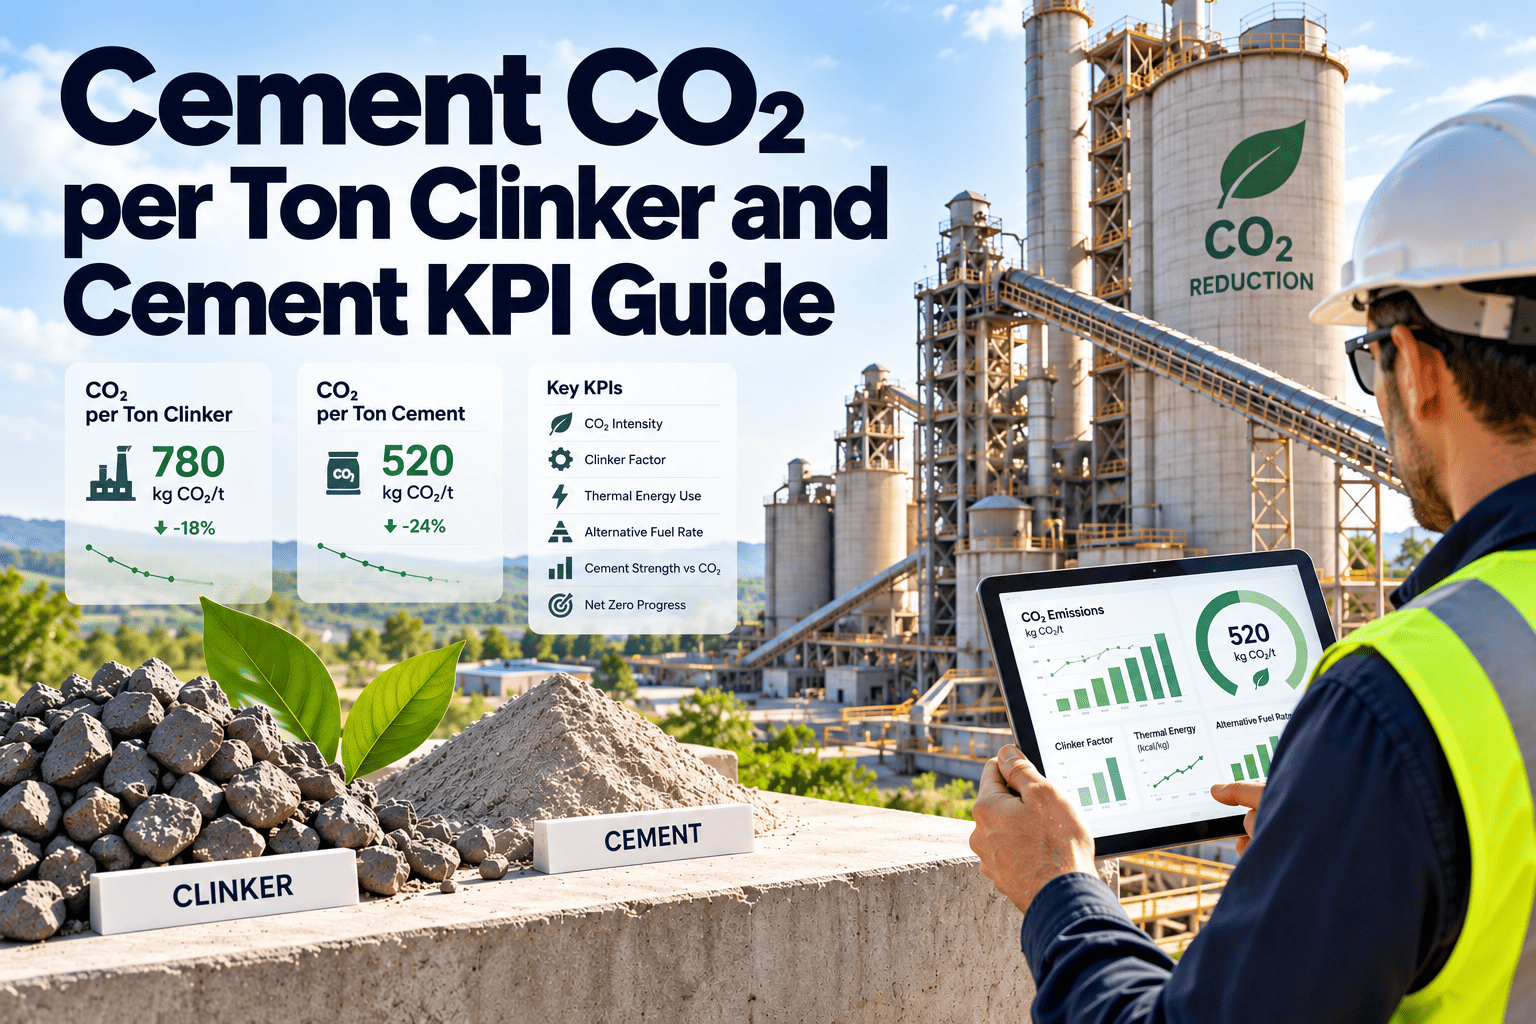
CO2 per tonne of clinker and per tonne of cement are the headline carbon KPIs of a cement plant, yet they are often calculated differently from site to site. Boundaries, clinker factors, and fuel assumptions change the result more than most teams expect. The number also moves with kiln stability, false air, fan efficiency, and downtime, which are maintenance topics. This guide defines the KPIs, shows what drives them, and explains how a cement plant maintenance software workflow keeps the underlying equipment data reliable.
CO2 per Ton of Clinker and Cement: Define It, Measure It, Improve It
Understand what sits inside each carbon intensity KPI and connect kiln, mill, and fan reliability to the number your management and customers see.
What builds the carbon intensity of a tonne of cement
Calcination of limestoneLargest share, fixed by chemistry
Kiln and calciner fuelVaries with heat efficiency and fuel mix
Grid electricityDepends on motor and fan efficiency
Clinker share in cementMultiplies everything above
Definitions
The Carbon KPIs Every Cement Plant Should Define in Writing
Agree on formulas and boundaries first. Without that, trends mislead and benchmarks compare unlike things.
| KPI | Basic formula | Boundary question to settle |
|---|---|---|
| Gross CO2 per tonne clinker | Direct CO2 from process and fuels divided by clinker produced | Are biomass and waste fuel emissions included in gross? |
| Net CO2 per tonne clinker | Gross CO2 minus the portion treated as biogenic or credited | Which protocol and rules define the deduction? |
| CO2 per tonne cementitious product | Total CO2 divided by cement plus other cementitious material sold or produced | Are bought-in clinker and SCMs included? |
| Clinker factor | Clinker used divided by cement produced | Is stock change handled consistently? |
| Specific heat consumption | Kiln thermal energy divided by clinker produced | Which fuels and dryer inputs are counted? |
| Electrical energy per tonne cement | Plant electricity divided by cement produced | Is captive and waste heat power included? |
Industry protocols such as the GCCA cement CO2 and energy protocol give common definitions. Confirm which version your company, regulator, and customers expect.
Calculation Logic
How the Numbers Connect From Kiln to Cement
Read the chain left to right. An error in any block carries into the final figure.
Clinker output
Production, stock change, and kiln feed records
leads to
Process CO2
Calcination of carbonates in raw meal, with dust correction where required
plus
Fuel CO2
Tonnes, calorific value, and factors for each kiln fuel
gives
Clinker KPI
Gross and net CO2 per tonne of clinker
times
Clinker factor
Converts to CO2 per tonne of cement
Electricity is usually reported separately as an indirect emission. Many plants show it beside the direct KPI so improvement from fan and mill efficiency is visible.
Improvement Levers
Five Ways Plants Lower CO2 per Tonne, and What Each Needs From Maintenance
Process emissions from limestone are largely fixed per tonne of clinker. That makes clinker reduction and heat efficiency the main levers.
1
Lower the clinker factor
Use more supplementary cementitious materials such as slag, fly ash, calcined clay, or limestone, within product standards.
Maintenance need: reliable dosing, grinding, and separator equipment
2
Improve kiln heat efficiency
Reduce heat losses from shell, false air, cooler inefficiency, and unstable operation.
Maintenance need: seal repair, refractory inspection, cooler care
3
Raise alternative fuel use
Replace fossil fuel with biomass or waste fuels where quality and kiln operation allow.
Maintenance need: feeders, samplers, and handling systems
4
Cut electricity use
Reduce kWh per tonne through efficient fans, mills, and drives.
Maintenance need: wear control, balance, alignment, lubrication
5
Recover waste heat
Generate power from kiln and cooler exhaust gas to offset purchased electricity.
Maintenance need: boiler, turbine, and heat exchanger reliability
Link Carbon KPIs to the Equipment That Moves Them
Track inspections, repairs, and recurring faults on kiln, cooler, fan, and mill assets in one place so reliability work supports carbon targets.
Emission Boundaries
Direct, Indirect, and Upstream Emissions in a Cement KPI
A KPI can look better or worse depending on which emission sources sit inside it. State the boundary beside every figure.
| Source | Typical classification | Where the data comes from |
|---|---|---|
| Limestone calcination | Direct process emission | Raw meal composition, clinker output, dust records |
| Kiln and calciner fuels | Direct combustion emission | Fuel weighers, laboratory analysis, factors |
| On-site mobile equipment and dryers | Direct, often smaller | Fuel purchase and consumption logs |
| Purchased electricity | Indirect energy emission | Plant meters and grid factor |
| Purchased clinker, SCMs, and transport | Upstream or value chain emission | Supplier data and logistics records |
Clinker Factor
What Limits How Far the Clinker Factor Can Fall
Lowering clinker content is the strongest lever, but it is bounded by product performance and material supply.
Technical limits
- Early and late strength requirements
- Setting time and workability
- Durability needs of the end use
- Grinding behaviour of blended materials
Supply and equipment limits
- Local availability and quality of slag, fly ash, or clay
- Storage, drying, and dosing capacity
- Mill and separator capability for finer products
- Applicable cement standards and customer specifications
Heat Consumption
Where Kiln Heat Is Lost and How to Find It
Specific heat consumption rises when heat leaves the system without making clinker. Each loss route has an inspection signal.
| Heat loss route | What maintenance can observe | Typical action |
|---|---|---|
| False air entry | Leaking seals, expansion joints, and inspection doors | Repair seals and track leak points |
| Shell radiation | Hot spots on thermal scans, refractory loss | Schedule scans and plan relining |
| Cooler exhaust and poor recovery | Grate damage, uneven air distribution | Inspect plates, fans, and dampers |
| Unstable feed and buildup | Frequent cleaning and blockages in cyclones | Review cleaning logs and root causes |
| Wet raw materials | Higher moisture to evaporate | Fix storage and drying issues |
Electrical Energy
Electricity Hotspots That Affect Indirect Emissions
Grinding and gas handling use most of the plant's electricity. Wear and imbalance raise consumption slowly, so trending is essential.
| Area | Main consumer | Maintenance driver of excess kWh |
|---|---|---|
| Raw grinding | Mill and mill fan | Worn grinding parts, fan wear, poor separation |
| Kiln line | ID fan and kiln drive | Impeller wear, false air, drive misalignment |
| Cooler | Cooler fans | Damper faults, clogged grates, fan degradation |
| Cement grinding | Mill, separator, and fans | Liner wear, ball charge issues, separator fault |
| Compressed air and utilities | Compressors and pumps | Leaks and poor control |
Maintenance Impact
Equipment Conditions That Quietly Raise Carbon Intensity
Carbon KPIs often drift because of small equipment problems that never trigger a trip.
| Equipment condition | Mechanism | KPI affected |
|---|---|---|
| Worn preheater and kiln seals | False air cools gas and raises fan load | Heat consumption, electricity |
| Damaged refractory or hot shell areas | Higher heat loss and risk of stops | Heat consumption, clinker output |
| Cooler grate or fan problems | Poor heat recovery from clinker | Heat consumption |
| Worn fan impellers | Lower efficiency and higher power draw | kWh per tonne |
| Mill and separator faults | Over-grinding or low throughput | kWh per tonne cement |
| Frequent kiln trips and restarts | Start-up fuel burned for little output | Fuel CO2 per tonne clinker |
Leading and Lagging
Build a KPI Board That Predicts, Not Just Reports
Carbon intensity is a lagging indicator. Add leading indicators from maintenance so teams can act before the monthly figure moves.
Lagging indicators
- Gross and net CO2 per tonne clinker
- CO2 per tonne cementitious product
- Specific heat consumption
- Electricity per tonne cement
Leading indicators
- Overdue seal and refractory inspections
- Open fan vibration alerts
- Kiln stops and restart count
- Repeat faults on cooler and mill assets
Kiln Stability
How One Kiln Trip Raises the Month's Carbon Intensity
A stop does more than lose output. Restarting a kiln burns fuel before good clinker is produced, and the cost lands in the monthly KPI.
1
Equipment fault causes a stop
A fan, feeder, or conveyor failure interrupts kiln feed or draft.
2
Kiln is held or cooled
Heat is kept or lost depending on stop length, and refractory is stressed by temperature change.
3
Restart burns extra fuel
Fuel is used to reheat the system while clinker quality is still unstable.
4
Output and quality recover
Off-spec clinker and lost production increase fuel and CO2 per tonne for the period.
Tracking every kiln stop with a cause code shows which equipment families trigger the most restarts. Fixing the top two or three causes usually protects the KPI more than adding new monitoring everywhere. Review stop causes monthly with operations so repeat faults reach the shutdown plan early.
Data Quality
Four Reporting Habits That Keep Carbon KPIs Credible
Keep a change log
Record when meters, weighers, and formulas change, so trend breaks can be explained rather than guessed.
Flag estimated data
Mark any month where values were estimated because an instrument was down, and note the method used.
Reconcile monthly
Compare fuel, clinker, and power totals with purchasing and sales records before publishing figures.
Archive evidence
Store calibration certificates, inspection records, and calculation files so audits start with complete folders.
Benchmarking
Avoid Misleading Comparisons
Weak comparison
- Gross figure compared with a net figure
- Different clinker factors ignored
- Monthly values compared across kiln shutdowns
- Estimated and measured data mixed without notes
Sound comparison
- Same boundary and protocol on both sides
- Clinker and cement KPIs shown together
- Operating days and stops shown beside the value
- Data quality flags on each reported month
Oxmaint Workflow
How Oxmaint Supports Carbon KPI Reliability
Oxmaint is a maintenance system, not an emissions calculator. It supports the equipment side of carbon performance.
01
Asset hierarchy by process area
Organise kiln, cooler, fan, mill, and fuel system assets so faults can be traced to the process stage they affect.
02
Preventive maintenance schedules
Plan seal checks, thermography, lubrication, and cooler inspections on set intervals.
03
Mobile inspections
Record shell temperature, leakage, vibration, and photos during rounds.
04
Corrective work orders
Raise and track repairs, with cause codes that connect failures to energy or fuel impact.
05
Spares and shutdown planning
Hold critical seals, refractory materials, and wear parts so repairs are not delayed.
06
Dashboards and reports
Show overdue work, repeat faults, and downtime by area next to energy and carbon reviews.
Monthly Review
Monthly Carbon KPI Review Checklist
Data checks
- Clinker production and stock change reconciled
- Fuel and raw meal data complete for the period
- Estimated values flagged with reasons
- Meter and weigher calibrations current
Equipment checks
- Seal, refractory, and cooler inspections completed
- Fan and mill alerts reviewed
- Kiln stops explained by cause
- Next shutdown scope updated with KPI risks
Target Setting
Setting Realistic Carbon Intensity Targets
A target is only useful when each contributing team knows its share of the gap. Work backwards from the plant KPI to equipment actions.
01
Establish a verified baseline
Use at least a full year of reconciled data, with stops and data gaps explained.
02
Split the gap by lever
Assign expected reductions to clinker factor, heat efficiency, fuel mix, and electricity.
03
Convert levers to equipment tasks
List seals, fans, cooler parts, and feeders that must be reliable to deliver each lever.
04
Review progress monthly
Compare leading indicators with the KPI trend and adjust shutdown scope early.
Responsibilities
Who Contributes to Each Carbon Intensity Driver
| Team | Contribution to the KPI | Evidence to share |
|---|---|---|
| Maintenance | Seal integrity, fan and mill condition, fewer unplanned stops | Inspection results, work order history, downtime causes |
| Kiln operations | Stable feed, fuel mix, and burning conditions | Shift logs, fuel settings, process alarms |
| Quality and laboratory | Product performance that allows lower clinker content | Strength results, composition analysis |
| Sustainability and energy | Calculation, reporting, and target tracking | Calculation files and verification records |
Quick Reference
Terms Used in Cement Carbon KPI Discussions
Clinker factor
The proportion of clinker in cement. A lower value usually means a lower carbon footprint per tonne of cement.
SCM
Supplementary cementitious material, such as slag, fly ash, calcined clay, or ground limestone, used to replace part of the clinker.
Specific heat consumption
Thermal energy used per tonne of clinker, a direct signal of kiln efficiency and heat loss.
Embedded emissions
Emissions attributed to a tonne of product, requested by customers and by border carbon schemes.
Calcination
The chemical release of CO2 when limestone is heated in the kiln system, which cannot be removed by fuel switching alone.
False air
Unwanted air drawn into the kiln line through leaks, which lowers heat efficiency and increases fan power.
FAQ
Cement CO2 KPI Questions
Why is CO2 per tonne of cement lower than per tonne of clinker?
Cement contains other materials besides clinker, so the clinker factor scales the figure down.
Can maintenance really change the carbon KPI?
Yes, through heat loss, false air, fan efficiency, and kiln stability. Get started to track these causes.
What is the difference between gross and net CO2?
Net removes portions such as biogenic carbon under the chosen rules. Always state which one you report.
Which KPI should maintenance teams watch most?
Specific heat consumption and kWh per tonne respond most to equipment condition. Book a demo to see how to link them to work orders.
How often should carbon KPIs be reviewed?
Review monthly with maintenance and operations, and check leading indicators weekly.
Make Reliability Part of Your Carbon Intensity Plan
Give maintenance teams the inspections, work orders, and history they need to protect heat efficiency, power use, and kiln stability.