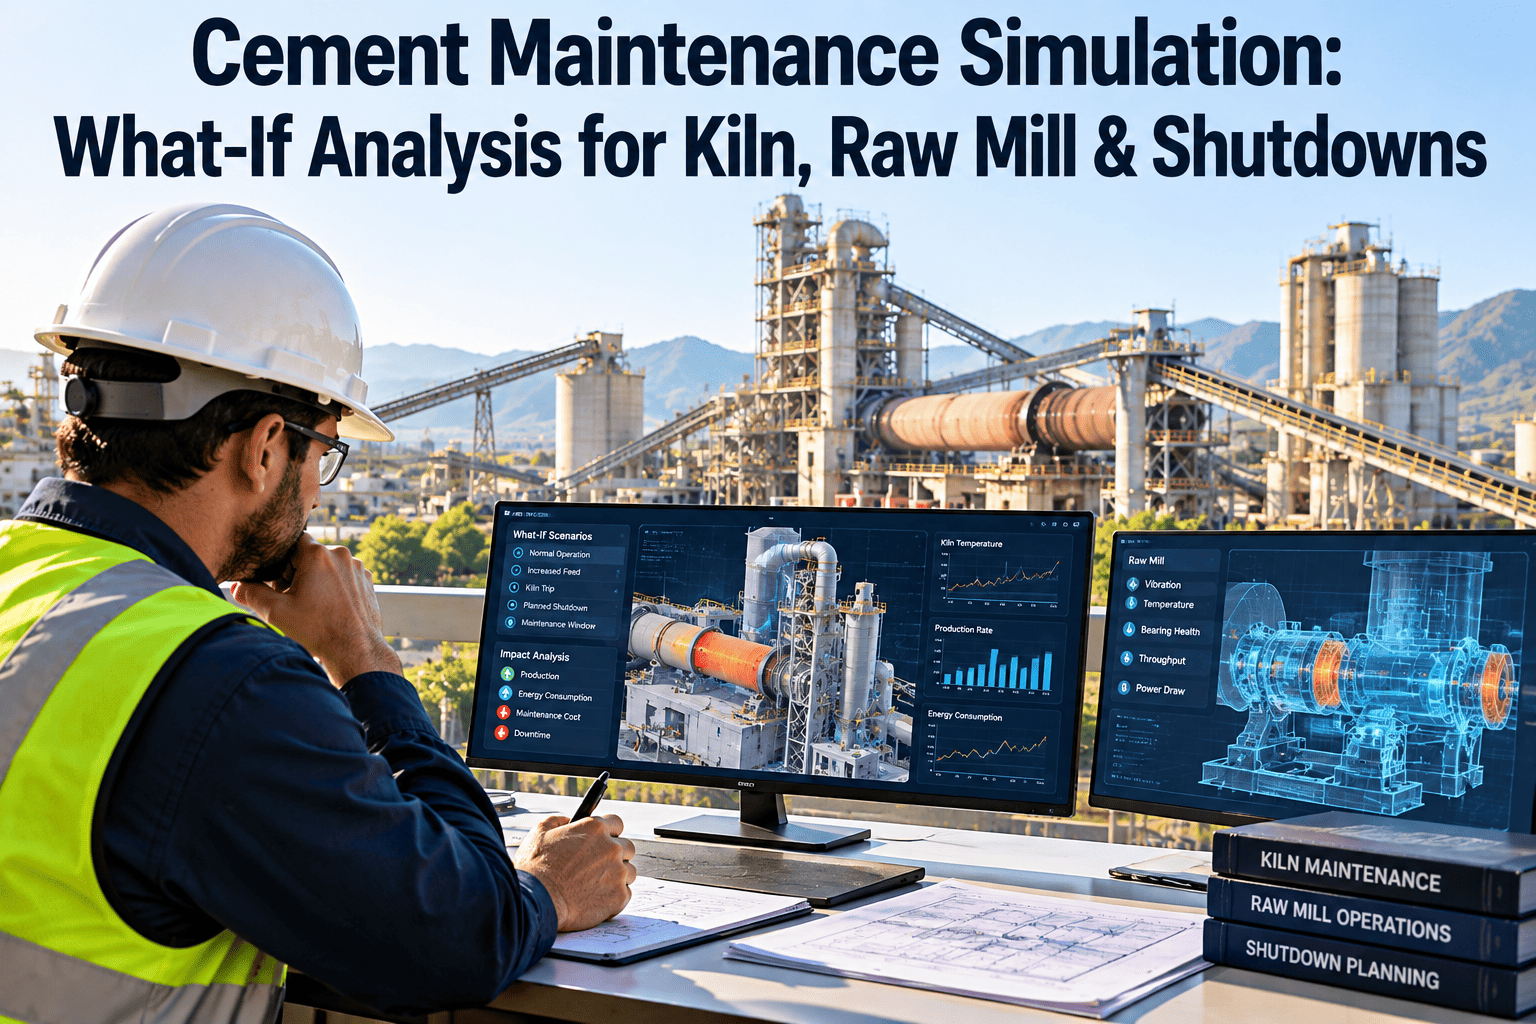
Every cement plant maintenance manager eventually faces the same question: what happens to clinker output, cost and risk if we change the plan? Delay the refractory job by a month, run the raw mill on a worn roller through the monsoon, or add three days to the kiln shutdown. Most plants answer from experience and spreadsheets. A maintenance simulation replaces the guesswork with a model built on your own failure history, spare stock and production targets, and a maintenance management platform like Oxmaint supplies the clean data that model depends on.
Cement Maintenance Simulation for Kiln, Raw Mill and Shutdown Decisions
Test maintenance decisions on a model before you test them on the plant. See how a deferred job, a longer shutdown or a different spare strategy changes downtime, clinker stock and cost per ton.
Why Cement Plants Need What-If Analysis
A cement line is a single chain. The kiln cannot run without raw meal, the cement mills cannot run without clinker, and every stop moves stock levels in silos that are finite. That coupling makes maintenance decisions hard to judge by intuition alone.
Decisions Made Without a Model
- Shutdown scope is copied from last year and padded for safety
- Deferral is approved because the equipment "sounds fine"
- Spare parts are stocked by habit, not by failure probability
- Production and maintenance argue with opinions, not numbers
- Consequences appear only after the failure
Decisions Tested on a Model
- Scope is ranked by risk reduction per shutdown hour
- Deferral shows its probability of failure before approval
- Spares are sized to failure rate, lead time and criticality
- Both teams review the same downtime and cost range
- Consequences are visible before any money is spent
What a Maintenance Simulation Actually Is
In cement, a maintenance simulation is a digital representation of equipment, failure behavior, repair resources and production flow. It is usually built on reliability statistics such as Weibull life curves for wearing parts, combined with Monte Carlo runs that repeat the year many times with random failures. The result is a range of outcomes, not a single promise.
Model Inputs: What the Simulation Needs From Your CMMS
A simulation is only as honest as its data. Most of what it needs already sits in work orders, inspection records and stores transactions, provided they were recorded consistently.
| Input | Where It Comes From | Why It Matters |
|---|---|---|
| Failure history per asset | Corrective work orders with failure codes | Sets how often each failure mode is likely to occur |
| Repair duration | Work order start, finish and delay records | Turns a failure into hours of lost production |
| Wear measurements | Inspection rounds and condition readings | Shows how close a component is to its limit |
| Spare stock and lead time | Inventory and purchasing records | Decides whether a repair takes hours or weeks |
| Crew and contractor hours | Scheduling and labor records | Limits how much shutdown scope can be executed |
| Silo levels and stop history | Production data and downtime logs | Defines how long a stop can be absorbed |
The Data Quality Trap
If every breakdown is closed as "mechanical fault", the model cannot separate a roller bearing failure from a lubrication failure. Structured failure codes, honest downtime capture and consistent asset hierarchies do more for simulation accuracy than any modeling software.
Kiln What-If Scenarios
The kiln system carries the highest cost per hour of stoppage, so it is the natural first target for simulation.
Extend Refractory Campaign by One Month
Inputs: brick thickness scans, shell temperature history, past hot spot events. Question: does the added production outweigh the higher chance of an emergency stop, which costs a cold restart, brick damage and unplanned repair scope?Kiln Drive and Support Roller Failure
Inputs: girth gear and pinion condition, roller alignment records, gearbox oil analysis. Question: if the pinion fails, how long is the kiln down with and without a spare in the store?Preheater Blockage Frequency
Inputs: cyclone cleaning logs, alkali and chloride trends, air cannon reliability. Question: does upgrading the cleaning routine reduce unplanned kiln stops enough to justify the labor?Clinker Cooler Grate and Fan Failure
Inputs: grate plate replacement history, fan vibration data. Question: how much output is lost when the cooler runs derated for a week waiting for parts?Raw Mill What-If Scenarios
A vertical roller mill fails gradually, which makes it ideal for wear-based simulation. The raw meal silo gives a time buffer, and the simulation shows how much.
Roller and Table Wear
Model the wear rate against throughput and material abrasiveness. Compare re-surfacing by welding at set intervals against replacing at a fixed hour count, including the mill downtime each option needs.Mill Fan and Separator
Test how fan imbalance or separator wear reduces grinding capacity long before a trip. Simulate how a small drop in feed rate accumulates against silo cover.Hydraulic and Lubrication Systems
Model filter change intervals and seal failures. Small oil-related events often cause the longest repeat stops, so their frequency drives the result.The Silo Buffer Question
The most useful raw mill output is often not the failure probability but the buffer answer: for how many hours can the mill be down before kiln feed is threatened? That number decides whether a repair can wait for a planned window.
Shutdown What-If Scenarios
Shutdown planning is where simulation pays back fastest, because scope, duration and resources can all be varied on paper first.
| Option | What Changes | Gain | Risk to Test |
|---|---|---|---|
| Add three days to scope | Extra jobs done while kiln is cold | Fewer stops later in the year | Lost clinker versus avoided failures |
| Keep scope tight | Only critical and safety jobs | Shortest outage | Deferred wear returns as breakdown |
| Add contractor crews | More parallel work fronts | Shorter critical path | Congestion, safety and quality control |
| Split into two smaller stops | Work spread across the year | Lower stock pressure per stop | Two cool-downs and two heat-ups |
| Pre-stage parts and tools | Kits ready before isolation | Less waiting inside the outage | Cost of early purchase |
Use the Critical Path, Not the Job List
A shutdown is not the sum of its jobs. It is the longest chain of dependent tasks: cool down, refractory removal, inspection, repair, bricking, dry out and heat up. Simulation shows which jobs sit on that chain and which have float, so effort goes where hours are actually saved.
Give Your Simulation Trustworthy Data
Structured work orders, failure codes and inspection records are the raw material of every reliable model. Start building that record in Oxmaint, or see how it fits your kiln and mill workflow.Reading the Results: Risk Matrix
Simulation output should end in a decision. A simple matrix of probability against production impact turns hundreds of runs into a ranked action list.
Percentiles, Not Averages
Ask for the 50th and 90th percentile of downtime, not only the average. An average of 10 days hides the 1-in-10 year that runs to 25 days. That tail is what damages delivery commitments and cash flow.
KPIs to Compare Between Scenarios
Checklist Before You Run the First Scenario
Limits You Should State Openly
A simulation cannot predict a failure mode it has never seen, and it cannot fix poor data. Treat the output as decision support, review assumptions with the people who run the equipment, and update the model after each real shutdown.
Where Oxmaint Fits in the Simulation Workflow
Oxmaint does not replace a modeling tool. It provides the maintenance record the model runs on, and it executes the plan the model recommends.