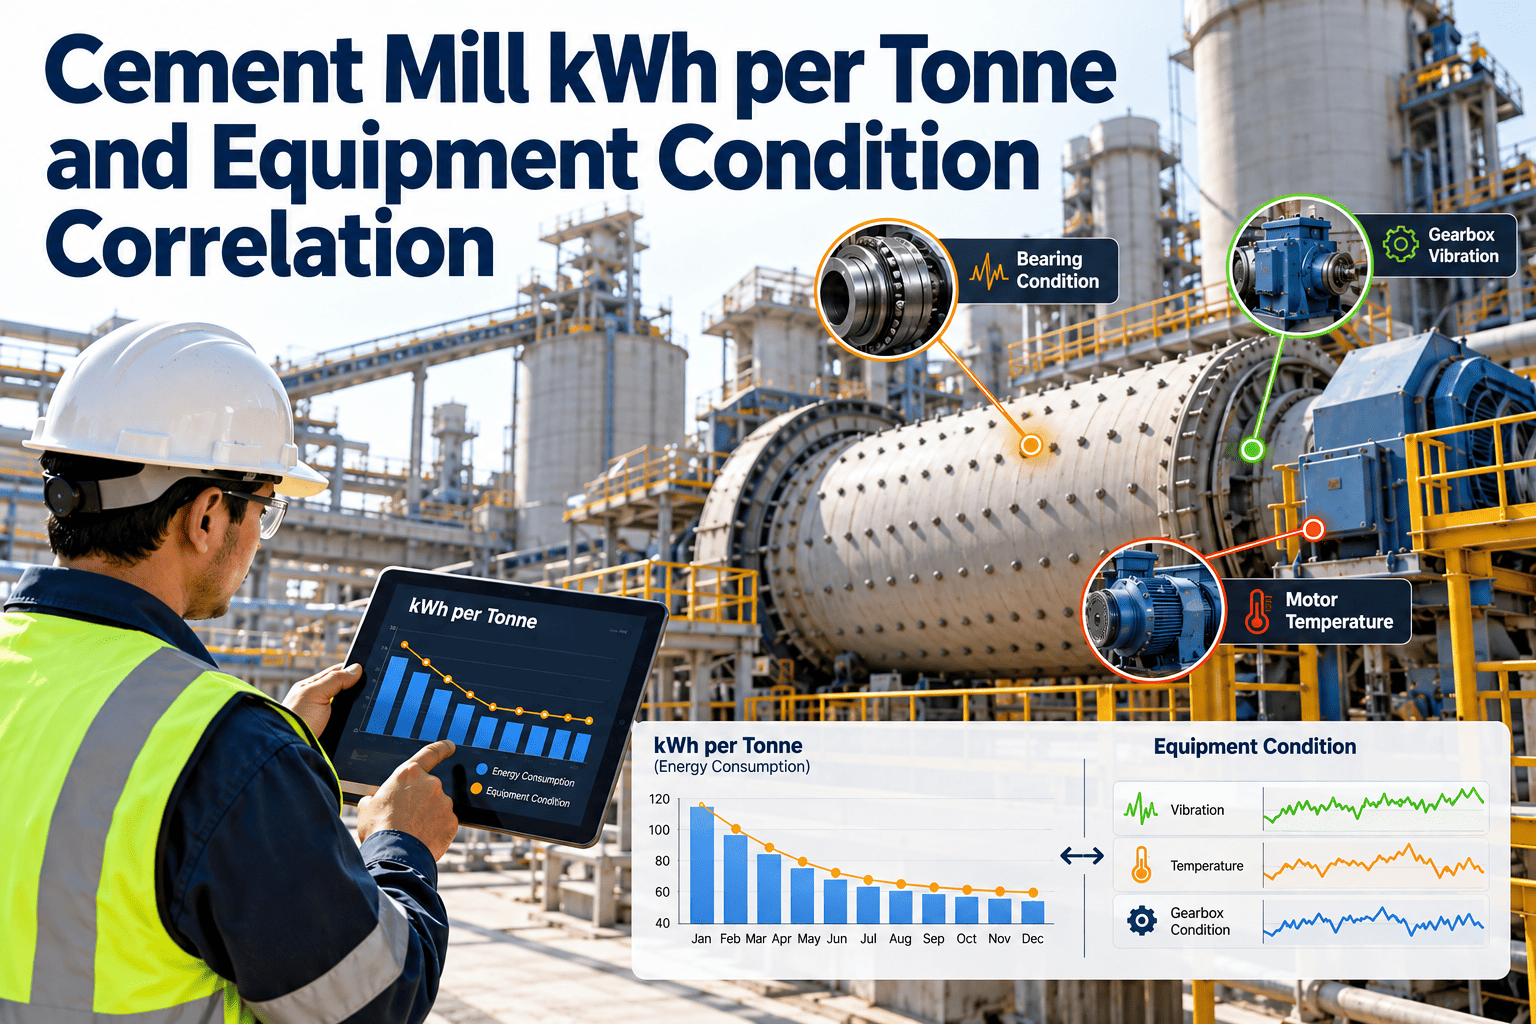
Specific energy consumption, measured in kWh per tonne, is the number most cement plants watch on their grinding circuits. It rises and falls with product type, fineness and feed rate, but it also drifts with worn liners, tired grinding media, dirty filters and failing fans. Separating the process effect from the equipment effect is where real savings hide. This article shows how to correlate mill energy with equipment condition so maintenance spend follows measurable energy loss. If you want to track condition and work history alongside your energy data, you can start a free Oxmaint workspace and connect the two.
Cement Mill kWh per Tonne and Equipment Condition Correlation
Find out how much of your grinding energy is process demand and how much is avoidable loss caused by worn, dirty or misadjusted equipment.
Process inputs
Cement type and fineness
Clinker grindability
Additives and moisture
plus
Equipment condition
Liners and grinding media
Separator and fans
Filters, seals and drives
equals
kWh per tonne
Normalised and trended
Linked to work orders
Why kWh per tonne alone can mislead
A single energy figure blends many causes. A rise may come from a harder clinker, a finer product or a failing separator, and each needs a different response from operations and maintenance.
Process-driven changes
- Switching to a finer or higher-strength cement grade
- Harder or less reactive clinker from the kiln
- Higher share of cementitious additives with different grindability
- Feed moisture and gypsum dosing changes
- Planned throttling to match dispatch demand
Condition-driven changes
- Worn liners or lifters changing the grinding action
- Ball charge out of gradation or low filling level
- Separator vanes, seals or rotor wear reducing selectivity
- Blocked filter media or leaking ducts upsetting mill draft
- Misalignment, lubrication faults and drive losses
The aim is not to blame equipment for every increase. It is to remove the process effect first, then see what remains.
Condition indicators to track against energy
| Circuit element | Condition signals | Likely energy symptom | Maintenance response |
|---|---|---|---|
| Ball mill shell and liners | Liner thickness profile, noise, motor current pattern | Lower grinding efficiency at the same load | Plan liner inspection and replacement scope |
| Grinding media | Charge level, size distribution, wear sampling | Poor gradation raises energy for target fineness | Top-up and re-grade at planned stops |
| Vertical roller mill | Roller and table wear, hydraulic pressure, vibration | Higher specific power and unstable bed | Resurface, adjust and check hydraulics |
| Roller press | Roll surface condition, gap, pressure stability | Reduced pre-grinding benefit | Inspect studs and surface, correct settings |
| Separator | Rotor speed, vane and seal wear, return flow | Over-circulation and wasted grinding work | Repair wear parts and verify alignment |
| Mill fan and ducts | Differential pressure, fan current, leaks | Extra fan power or restricted ventilation | Clean filter, seal leaks, inspect impeller |
| Drive train | Gearbox oil, vibration, alignment, motor temperature | Mechanical losses and trips | Condition-based lubrication and alignment checks |
A six-step correlation workflow
1
Define the baseline
Pick a stable period per product type and record energy, feed rate and fineness.
2
Normalise
Compare like with like: same cement grade, similar clinker, similar load.
3
Log condition
Capture inspection findings, readings and repairs against each asset.
4
Overlay events
Place work orders and findings on the energy trend as markers.
5
Test the link
Check whether energy changed after repairs or as defects developed.
6
Prioritise work
Rank tasks by energy impact, reliability risk and available window.
Put condition history next to your energy trend
Record inspections, repairs and work orders against each mill asset so energy changes can be explained, not guessed.
Normalisation: separating the process from the machine
Correlation fails when the comparison is unfair. Agree a short list of conditions that must match before two periods are compared.
Same cement type and target fineness
Comparable clinker source and quality
Similar additive proportions
Mill running at stable feed rate
Separator and ventilation settings recorded
Run hours since last liner or media change noted
Auxiliary equipment energy included or excluded consistently
Start-up and shutdown periods removed
Reading the pattern
After normalising, the shape of the trend usually points to the cause. These patterns are starting hypotheses to verify on site.
| Trend pattern | Possible cause | First check |
|---|---|---|
| Slow steady rise | Progressive wear of liners, rollers or separator parts | Wear measurements and run hours |
| Step change after an event | Setting change, repair or component replacement | Work order and operator log for that date |
| Cyclic swings | Unstable bed, feed fluctuation or filter cleaning cycles | Mill vibration and differential pressure |
| Rise with higher circulating load | Separator inefficiency | Rotor, vanes and seals |
| Rise with draft problems | Filter blockage or duct leakage | Pressure drop and fan current |
A diagnostic path when specific energy rises
kWh per tonne rising on a normalised basis
Is circulating load higher?
Inspect separator wear, seals and rotor speed. Check return flow and fineness.
Is mill draft or filter pressure drop abnormal?
Inspect filter media, ducts and fan. Look for false air and build-up.
Has vibration or noise changed?
Check liners, media level, rollers and bed stability depending on mill type.
Is motor or gearbox condition degrading?
Review temperatures, oil analysis, alignment and coupling state.
From reactive reporting to condition-linked energy review
Before
- Energy report reviewed monthly in isolation
- Maintenance learns about losses after the fact
- Repairs justified by failure risk only
- No record of energy before and after a repair
After
- Energy trend reviewed with asset condition notes
- Drift triggers an inspection task, not just a comment
- Repairs justified by reliability and energy together
- Repair results checked against a normalised baseline
Indicators worth reviewing weekly
Normalised kWh per tonne
By cement type and mill
Circulating load trend
Separator health proxy
Open condition findings
By grinding circuit asset
Overdue preventive tasks
Lubrication, alignment, filters
Where Oxmaint fits in an energy and condition programme
Oxmaint maintenance management software holds the condition side of the story: what was inspected, what was found and what was repaired. It complements your energy meters and historian rather than replacing them.
| Need | Oxmaint capability |
|---|---|
| Record liner, media and separator inspections | Mobile inspection checklists with readings and photos |
| Know every repair on a mill asset | Asset records with work order history |
| Prevent slow efficiency loss | Preventive maintenance schedules for lubrication, filters and alignment |
| Act on a finding | Corrective work orders with priority and assignment |
| Plan wear part replacement | Inventory visibility for liners, vanes, seals and bearings |
| Review performance | Reports and dashboards on backlog and task completion |
Grinding circuit types and what drives their energy use
Cement grinding is not one technology. Ball mills, vertical roller mills and roller press circuits respond differently to wear and maladjustment, so correlation work should respect the circuit you actually operate.
| Circuit | Energy behaviour | Main condition drivers | Inspection focus |
|---|---|---|---|
| Closed-circuit ball mill | Energy depends on grinding efficiency and how much material the separator returns to the mill | Liner profile, media gradation, diaphragm condition, separator selectivity | Liner wear, media charge, diaphragm slots, separator rotor and seals |
| Open-circuit ball mill | Fineness is controlled only by the mill, so over-grinding wastes energy | Media state, ventilation, feed consistency | Charge level, mill draft, cooling water or spray condition |
| Vertical roller mill | Sensitive to bed stability, roller and table wear, and hydraulic settings | Roller surface, table liner, hydraulic accumulators, nozzle ring | Wear profile, hydraulic pressure stability, vibration trend, fan and filter condition |
| Roller press with ball mill | Press pre-grinding reduces ball mill load when the press is healthy | Roll surface, gap and pressure, edge effects, recirculation | Roll surface condition, bearing and hydraulic checks, deagglomerator wear |
Data to capture with every energy review
An energy number without context cannot be compared next month. Record a short set of facts each time the trend is reviewed.
Dates and run hours covered by the review period
Product grades produced and tonnage of each
Clinker source and any known quality change
Maintenance work completed in the period
Inspection findings still open on mill assets
Operating changes such as speed, pressure or setpoint changes
Stoppages and the reason for each
Meter calibration or data gaps noticed
Proving the value of a repair with energy data
A liner change, separator rebuild or filter replacement is easier to justify when you can show what it did to normalised energy. The discipline is the same every time.
1
Record the before state
Capture normalised energy, vibration, circulating load and inspection findings before work starts.
2
Fix the comparison window
Decide in advance how many days or operating hours you will compare before and after.
3
Document the work
Attach what was replaced, adjusted or cleaned to the work order, with photos and measurements.
4
Allow stabilisation
New liners, media or surfaces may need time to settle, so avoid judging the first hours.
5
Compare like with like
Use the same product, similar clinker and similar load before and after.
6
Record the outcome
Store the result on the asset so the next planner knows what the repair achieved.
An illustrative scenario: separator wear and rising energy
This scenario is a simplified example of how the reasoning works. It is not measured plant data.
What the team sees
- Normalised kWh per tonne has crept upward over several weeks for one cement grade
- Circulating load is higher than before at the same product fineness
- Clinker quality and mill feed have been stable
- Operators report more material in the reject stream
What the team does
- Raises an inspection task for the separator rotor, vanes and seals
- Finds wear that lets coarse material pass back to the mill
- Plans the repair for the next window and orders the parts
- Compares normalised energy and circulating load after the repair
The value comes from the sequence: a trend triggers an inspection, the finding becomes a work order, and the result is checked against a fair baseline.
Who owns which part of the correlation
| Role | Contribution | Record kept |
|---|---|---|
| Control room operator | Notes process changes, grade switches and unusual behaviour | Shift log and handover entries |
| Process engineer | Defines normalisation rules and reviews energy trends | Baselines and review notes |
| Maintenance technician | Performs inspections and repairs, records findings and measurements | Inspection results and work order notes |
| Maintenance planner | Schedules work, parts and windows based on findings | Planned and completed work orders |
| Reliability engineer | Analyses recurring losses and sets condition limits | Failure and condition analysis |
| Energy manager | Reports consumption, savings and targets to management | Energy reports and verified savings |
Planning wear-part replacement with energy in mind
Plan ahead
- Track wear measurements over time, not just at replacement
- Order long-lead liners, rollers and separator parts before the window
- Combine liner work with media regrading and alignment checks
- Agree which findings will be repaired and which monitored
- Record the energy baseline before the stop
Avoid
- Running parts to failure when energy loss is already visible
- Replacing early without evidence of wear or loss
- Treating the mill alone and ignoring fans, filters and separator
- Skipping documentation, which makes later comparison impossible
- Judging a repair on the first day after restart
Over a year this approach builds a record that links wear states to energy performance. That record is more persuasive than any generic benchmark when you ask for budget or a longer stop.
Questions this correlation helps answer
- Is the rise in kWh per tonne caused by product mix or by equipment condition?
- Which mill assets should be inspected first when energy drifts?
- Did the last liner change, separator repair or filter replacement actually reduce energy?
- How much planned maintenance is justified by energy savings alone?
- Are preventive tasks on lubrication, alignment and cleaning being completed on time?
- Which operating practices keep energy low between planned stops?
Frequently asked questions
What affects cement mill kWh per tonne most?
Product fineness, clinker grindability and circuit condition, especially separator efficiency, media state and ventilation.
How do I know if a rise is process or equipment?
Normalise by cement type, fineness and load first. What remains is more likely condition-related.
Do I need new sensors to start?
Not necessarily. Structured inspections and work history already add value. You can book a demo to scope it.
Which assets should be tracked first?
Start with the mill itself, the separator, the mill fan and the filter, then add drives.
Can maintenance tasks be tied to energy findings?
Yes. Log the finding on the asset and raise a work order. Try it in Oxmaint.
Stop paying for avoidable grinding losses
Connect inspections, repairs and preventive tasks to your mill energy review and focus effort where condition drives consumption.