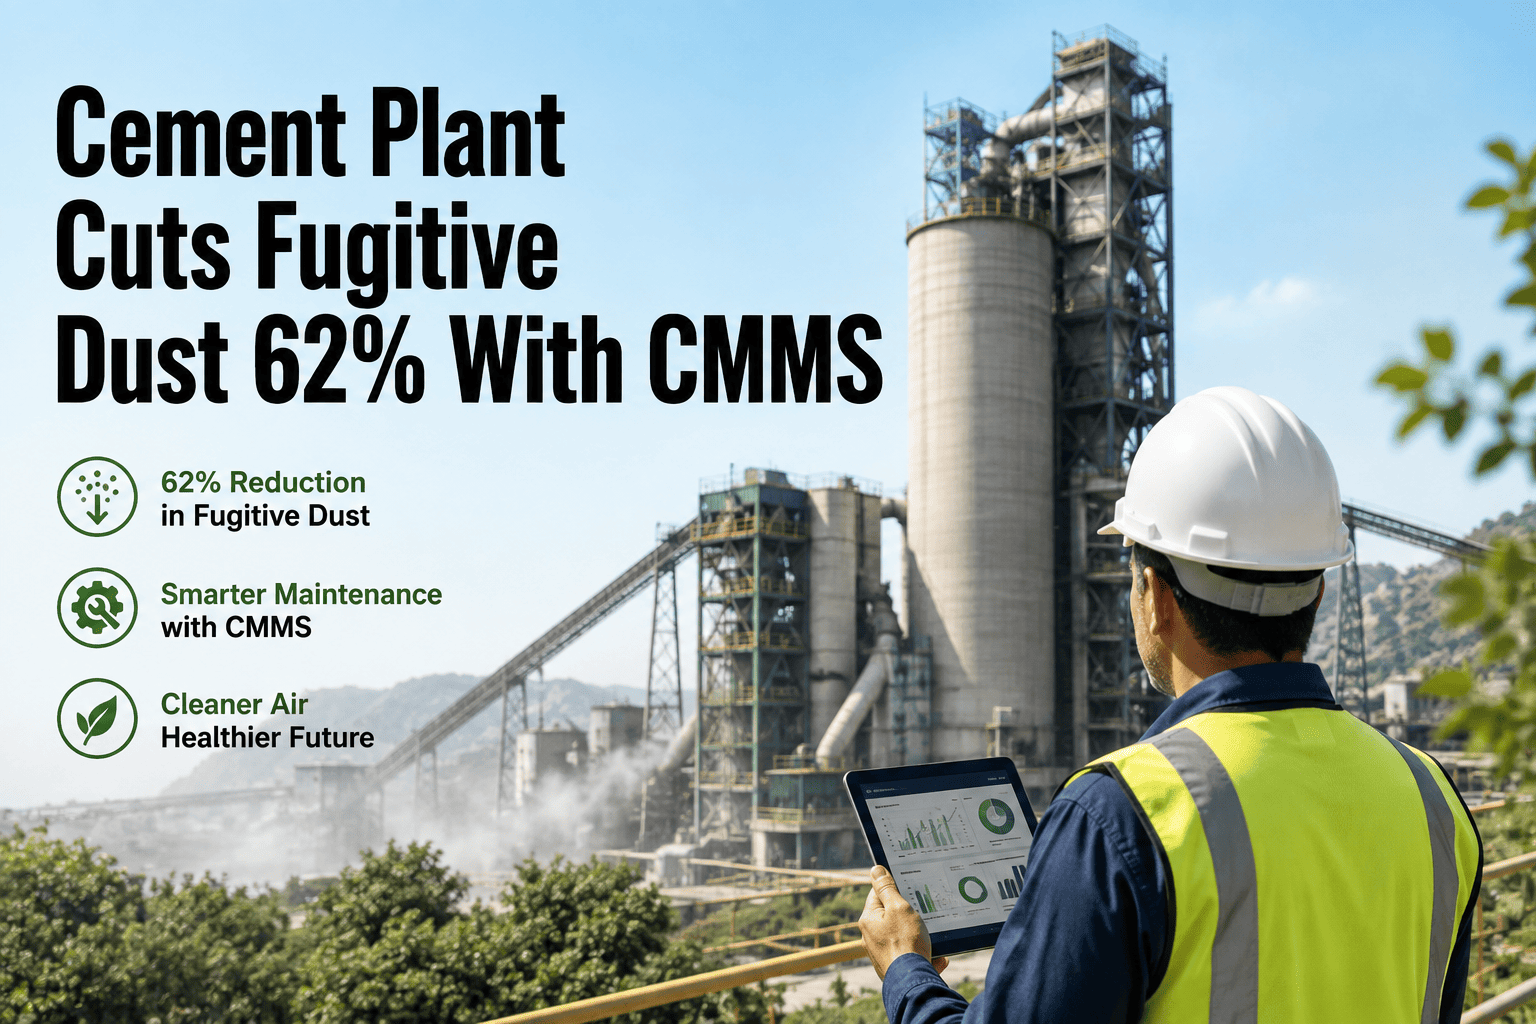
A 1.5-million-tonne cement plant running two finish-mill circuits was burning power it didn't need to. Grinding alone accounts for nearly 40% of total plant electricity, and when liners wear, media grading drifts, and separator settings go unchecked, specific energy consumption creeps upward one kilowatt-hour at a time until nobody remembers what the mills were originally designed to do. This case study walks through how the plant's maintenance team cut combined mill SEC by 7 kWh/t across both circuits, turned vibration and differential pressure readings into scheduled work orders, and converted that improvement into a documented $840,000 annual saving without adding headcount or replacing a single mill. If your grinding circuit is running warmer than its design spec, see how Oxmaint's CMMS tracks mill SEC down to the asset level.
Case Study · Cement Mill Energy Optimization
How One Cement Plant Cut Mill SEC By 7 kWh/t — And Saved $840K a Year
Two finish-mill circuits, one CMMS rollout, six months from baseline audit to stabilized results. Here is exactly what changed and what it was worth.
The Baseline
What 39 kWh/t Was Actually Costing The Plant
Grinding is the single largest electrical load in a cement plant, and it is also the load that drifts the most quietly. Before the rollout, both mill circuits were logging combined average specific energy consumption well above their design point — and nobody had a clean number tying that gap to a maintenance cause.
39 kWh/t
Combined average SEC across both mill circuits before the rollout began
1.5 MTPA
Combined finish-grind output across Circuit A and Circuit B
$0.08/kWh
Industrial power tariff used for every savings calculation in this case study
32 kWh/t
Stabilized combined SEC after six months — the plant's new operating baseline
Root Cause Breakdown
Where The Extra 7 kWh/t Was Actually Hiding
The audit phase tied every kilowatt-hour of excess consumption to a specific, addressable condition. None of it required new mills — all of it required a maintenance program that could see the drift before throughput dropped.
Worn liners and grinding media
42%
Separator efficiency loss
27%
Undetected bearing wear
18%
Feed moisture and operating variance
13%
A worn fourth-chamber liner alone can push specific consumption up 6% before throughput visibly drops — which is why the plant's old inspection routine, a monthly walkthrough with no asset-linked history, never caught the trend until it was significant.
The Rollout
Six Months, Five Phases, One SEC Number Tracked Throughout
01
Baseline Audit — Month 1
Vibration survey on all mill and separator bearings, liner profile measurement against design-deviation limits, and per-shift SEC logging for both circuits to establish a defensible starting number.
02
CMMS Deployment — Month 2
Asset-linked preventive maintenance schedules built for every mill, separator, and bearing housing across both circuits, replacing a paper-based inspection sheet with mobile digital forms.
03
Condition Monitoring — Months 3 to 4
Vibration and differential pressure sensors tied directly to CMMS thresholds, automatically generating work orders the moment a reading crossed the design-deviation line instead of waiting for the next scheduled walkthrough.
04
Liner and Media Optimization — Month 5
Liners and grinding media replaced at the design-deviation limit rather than the condemn limit, restoring specific power closer to original design values on both circuits in the same maintenance window.
05
Dashboard Stabilization — Month 6
Combined SEC held at 32 kWh/t for three consecutive months, with per-asset energy history now feeding directly into the plant's ISO 50001 documentation trail.
Every kilowatt-hour above design spec is a maintenance question waiting to be asked. Oxmaint's asset-linked PM scheduling, vibration-triggered work orders, and SEC dashboards give your grinding circuit the same visibility this plant used to find 7 kWh/t.
The Results
Before and After, Circuit By Circuit
Circuit A
7 kWh/t reduction
Circuit B
7 kWh/t reduction
Savings Breakdown
What 7 kWh/t Was Worth, In Dollars
| Circuit |
Annual Output |
SEC Before |
SEC After |
kWh/t Saved |
Annual Savings |
| Circuit A |
750,000 t |
40 kWh/t |
33 kWh/t |
7 kWh/t |
$420,000 |
| Circuit B |
750,000 t |
38 kWh/t |
31 kWh/t |
7 kWh/t |
$420,000 |
| Combined Plant |
1,500,000 t |
39 kWh/t |
32 kWh/t |
7 kWh/t |
$840,000 |
Reliability Team Takeaway
The plant's reliability team summarized the project simply: the mills were never broken, they were just drifting, and nothing in the old inspection routine was built to catch a drift. Once vibration and differential pressure data fed directly into scheduled work orders instead of sitting in a spreadsheet, the SEC number stopped climbing on its own — and started moving in the other direction every time a liner or media batch was replaced on schedule instead of on guesswork.
Frequently Asked Questions
How did the plant confirm the 7 kWh/t reduction was real and not seasonal variance?
SEC was logged per shift for three months before and after the rollout, using the same 90-day rolling average method recommended for internal benchmarking.
Oxmaint's SEC dashboards hold that rolling comparison automatically so the number can't drift unnoticed again.
Did the plant need to replace any grinding mills to get this result?
No. Both circuits kept their existing mills. The improvement came entirely from liner and media replacement at the correct interval, separator tuning, and bearing maintenance triggered before failure — not capital equipment changes.
How long before a similar plant would see measurable SEC improvement?
This rollout showed early movement by month three, once condition monitoring began generating threshold-triggered work orders, with full stabilization at month six.
Book a demo to map a realistic timeline against your own circuit data.
Does this approach also help with ISO 50001 or EU CBAM documentation?
Yes. Asset-linked energy tracking produces the same improvement trail that ISO 50001 recertification and EU CBAM embedded-carbon reporting require, since every kWh/t figure is tied to a specific asset and dated maintenance record rather than a manually updated spreadsheet.
Is 7 kWh/t a typical result, or was this plant an outlier?
Published industry surveys put technical electricity savings potential at roughly 12% for domestic best practice, which lines up closely with this plant's improvement from 39 to 32 kWh/t. Results vary by starting condition and mill type.
Your Grinding Circuit Probably Has Its Own 7 kWh/t
Every plant running mills without asset-linked condition monitoring is carrying some version of this gap. Oxmaint's CMMS turns vibration data, differential pressure readings, and liner wear into scheduled work orders and a live SEC dashboard — so the drift gets caught in month three, not year three.