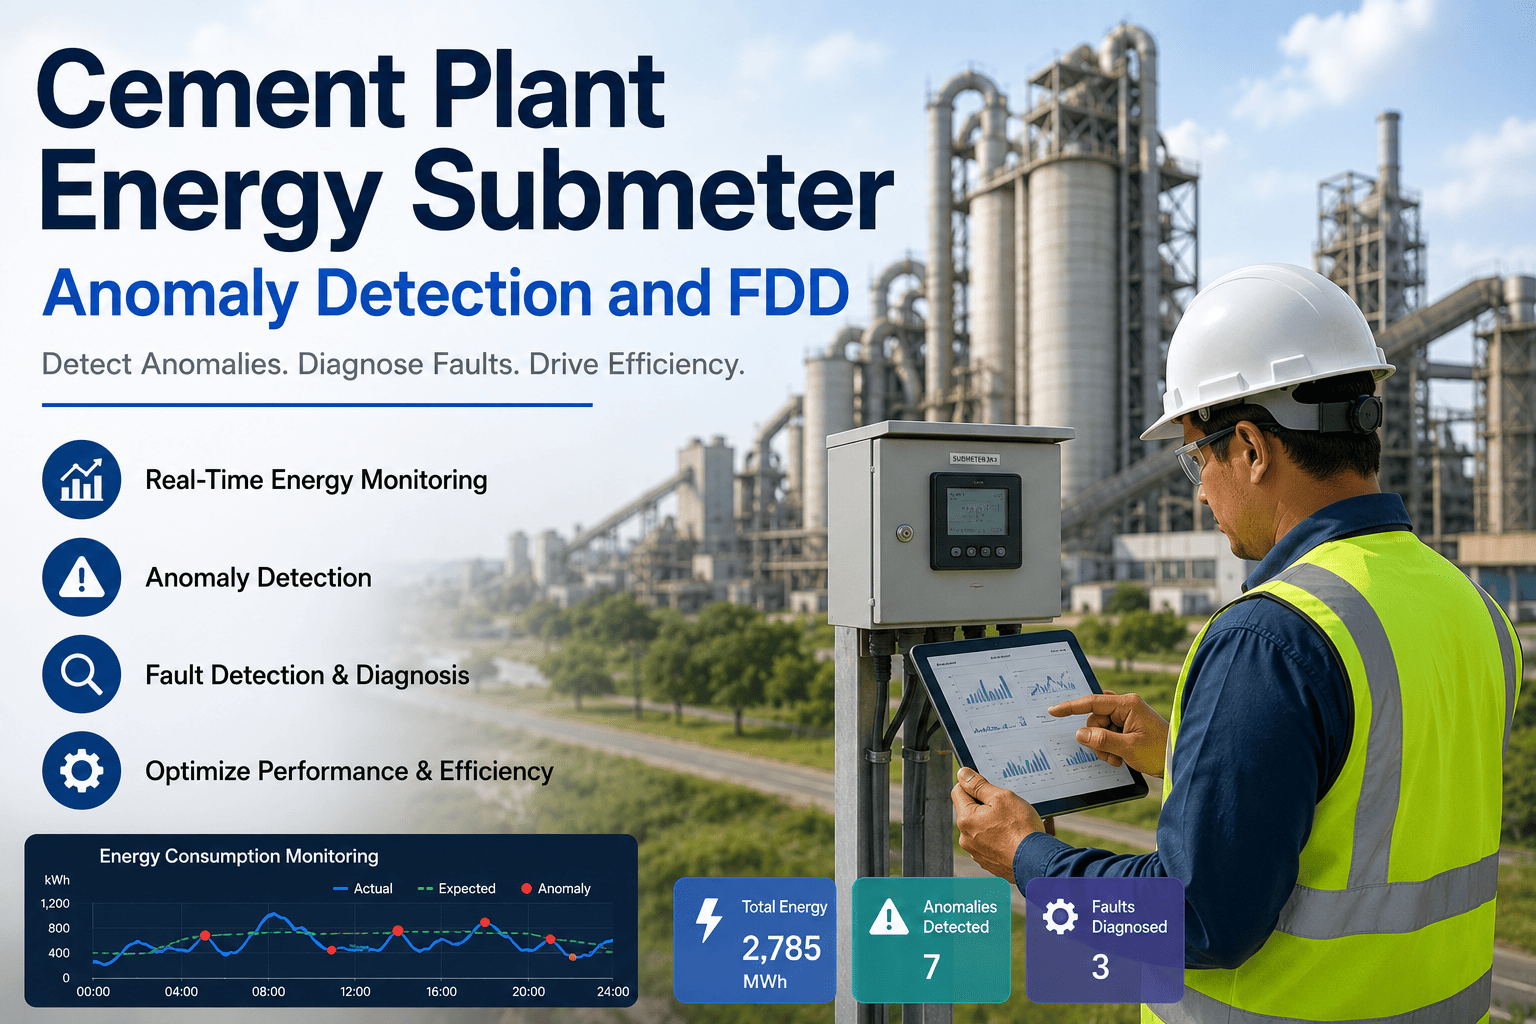
A 3,000 TPD cement plant in South Asia was running its kiln within what every quarterly energy audit considered acceptable limits — specific heat consumption of 3,410 MJ per tonne of clinker, well inside the 3,500 MJ benchmark. Nobody flagged it. Nobody investigated it. The plant was quietly wasting $1.9 million per year in fuel through five simultaneous energy waste streams that no manual audit, no SCADA dashboard, and no monthly energy report had ever detected — because every loss was individually small, slowly progressive, and masked by normal production variability. AI found all five in 37 days. Book a demo to see how Oxmaint connects AI energy anomaly detection directly to CMMS work orders — so every hidden waste stream becomes a documented corrective action.
Plant Profile — Case Study
Plant Type
Integrated dry-process cement, 5-stage preheater precalciner
Production Capacity
3,000 TPD clinker / 1.1 MTPA cement
Baseline Energy Performance
3,410 MJ/t clinker — within industry average, not flagged
Annual Fuel Spend
$11.4 million (coal + petcoke blend at $5.2/GJ)
Previous Monitoring
Monthly energy reports, quarterly audits, operator rounds
AI Deployment
Oxmaint + AI energy baseline monitoring via OPC-UA to existing DCS
The Investigation
Five Hidden Waste Streams — Found in 37 Days
When AI builds a dynamic energy baseline — one that accounts for raw meal chemistry, ambient temperature, fuel calorific value, and production rate simultaneously — it creates a reference point no human audit can match. Static benchmarks compare you to an industry average. AI compares you to yourself under identical conditions. That gap is where hidden waste lives. Here is what the AI found, in the order it found it.
Day 4
Critical Find
False Air Infiltration — Preheater Tower Joint
AI detected a persistent 3.2% deviation in preheater exit oxygen readings versus the expected O₂ profile for the current fuel-air ratio. The gap was consistent across all production rates and all shifts — ruling out operator variation. Root cause: a worn expansion joint at Stage 3 of the preheater tower was drawing in cold ambient air, forcing the kiln to burn additional fuel to compensate for diluted combustion atmosphere.
Energy waste: 18 kcal/kg clinker
Annual cost: $380,000/yr
CMMS action: Work order auto-generated Day 4 — expansion joint inspection, seal replacement, gasket torque verification
Day 11
High Impact
Degrading Burner Tip — Kiln Main Burner
AI flagged a slow drift in burning zone temperature variance — the standard deviation of temperature readings was rising over a 9-day period while average temperature held stable. This pattern is specific to burner tip erosion: the flame shape degrades gradually, creating hot and cold zones across the clinker bed. The result is overburning in hot zones (wasting fuel) and underburning in cold zones (requiring additional fuel input to maintain free lime targets).
Energy waste: 12 kcal/kg clinker
Annual cost: $255,000/yr
CMMS action: Work order Day 11 — burner tip inspection, coal pipe alignment check, primary air channel cleaning
Day 19
High Impact
Fouled Cyclone — Stage 4 Preheater
Pressure drop monitoring across preheater cyclone stages showed a progressive increase in Stage 4 differential pressure over 12 days — 14 mbar above the AI baseline for the current feed rate. This indicated partial blockage from clinker dust build-up inside the cyclone cone, reducing heat exchange efficiency and increasing gas bypass. The waste was invisible in monthly energy reports because production rate variation masked the pressure trend.
Energy waste: 10 kcal/kg clinker
Annual cost: $212,000/yr
CMMS action: Work order Day 19 — cyclone inspection port cleaning, cone scraper deployment, pressure drop re-baseline after cleaning
Day 28
Moderate
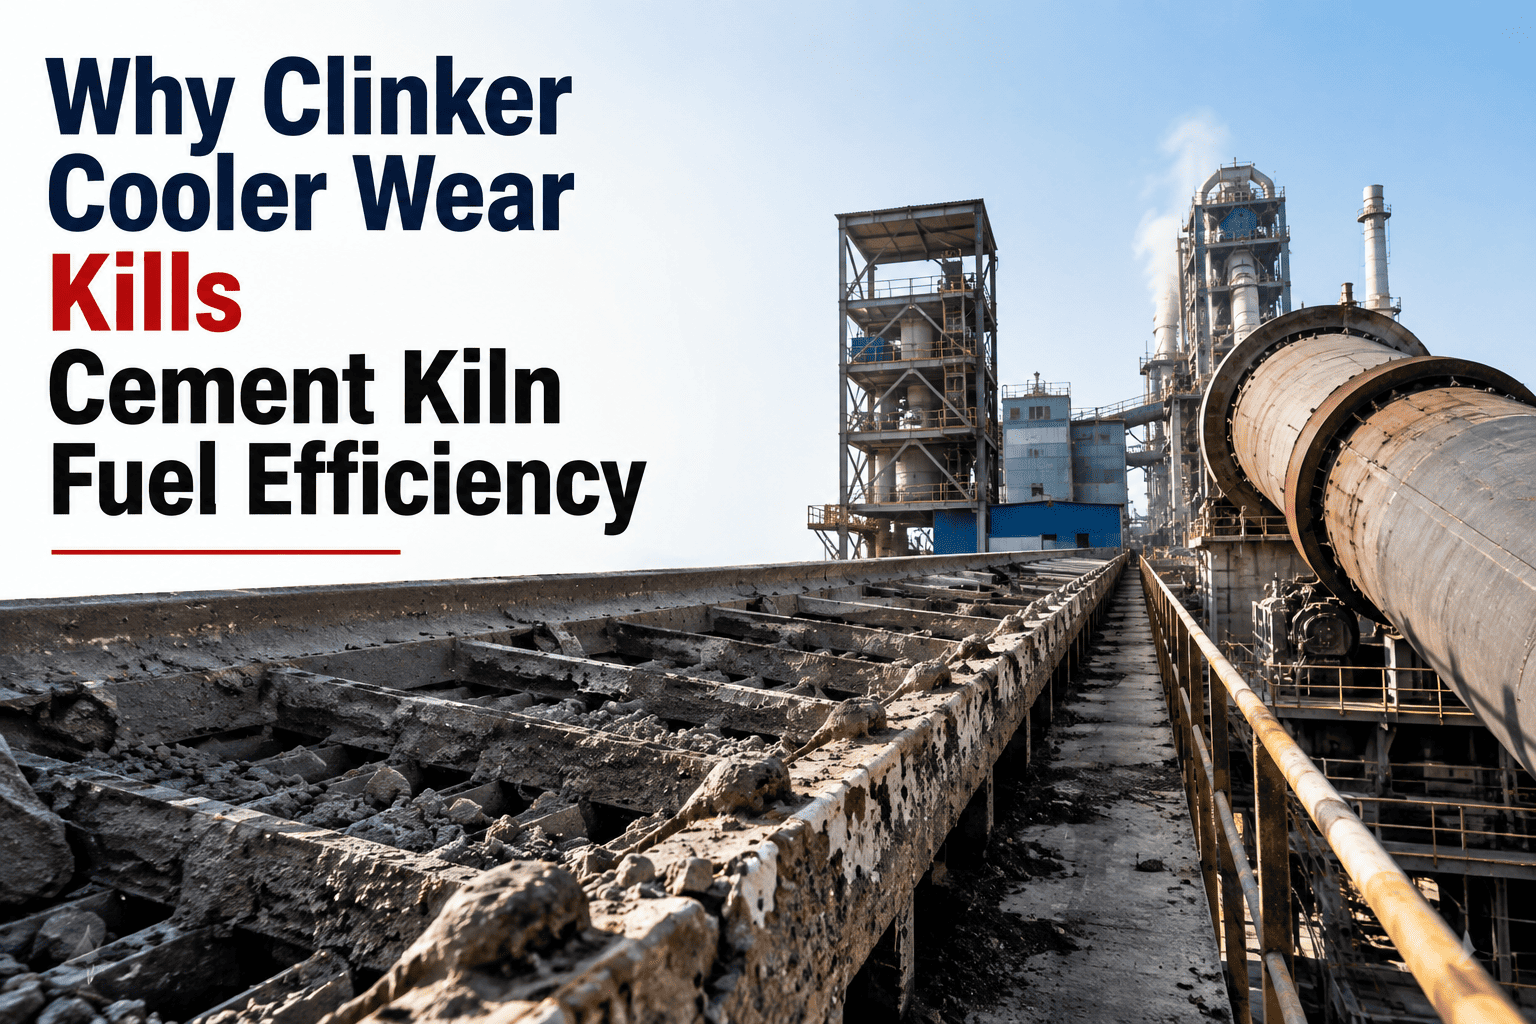
Cooler Heat Recovery Loss — Grate Plate Damage
AI detected that the specific heat consumption of the kiln system was consistently 8 kcal/kg above baseline during afternoon production windows — but only when clinker output exceeded 135 t/hr. Cross-correlating cooler grate speed, undergrate pressure, and tertiary air temperature, AI identified uneven air distribution across the cooler width — the signature of damaged grate plates creating "red rivers" of poorly cooled clinker and reducing heat recovery back into the kiln system.
Energy waste: 8 kcal/kg clinker (load-dependent)
Annual cost: $170,000/yr
CMMS action: Work order Day 28 — grate plate inspection at next planned stop, undergrate pressure re-mapping, cooler fan damper re-calibration
Day 37
Moderate
Drifted Fuel Flow Sensor — Coal Dosing System
AI compared actual burning zone heat release against expected values from the coal dosing setpoint — and found a persistent 4.2% over-dosing pattern that was not reflected in kiln temperature. The dosing flow meter had drifted out of calibration, systematically over-reporting coal feed. Operators trusted the meter reading; the kiln was receiving more fuel than the setpoint commanded. This had been running for an estimated 8 weeks before detection.
Energy waste: 4.2% systematic over-dosing
Annual cost: $478,000/yr
CMMS action: Work order Day 37 — coal flow meter calibration check, reference measurement cross-validation, calibration certificate updated
Total Energy Waste Found and Recovered — 37 Days
52 kcal/kg
Total thermal waste eliminated across 5 fault streams
$1.49M
Annual fuel savings recovered — 13% of total fuel spend
3,410→3,106
MJ/t clinker — specific heat consumption after corrections
5 work orders
Auto-generated by Oxmaint — each closed with documented corrective action
Is Your Plant Passing Energy Audits While Wasting Millions?
The waste streams in this case study were all within "acceptable" benchmark ranges on monthly reports. AI found them by comparing the plant to itself under identical conditions — not to an industry average. Oxmaint connects that AI detection directly to CMMS work order generation, so every anomaly becomes a corrective action, not just an alert.
Why Manual Audits Miss These Losses
The Structural Reason Traditional Energy Monitoring Cannot Find Hidden Waste
Each of the five waste streams found in this case study had been present for weeks or months before AI deployment. Monthly reports, quarterly audits, and experienced operators had all missed them. The reason is not incompetence — it is a fundamental limitation of how manual energy monitoring works versus how AI dynamic baseline detection works.
Compares this month's SHC to last month's average — production rate changes mask efficiency drift
Compares current SHC to expected SHC for this exact production rate, fuel mix, and raw material chemistry simultaneously
Samples energy data once per month — a slow 8-week drift in a coal flow meter reads as normal variation
Monitors energy KPIs at sub-minute intervals — a 4.2% systematic over-dosing is statistically flagged within days
Cannot isolate which equipment is causing a rise in SHC — reports a number, not a root cause
Cross-correlates preheater pressures, burning zone temperature variance, cooler grate patterns, and oxygen profiles to identify specific fault location
Requires a known threshold breach to trigger investigation — losses within "acceptable" range go uninvestigated
Detects deviations from plant-specific optimal — finds waste that is inside industry benchmarks but above the plant's own achievable baseline
Findings require a human analyst to translate into a maintenance action — average lag: 3–6 weeks from detection to work order
Anomaly detection automatically triggers CMMS work order with fault location, recommended action, and energy impact attached — lag: under 90 seconds
Waste Streams by Type
The Six Categories of Hidden Energy Waste in Cement Kilns
The five waste streams in this case study fall across four of the six categories of hidden thermal energy loss that AI monitoring is designed to detect. Each category has a different sensor signature, a different rate of progression, and a different maintenance response. Understanding which type your plant is currently accumulating is the first step to recovering it.
"The coal flow meter finding alone justified everything. We had been over-dosing coal for 8 weeks and had no idea — every daily report showed normal parameters because operators were reading the meter, not measuring actual combustion output. The moment AI flagged the systematic gap between setpoint and modeled heat release, we ran the cross-check. The meter was out by 4.2%. That single calibration work order recovered $478,000 per year. The other four findings paid for the system four times over."
Chief Energy Officer
South Asian Integrated Cement Plant — 3,000 TPD Capacity
Frequently Asked Questions
AI Energy Waste Detection and CMMS Integration: Common Questions
How does AI build a dynamic energy baseline — and why is it more useful than an industry benchmark?
An industry benchmark compares your plant's specific heat consumption to an average across many plants with different raw materials, equipment ages, and production mixes. A dynamic AI baseline compares your plant to itself — building a real-time model of expected energy consumption given your current raw meal chemistry, fuel calorific value, ambient temperature, and production rate. A 3,400 MJ/t SHC might be efficient at one set of conditions and wasteful at another. AI sees that difference; an industry benchmark cannot. Deviations from the dynamic baseline — not from an average — are what expose hidden waste.
Start a free Oxmaint trial to connect your DCS historian and establish your plant's first dynamic energy baseline in under 48 hours.
What sensors does AI need to detect the waste streams identified in this case study?
All five waste streams in this case study were detected using sensors that are already standard in most modern dry-process cement plants: preheater stage temperatures and pressure drops, burning zone temperature pyrometers, kiln outlet O₂ and CO analyzers, fuel feed flow meters, cooler undergrate pressure sensors, and kiln shell temperature scanners. No additional sensor installation was required. AI reads this data at sub-minute intervals through the existing DCS OPC-UA interface — the intelligence is in the correlation models, not the sensors.
Book a demo to verify which of your current sensor feeds are sufficient for AI energy waste detection across your kiln configuration.
How does Oxmaint convert an energy anomaly into a work order — and what information does the technician receive?
When AI detects a deviation from the energy baseline that matches a known fault signature — false air, burner degradation, cyclone fouling, instrument drift — it sends a structured alert to Oxmaint via API. Oxmaint auto-creates a work order containing the fault type, the affected equipment, the deviation magnitude, the estimated energy cost per day, the sensor evidence behind the detection, and the recommended maintenance action scope. The technician receives all of this on their mobile device before they leave the control room. No manual step exists between the AI finding the waste and the crew getting the assignment.
Start a free trial to walk through the energy anomaly to work order pipeline for your CMMS configuration.
How long does it take for AI to find the first energy waste stream after deployment?
In this case study, the first anomaly was flagged on Day 4. In practice, the detection timeline depends on how many active waste streams are already present and how far above the dynamic baseline they are running. Plants with significant pre-existing inefficiencies typically see first detections within 7–14 days as the baseline calibrates to normal operating conditions. Plants closer to their theoretical efficiency often take 30–60 days as the models achieve sufficient precision to detect smaller deviations. Most plants identify their first corrective maintenance action within the first month of deployment.
Book a demo to understand what detection timeline is realistic for your specific plant configuration and current energy performance.
What documentation does Oxmaint produce for energy savings reporting to management and auditors?
Oxmaint maintains a complete audit trail for every energy anomaly — detection timestamp, sensor evidence, baseline deviation magnitude, work order generated, technician assigned, corrective action taken, and post-correction energy KPI verification. For management reporting, Oxmaint produces energy savings summaries showing before and after SHC, monetary value of waste recovered, and the maintenance actions that delivered each saving. For external auditors and ESG reporting, the full documentation trail is exportable in under 4 hours for a full year of operations, with each finding linked to its corrective maintenance record.
Start a free trial to see the energy savings reporting dashboard and audit export format for your plant's compliance requirements.
Your Plant Is Passing Every Audit. That Doesn't Mean It's Not Wasting Millions.
The five waste streams in this case study were all inside acceptable benchmark ranges on monthly reports. They cost $1.49 million per year and went undetected for months. Oxmaint connects AI dynamic energy baseline monitoring to automatic CMMS work order generation — so every hidden waste stream your plant is currently running becomes a found, fixed, and documented corrective action.