Cement manufacturing accounts for roughly 8% of global CO2 emissions — and regulators, investors, and buyers are demanding credible, documented decarbonization action plans. But building a roadmap that is both technically grounded in GCCA Net-Zero pillars and operationally executable across AFR substitution, clinker factor reduction, and CCUS readiness is not straightforward. This page gives cement plant engineers and sustainability managers a structured decarbonization roadmap framework — including phase-by-phase milestones, KPI targets, audit checkpoints, and the CMMS evidence layer that turns plans into verifiable progress. Use it as a starting template and adapt it to your plant's baseline. For teams ready to connect roadmap milestones directly to maintenance workflows and asset data, start free with OxMaint or book a demo to see how the platform supports ESG evidence capture at the plant level.
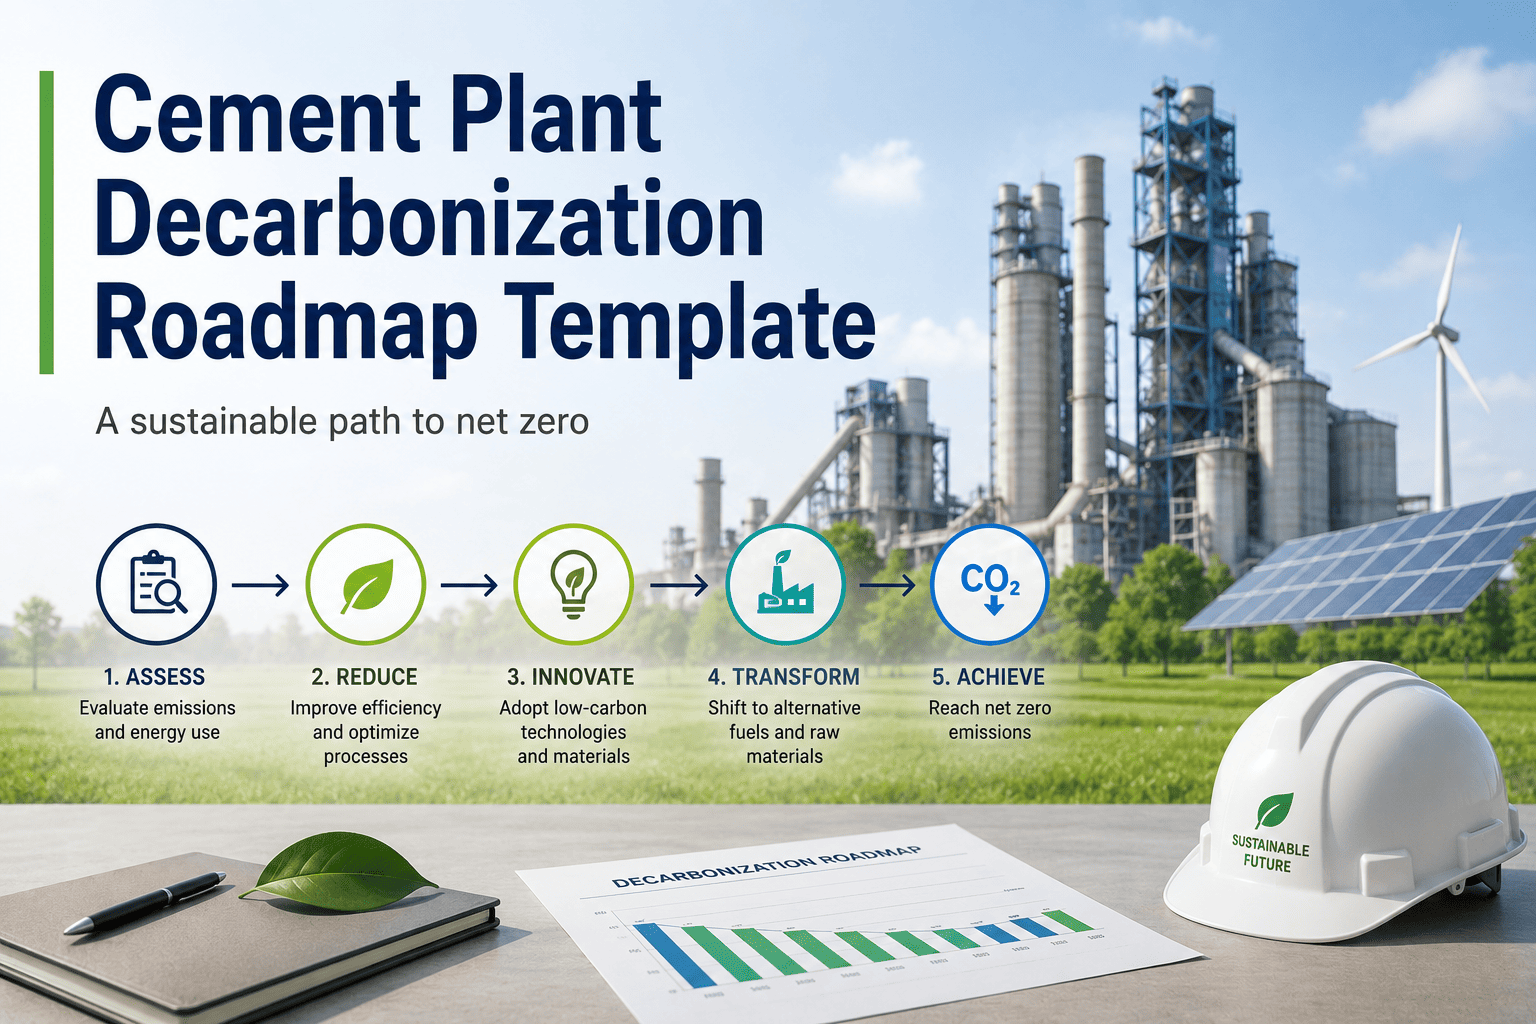
The Cement Plant Decarbonization Roadmap Built Around GCCA Net-Zero Pillars
A phase-structured, audit-ready decarbonization framework covering AFR ramp-up, clinker factor reduction, thermal efficiency, and CCUS readiness — with CMMS evidence checkpoints at every stage.
The 5 GCCA Net-Zero Pillars — What Each Requires at Plant Level
The Global Cement and Concrete Association's Net-Zero Concrete Roadmap defines five interlocking decarbonization levers. Effective plant-level roadmaps must map actions, investments, and KPIs to each pillar — not treat them in isolation.
Clinker Efficiency
Reduce the clinker-to-cement ratio (clinker factor) by substituting supplementary cementitious materials — fly ash, GGBS, calcined clay. Target: clinker factor below 0.65 by 2030.
Thermal Efficiency
Optimize kiln and preheater thermal performance to reduce specific heat consumption. Improved heat recovery, reduced false air ingress, and better insulation are key levers.
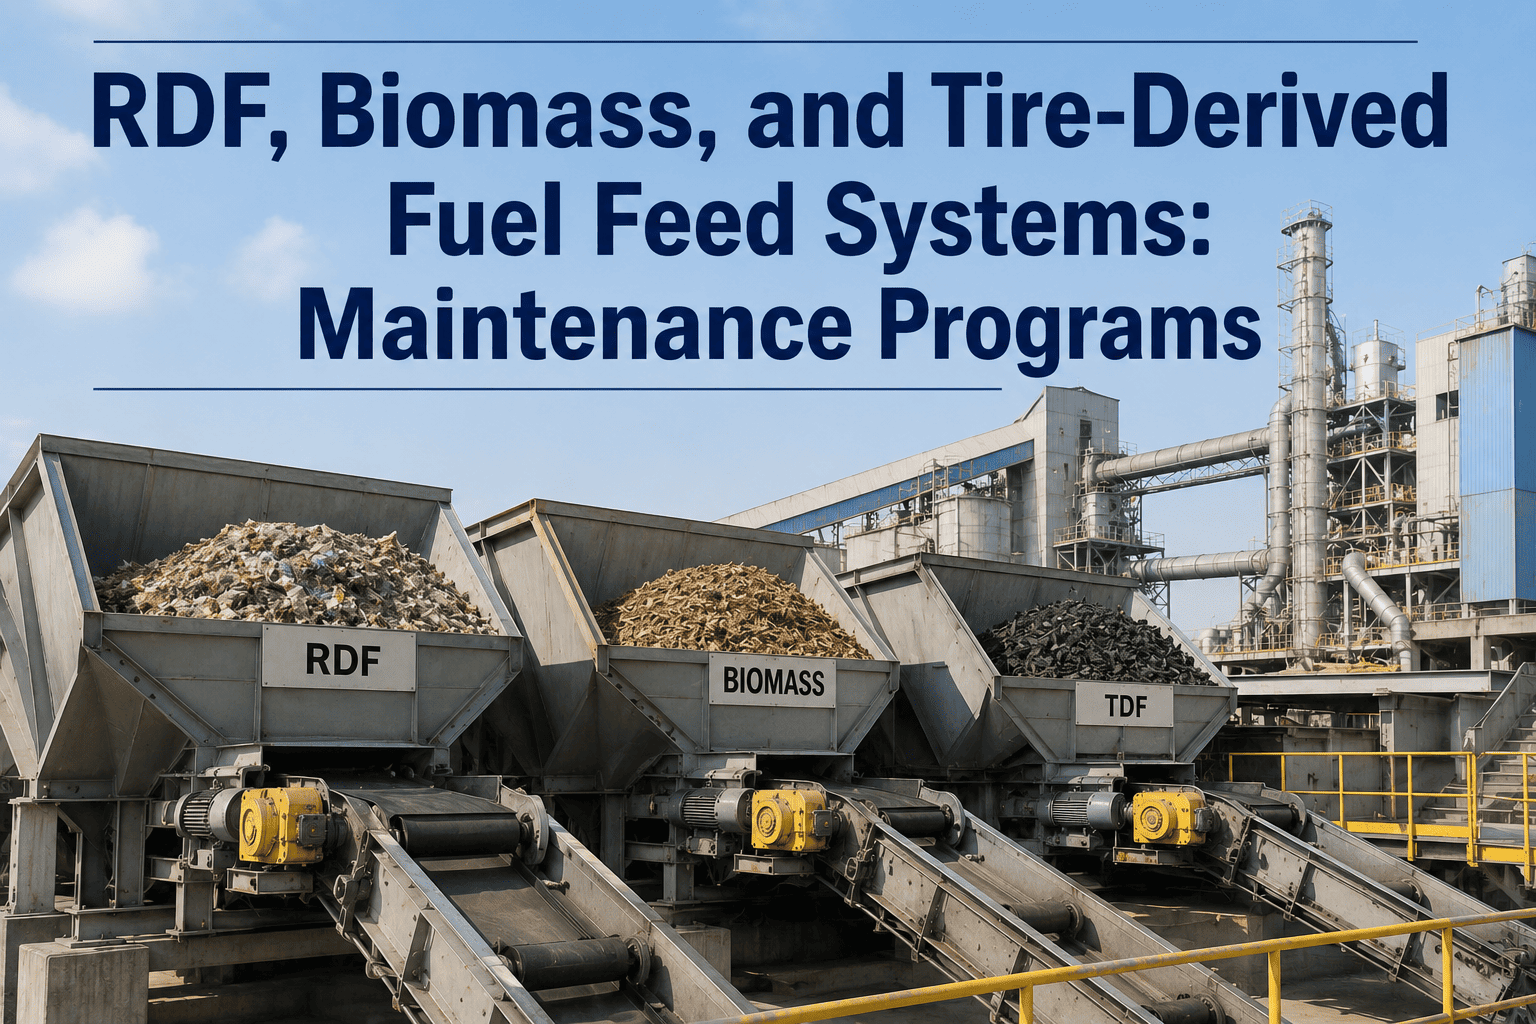
Alternative Fuels (AFR)
Increase thermal substitution rate of alternative fuels — waste-derived fuels, biomass, municipal solid waste — to displace fossil fuel consumption in the kiln. Target: TSR above 40% by 2030.
Green Energy
Shift electrical consumption to renewable energy sources — on-site solar/wind, PPAs, or green tariffs. Electrification of auxiliary processes supports Scope 2 reduction targets.
Carbon Capture (CCUS)
Deploy carbon capture, utilisation, and storage to address process emissions from calcination — the 60% of cement emissions that cannot be eliminated through efficiency or fuel switching alone.
Your Plant Decarbonization Roadmap: 4 Phases to Net-Zero
Use this phase structure as your template baseline. Each phase has defined scope, milestone targets, CMMS evidence requirements, and an audit checkpoint — making the roadmap verifiable at every stage.
- Establish CO2 baseline per tonne of clinker and cement (Scope 1, 2, 3)
- Audit all fuel consumption records and clinker factor by product grade
- Map all kiln system energy loss points via thermal imaging survey
- Register all relevant assets in CMMS with energy consumption parameters
- Set plant-specific 2030 and 2050 CO2 reduction targets
Energy meter readings by asset, fuel purchase records linked to work orders, kiln run-hour logs, thermal imaging reports attached to kiln asset record.
- Ramp AFR thermal substitution rate — target TSR 20% by end of phase
- Introduce SCMs to reduce clinker factor below 0.72
- Optimize preheater cyclone operation to reduce heat loss
- Implement preventive maintenance schedules for kiln drive, cooler fans, and grate
- Install sub-metering on major electrical consumers (mills, fans, compressors)
AFR tonnage records per work order, SCM dosing logs by batch, preheater inspection reports, PM completion rates by asset class, sub-meter data linked to equipment assets.
- Scale AFR to 40%+ TSR — including biomass and refuse-derived fuel streams
- Deploy LC3 or other novel clinker substitutes to push clinker factor below 0.65
- Transition on-site electricity to renewable PPA or direct generation
- Begin CCUS feasibility study and site-specific pre-FEED assessment
- Implement condition-based monitoring on critical rotating equipment
AFR stream classification records, renewable energy delivery confirmations linked to meter assets, condition monitoring sensor logs, CCUS feasibility study reference in asset planning module.
- Commission CCUS system — targeting 60-90% capture rate on kiln stack
- Achieve full renewable electricity coverage across all plant loads
- Reach clinker factor target of 0.60 or below for all cement product lines
- Establish continuous CO2 intensity reporting to GCCA and investor frameworks
- Integrate remaining Scope 3 value chain emissions into annual CMMS audit
CCUS system capture rate logs by operating period, annual CO2 intensity report from CMMS data, third-party verification report stored against plant asset record, Scope 3 supplier data imports.
Ready to Turn This Roadmap Into a Live Execution Plan?
OxMaint connects each roadmap milestone to asset-level maintenance data, energy records, and inspection evidence — so your decarbonization plan is backed by verifiable operational data, not just spreadsheets.
The 8 KPIs Every Cement Decarbonization Roadmap Must Track
These are the minimum measurable indicators required to demonstrate credible progress against GCCA pillars and satisfy ESG reporting frameworks including CDP, GRI, and TCFD.
| KPI | Unit | 2025 Benchmark | 2030 Target | GCCA Pillar | Data Source |
|---|---|---|---|---|---|
| Clinker Factor | t clinker / t cement | 0.76 global avg | Below 0.65 | Clinker | Production records, CMMS batch log |
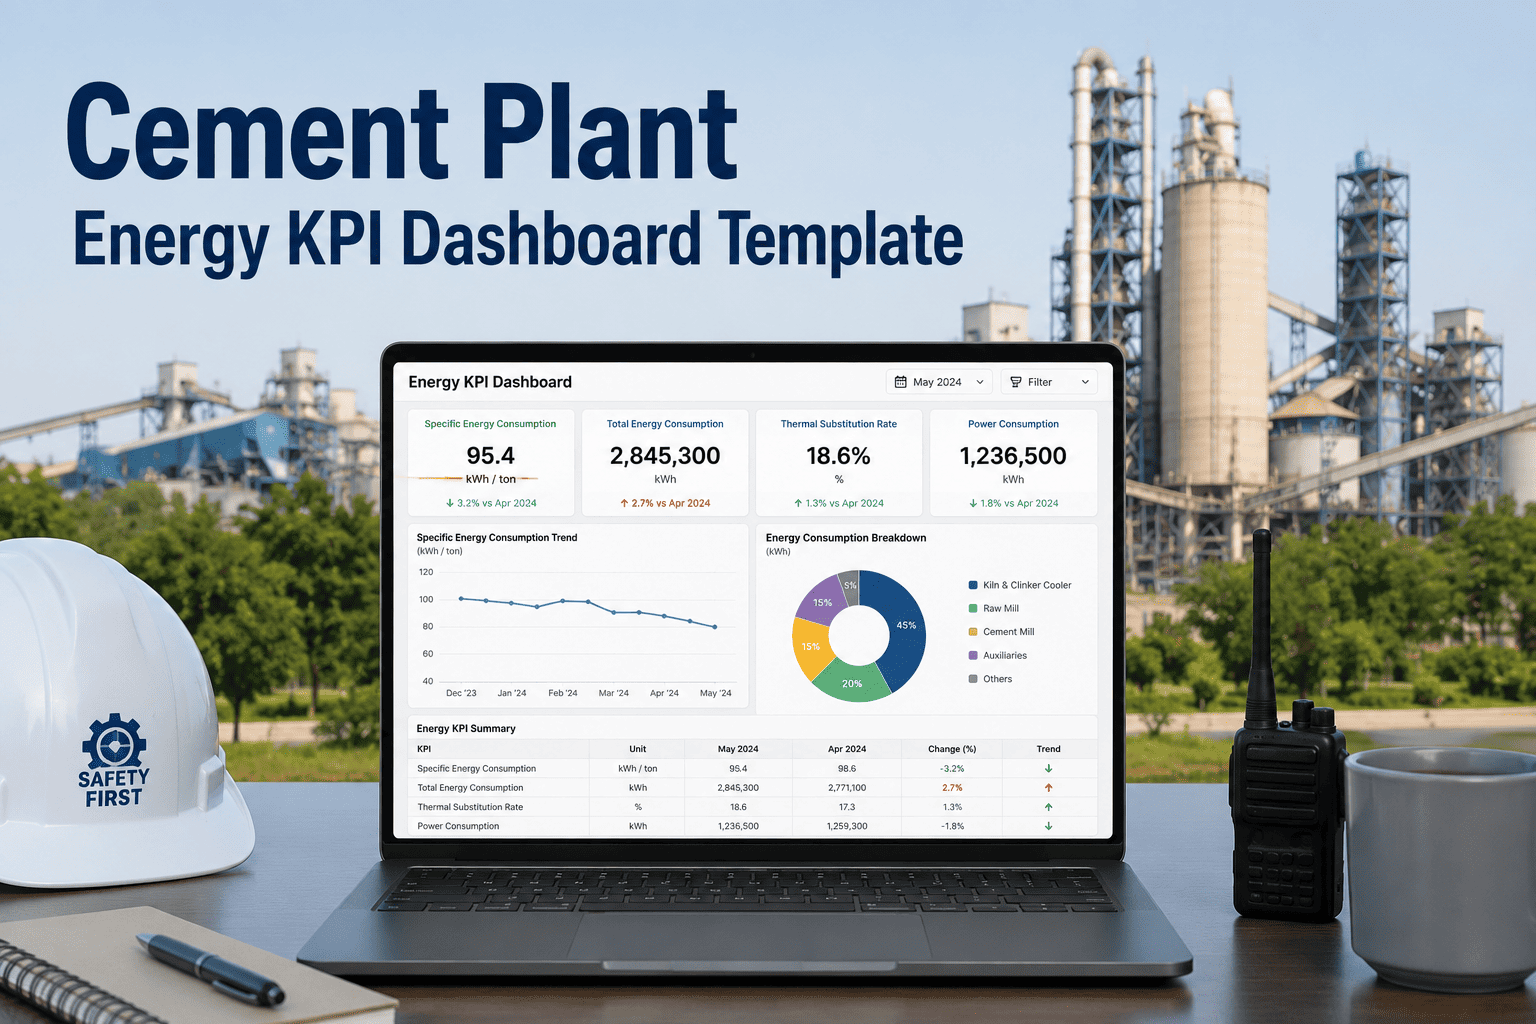
| Specific Heat Consumption | kcal / kg clinker | 800-900 typical | Below 750 | Thermal | Kiln energy meter, CMMS asset log |
| Thermal Substitution Rate | % of thermal energy | ~18% global avg | Above 40% | AFR | Fuel purchase records, weigh feeder data |
| Specific CO2 Emissions | kg CO2 / t cement | ~620 kg global avg | Below 400 | All Pillars | Calculated from fuel + clinker data |
| Renewable Electricity Share | % of total electricity | Varies by plant | Above 60% | Green Energy | Energy billing, PPA confirmation records |
| CO2 Captured by CCUS | kg CO2 / t clinker | 0 (pre-deployment) | Feasibility complete | CCUS | CCUS system metering, CMMS asset record |
| Specific Electrical Energy | kWh / t cement | 90-110 kWh typical | Below 85 kWh | Thermal | Sub-metering by asset, CMMS energy module |
| PM Compliance Rate | % on-time PMs completed | Varies by plant | Above 92% | Thermal | CMMS work order completion data |
Why Roadmap Plans Fail Audits — and How CMMS Evidence Fixes It
The most common failure in cement decarbonization audits is not a missing action — it is a missing evidence trail. Regulatory auditors and ESG verifiers do not accept management summaries. They require traceable, timestamped operational records.
Fuel Consumption Records
Every kiln fuel delivery and consumption event linked to a dated work order — AFR stream type, calorific value, and tonnage recorded per operating period.
Equipment Health Logs
Kiln, cooler, and mill maintenance history tied to energy performance data — demonstrating that thermal losses were addressed and not merely reported.
Inspection Reports
Pre-planned and condition-based inspection reports stored against each asset — refractory surveys, kiln shell scans, and heat exchanger audits all timestamped.
PM Completion History
Preventive maintenance completion rates per asset class — demonstrating that equipment was maintained to operating efficiency, not just nominally scheduled.
Energy Meter Integration
Sub-meter readings imported directly from energy management systems and stored against individual asset records — enabling per-equipment energy intensity calculation.
Third-Party Audit Trail
All external auditor reports, verification statements, and GCCA submission records stored in the plant's CMMS document library — accessible for regulatory review with full version history.
AFR Ramp-Up: What a Credible Roadmap Looks Like Year by Year
Alternative fuels are the fastest-payback decarbonization lever available to most cement plants — but TSR growth must be supported by infrastructure investment, quality control systems, and maintenance evidence to satisfy both operational and audit requirements.
Cement Decarbonization Roadmap — What Engineers Ask
What is the difference between a GCCA roadmap and a plant-level decarbonization plan?
The GCCA roadmap defines sector-wide 2030 and 2050 targets across the five pillars — it is an industry framework. A plant-level plan translates those targets into site-specific milestones, investments, and measurable KPIs based on your plant's current baseline, fuel mix, and clinker factor. This template provides the structure for that translation. Start free with OxMaint to build your plant's asset-backed evidence layer.
Which CCUS technology is most applicable to cement plants in the 2030-2040 window?
Post-combustion amine scrubbing is currently the most commercially advanced option for cement kilns, with several full-scale projects underway in Europe. Oxyfuel combustion and direct separation capture are also at advanced pilot stage. The pre-FEED phase in this roadmap is designed to keep technology selection open while securing site readiness — capture infrastructure, CO2 transport pathway, and storage agreements.
How does clinker factor reduction interact with product quality compliance?
Clinker factor reduction must be managed within EN 197 or ASTM C595 product standard limits. Each supplementary cementitious material — fly ash, GGBS, calcined clay — has a defined substitution ceiling per cement class. The roadmap's clinker factor milestones must therefore be cross-referenced against your product portfolio and customer specifications. Book a demo to see how OxMaint links quality records to decarbonization KPI tracking.
What CMMS data is required for a CDP or GRI climate disclosure aligned with this roadmap?
CDP and GRI require traceable, verifiable emissions data with documented calculation methodology. This means fuel consumption records by type with calorific values, electricity consumption by source, and production output data — all timestamped and linked to specific reporting periods. A CMMS that integrates energy metering with work order and asset data can generate this evidence automatically rather than through manual spreadsheet compilation.
How long does it take to implement OxMaint for cement plant decarbonization tracking?
Most cement plants complete initial asset registry setup and KPI dashboard configuration within two to three weeks. Integration with existing SCADA or ERP systems for energy data ingestion typically adds another one to two weeks. From go-live, your decarbonization KPIs — clinker factor, TSR, specific heat, PM compliance — are tracked and audit-ready from the first full reporting period.
A Roadmap Without Operational Evidence Will Not Pass an Audit
OxMaint connects your cement plant's decarbonization milestones to asset maintenance records, energy consumption data, and inspection histories — giving your GCCA roadmap the verifiable operational backbone that ESG auditors and regulators require. Setup takes under three weeks. Your first compliant KPI report is ready from day one of operation.