Energy is the single largest operating cost in cement manufacturing — typically representing 30–40% of total production cost — yet most cement plants still track energy performance through fragmented spreadsheets, monthly utility bills, and informal kiln operator log entries that cannot be compared across shifts, production runs, or calendar periods. A structured energy KPI dashboard template changes this by centralising the five metrics that matter most — specific energy consumption (SEC), kWh per tonne of clinker, alternative fuel rate (AFR), clinker factor, and CO2 intensity — into a single, CMMS-driven performance record that operations leadership and sustainability teams can read in the same view. When energy data is structured from the point of measurement, it becomes actionable: high-SEC shifts are identifiable, kiln efficiency degradation is visible week by week, and capital investment decisions for energy improvement have a data foundation. To see how OxMaint connects energy KPI tracking to maintenance records and CMMS-driven evidence, start a free trial or book a 30-minute demo.
Energy Management · ISO 50001 · Free Template
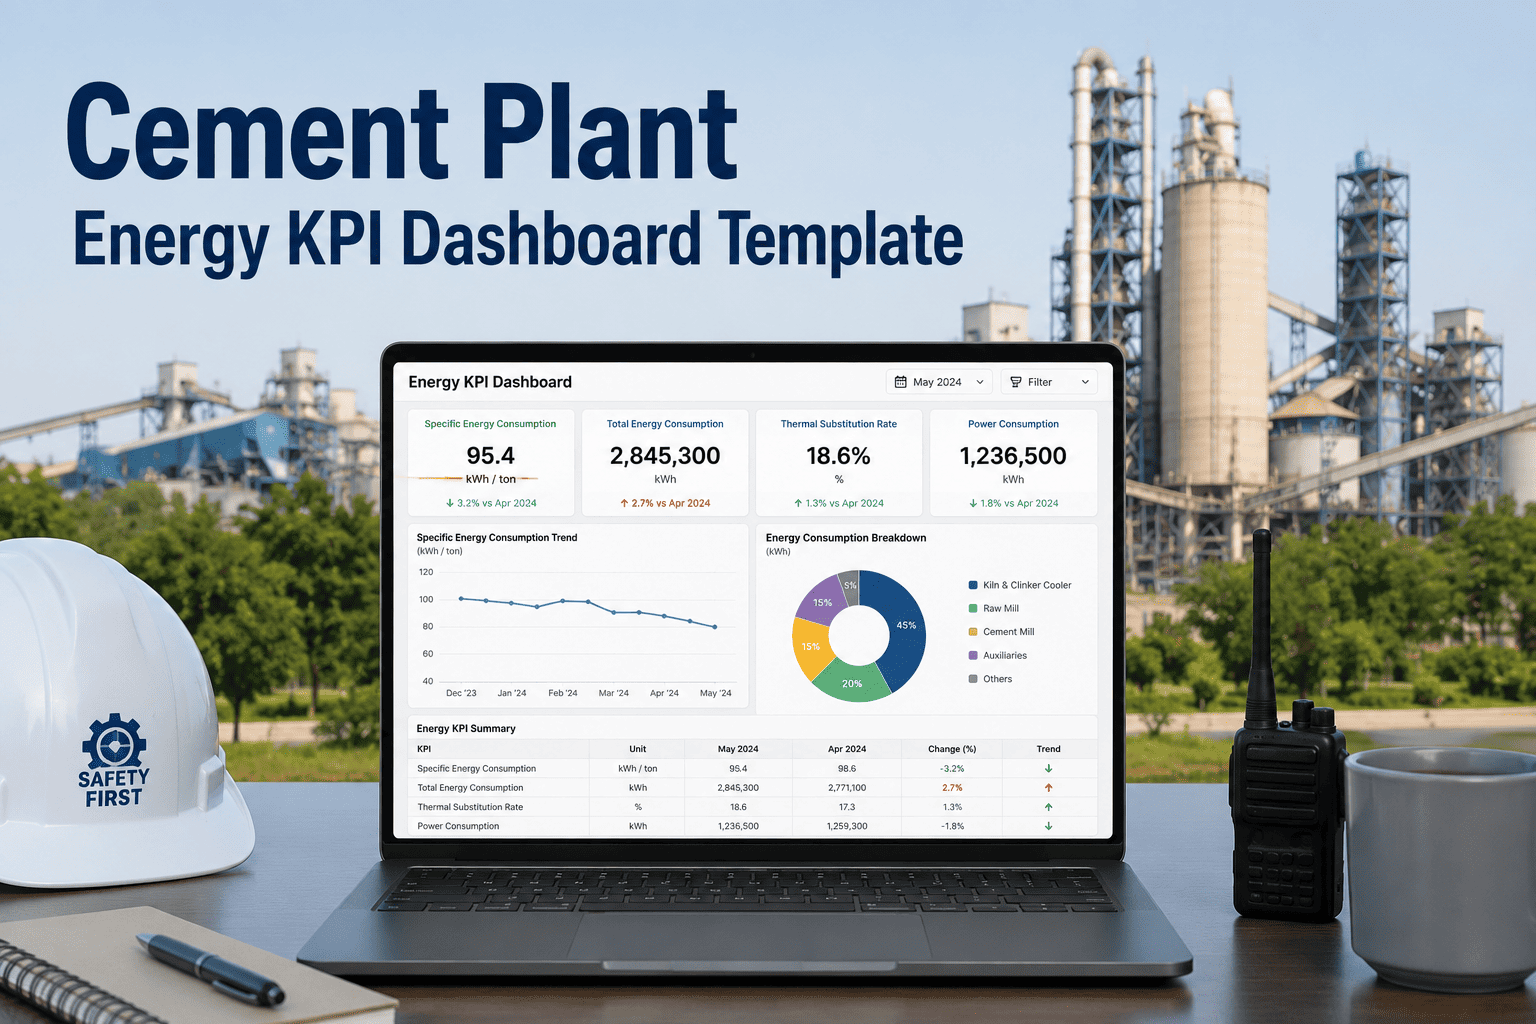
Cement Plant Energy KPI Dashboard Template
A complete energy KPI dashboard template covering specific energy consumption, kWh/tonne clinker, AFR rate, clinker factor, and CO2 intensity — structured for ISO 50001 compliance, shift-level granularity, and CMMS-linked evidence trails.
World Best Practice
2.9 GJ/t clinker
Dry process with 5-stage preheater
Global Average
3.5 GJ/t clinker
Mixed technology fleet
Cement CO2 Share
8% global
Of total CO2 emissions worldwide
SEC Improvement Potential
10–20%
Through operational optimisation alone
The Five Core KPIs
Five Energy KPIs Every Cement Plant Dashboard Must Track
KPI 1
Specific Energy Consumption (SEC)
GJ per tonne of cementitious product
The master energy efficiency metric. SEC captures total thermal and electrical energy consumed per tonne of finished product, allowing comparison across kiln types, production rates, and time periods. A rising SEC trend is the earliest indicator of kiln refractory degradation, raw meal moisture increase, or fuel quality change.
World Best Practice
2.9 GJ/t
KPI 2
Electrical Energy Intensity (kWh/t)
kWh per tonne of cement
Tracks electrical consumption independently from thermal energy. Critical for identifying grinding circuit inefficiency, compressed air leaks, and auxiliary equipment energy waste. Grinding mills typically account for 60–70% of total electrical consumption — this KPI isolates their contribution from plant-wide totals.
Vertical Roller Mill
90–110 kWh/t
KPI 3
Alternative Fuel Rate (AFR)
% of total thermal energy from alternative fuels
Measures the substitution of fossil fuels (coal, petcoke) with alternative fuels (RDF, TDF, biomass, waste solvents). AFR rate is one of the primary GCCA Net-Zero pathway levers. Plants targeting 2050 net-zero typically aim for 60–80%+ AFR. Tracking AFR per kiln per day is essential for both financial and sustainability reporting.
European Average 2024
~46%
KPI 4
Clinker Factor
Clinker-to-cement ratio (tonne/tonne)
The clinker factor captures how much clinker (the energy-intensive component) is used per tonne of finished cement. A lower clinker factor means more SCM substitution (fly ash, slag, limestone), directly reducing both thermal energy consumption and CO2 intensity. Tracking clinker factor alongside product quality is essential — lower factor only counts if cement meets specification.
KPI 5
Net CO2 Intensity
kg CO2 per tonne of cementitious product
The primary sustainability performance indicator — combining the effect of clinker factor, AFR rate, thermal efficiency, and green electricity use into a single intensity metric. Net CO2 is used for CBAM compliance, ESG reporting, CDP disclosures, and increasingly for customer sustainability requirements in green procurement specifications.
Global Average 2022
590 kg/t
GCCA Net-Zero 2050 Target
~100 kg/t
Dashboard Structure
Dashboard Template Structure — Three Reporting Tiers
The dashboard template is structured across three reporting tiers that align to different organisational audiences — shift operators, plant management, and corporate sustainability teams — each with the granularity and format appropriate to their decision-making timeframe.
Audience: Kiln operators, shift supervisors
Kiln heat consumption (kcal/kg clinker) — per 8-hr shift
Specific electrical consumption — kWh/t clinker — per 8-hr shift
AFR rate — % thermal substitution — per 8-hr shift
Clinker production rate (t/hr) vs. target
Specific fuel consumption deviation from baseline
Purpose: Real-time operational control — flag shifts where SEC is above moving average baseline
Audience: Plant manager, production manager, energy manager
Weekly SEC (GJ/t) vs. monthly rolling average and year-to-date baseline
kWh/t cement — by production unit (raw mill, kiln, finish mill)
AFR rate — weekly average — vs. monthly target and annual plan
Clinker factor — weekly average — vs. quality specification
CO2 intensity (kg/t) — weekly — vs. annual sustainability target
Top 3 energy deviations with root cause attribution
Purpose: Performance management — identify trends, approve corrective actions, review against targets
Audience: CEO, CFO, sustainability director, board
Monthly and year-to-date SEC vs. annual budget and 2030 roadmap milestone
Cumulative AFR rate — vs. GCCA pathway targets
Net CO2 intensity — monthly — with CBAM-relevant calculation methodology
Clinker factor trend — vs. product mix and SCM availability
Energy cost per tonne — electricity and fuel cost impact of SEC changes
Carbon credit/CBAM liability estimate based on current performance
Purpose: Strategic oversight — ESG disclosure, CBAM compliance, capital investment justification
OxMaint Energy KPI Integration
Link Energy KPIs to Maintenance Records — Find the Efficiency Leak
A rising SEC often has a maintenance root cause — worn refractory, degraded kiln seals, inefficient grinding media, compressed air leaks. OxMaint connects energy KPI deviations to the asset maintenance history that caused them, so your energy manager and maintenance team are working from the same data. When SEC rises above the weekly baseline, OxMaint shows which assets have open work orders, overdue maintenance, or recent failures — making root cause identification hours faster.
$4–6/t
Cost impact of 10% SEC increase at $80/t fuel cost
30–40%
Of total cement plant production cost is energy
CBAM 2026
EU Carbon Border Adjustment Mechanism — full compliance required
ISO 50001 Compliance
How This Dashboard Template Supports ISO 50001 Compliance
ISO 50001 requires organisations to establish, implement, maintain, and improve an energy management system. The energy KPI dashboard template provides the documented evidence structure required for ISO 50001 Clause 6.6 (energy performance indicators) and Clause 9.1 (monitoring, measurement, analysis, and evaluation).
ISO 50001 Clause
Requirement
How This Template Meets It
6.4 — Energy Review
Identify significant energy uses and their performance
Tier 2 dashboard identifies significant energy uses by production unit with SEC contribution analysis
6.6 — EnPIs
Define and track energy performance indicators
Five core KPIs (SEC, kWh/t, AFR, clinker factor, CO2 intensity) are pre-defined with units, frequency, and baselines
6.3 — Energy Baseline
Establish energy performance baselines
Template includes rolling 12-month baseline calculation and period-over-period deviation tracking for each KPI
9.1 — Monitoring
Monitor, measure, analyse and evaluate energy performance
Shift, weekly, and monthly tier structure provides the monitoring frequency, analysis trail, and documented evaluation required by Clause 9.1
10.2 — Nonconformity
Document and address energy performance deviations
Dashboard flags deviations above defined thresholds; CMMS integration via OxMaint generates corrective action work orders automatically
Common Questions
Energy KPI Dashboard — What Cement Plant Teams Ask
What data sources does this dashboard template pull from?
The template is designed to receive data from three primary sources: the plant DCS/historian (kiln heat consumption, production rate, electrical metering), the fuel management system (fuel types consumed per shift with calorific value), and the quality laboratory (clinker factor, cement production volumes). OxMaint connects to all three via API and consolidates into the KPI structure.
Start a free trial to explore the data integration options.
How is AFR rate calculated and which fuel types count toward it?
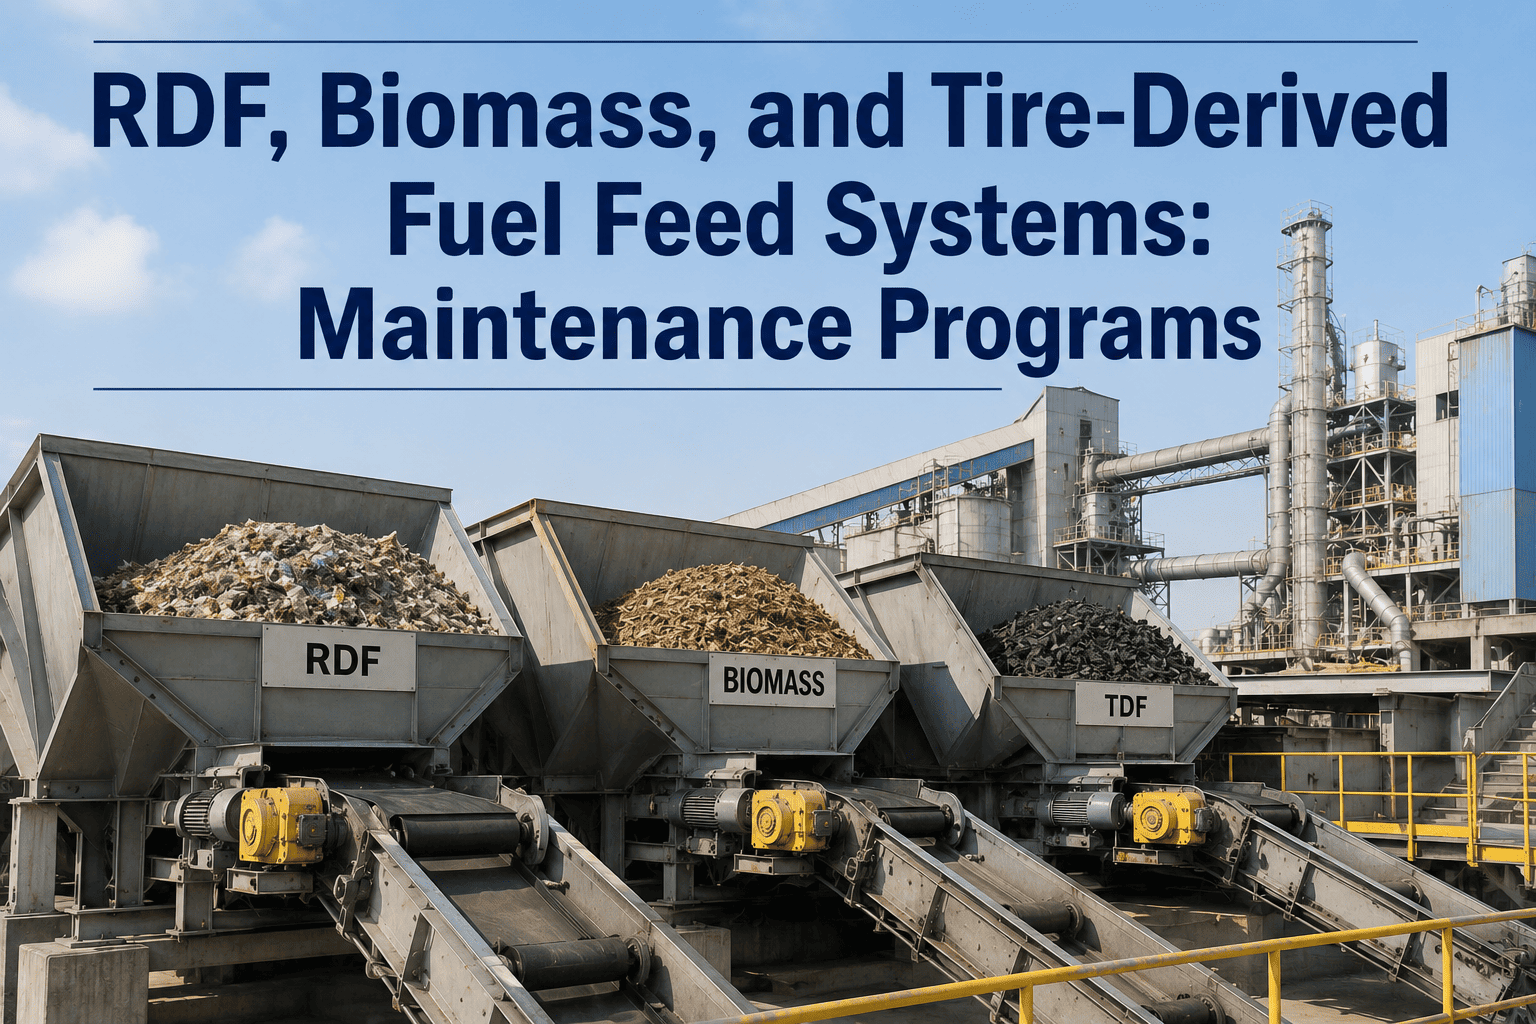
AFR rate is calculated as: (thermal energy from alternative fuels / total thermal energy input) x 100%. Alternative fuels include all non-fossil fuel substitutes — RDF (refuse-derived fuel), TDF (tyre-derived fuel), biomass, waste solvents, sewage sludge, and industrial waste streams. Natural gas used as a process supplement does not count as AFR. Each fuel type must be tracked with its calorific value and biogenic carbon fraction for accurate CO2 intensity calculation under GCCA protocol.
What is the difference between net and gross CO2 intensity in cement?
Gross CO2 intensity includes all CO2 from both process emissions (calcination of limestone) and fuel combustion. Net CO2 intensity subtracts the biogenic carbon content of biomass and biogenic waste fuels used as AFR, since these emissions are considered carbon-neutral under IPCC accounting. For CBAM compliance purposes, the gross scope 1 intensity is used, not the net biogenic-adjusted figure. The dashboard template includes fields for both calculations.
How does OxMaint connect energy KPIs to maintenance actions?
When OxMaint detects an energy KPI deviation — SEC above the weekly rolling baseline by more than a defined threshold — it generates a maintenance investigation work order linked to the assets most associated with that KPI. For example, a rising kiln heat consumption triggers a work order review of kiln shell radiation losses, refractory condition records, and kiln seal maintenance history.
Book a demo to see how the energy-maintenance linkage works in practice.
ISO 50001 · CBAM Ready · CMMS-Linked · Free Template
Deploy Your Cement Plant Energy KPI Dashboard in OxMaint Today
Connect your DCS, fuel management system, and quality laboratory data to OxMaint's energy KPI dashboard — and link every energy deviation to the maintenance record that caused it. From shift-level SEC tracking to monthly CO2 intensity reports for ESG disclosure, OxMaint provides the data structure and audit trail your energy and sustainability teams need.