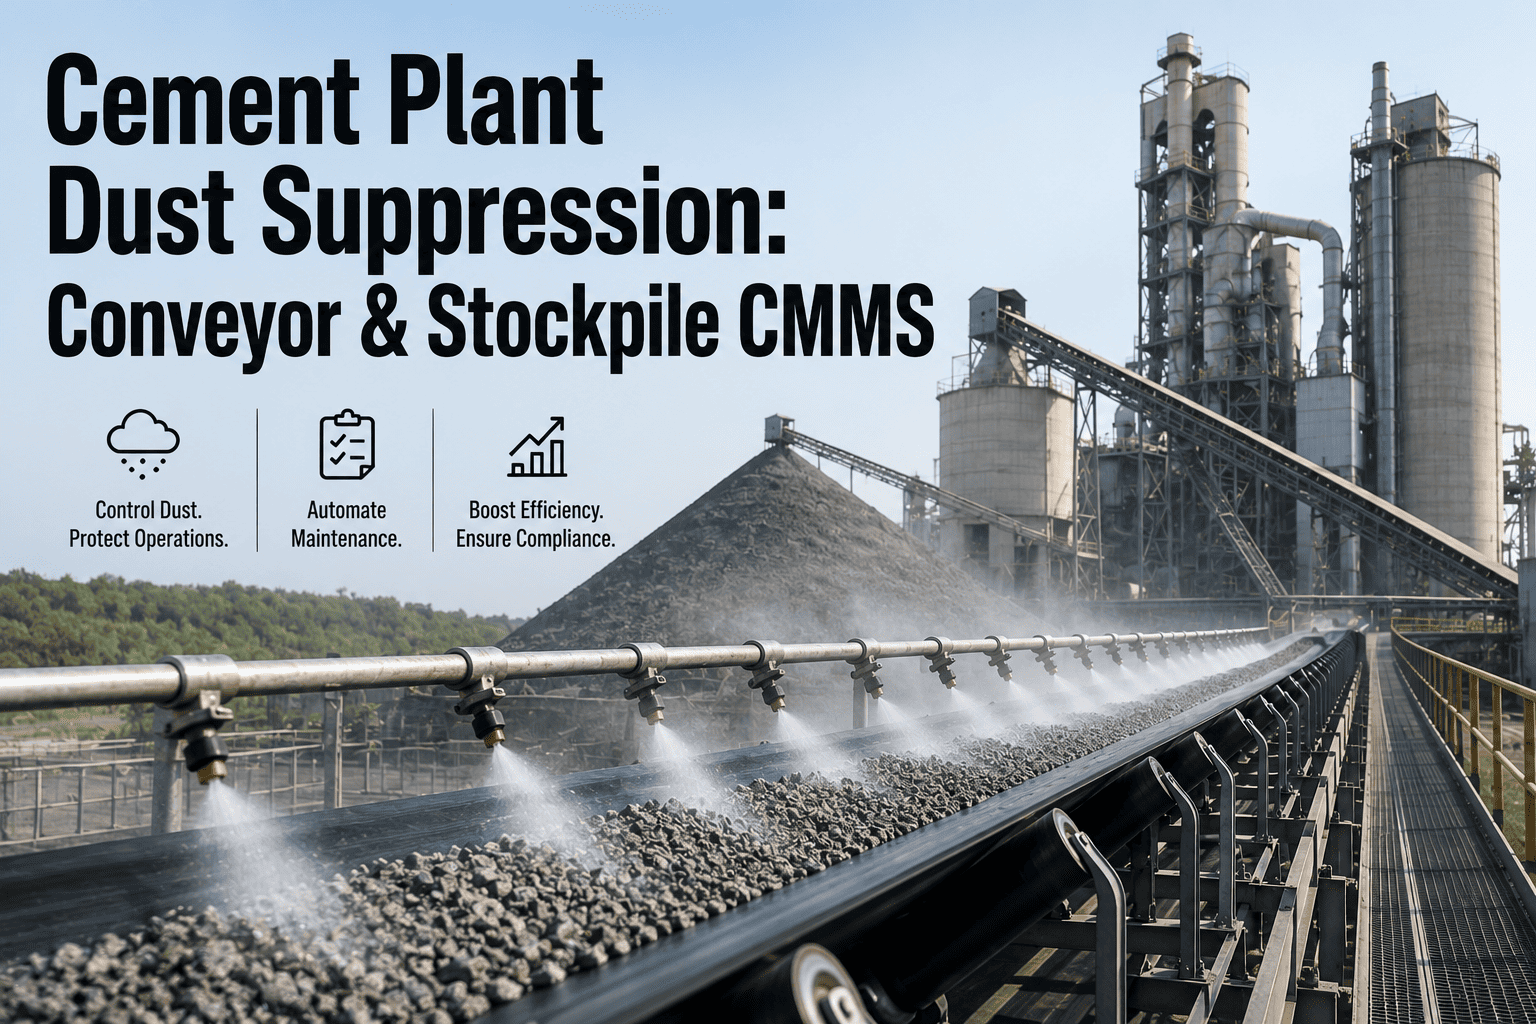
Cement plants lose an estimated 3-8% of finished clinker to fugitive dust at transfer points, stockpiles, and conveyor discharge chutes — material that escapes the process, fouls motors, and travels beyond the fenceline into nearby neighborhoods. A well-engineered dust suppression maintenance program targets four control points: water spray headers, chemical dosing skids, wind barrier fences, and the nozzle arrays that atomize both. When these systems drift out of spec, PM2.5 readings climb, permit deviations stack up, and community complaints follow within weeks. Building that program inside a CMMS — with triggered PMs, meter-based nozzle inspections, and chemical-consumption tracking — is the difference between a quiet quarter and a regulatory notice. Start with a Start Free Trial to map every suppression asset before the next inspection cycle.
Is your suppression program actually catching dust — or just spraying water?
Fugitive cement dust at conveyors and stockpiles costs plants $18K-$60K per year in lost material, permit deviations, and community complaints. This guide maps the PM triggers, nozzle intervals, and chemical dosing checks a CMMS should automate across every transfer point.
Where cement dust actually escapes — and what each asset needs
A 5,000 TPD cement plant runs roughly 60-90 active suppression assets across conveyor belts, transfer towers, and stockpile perimeters. Each one fails differently.
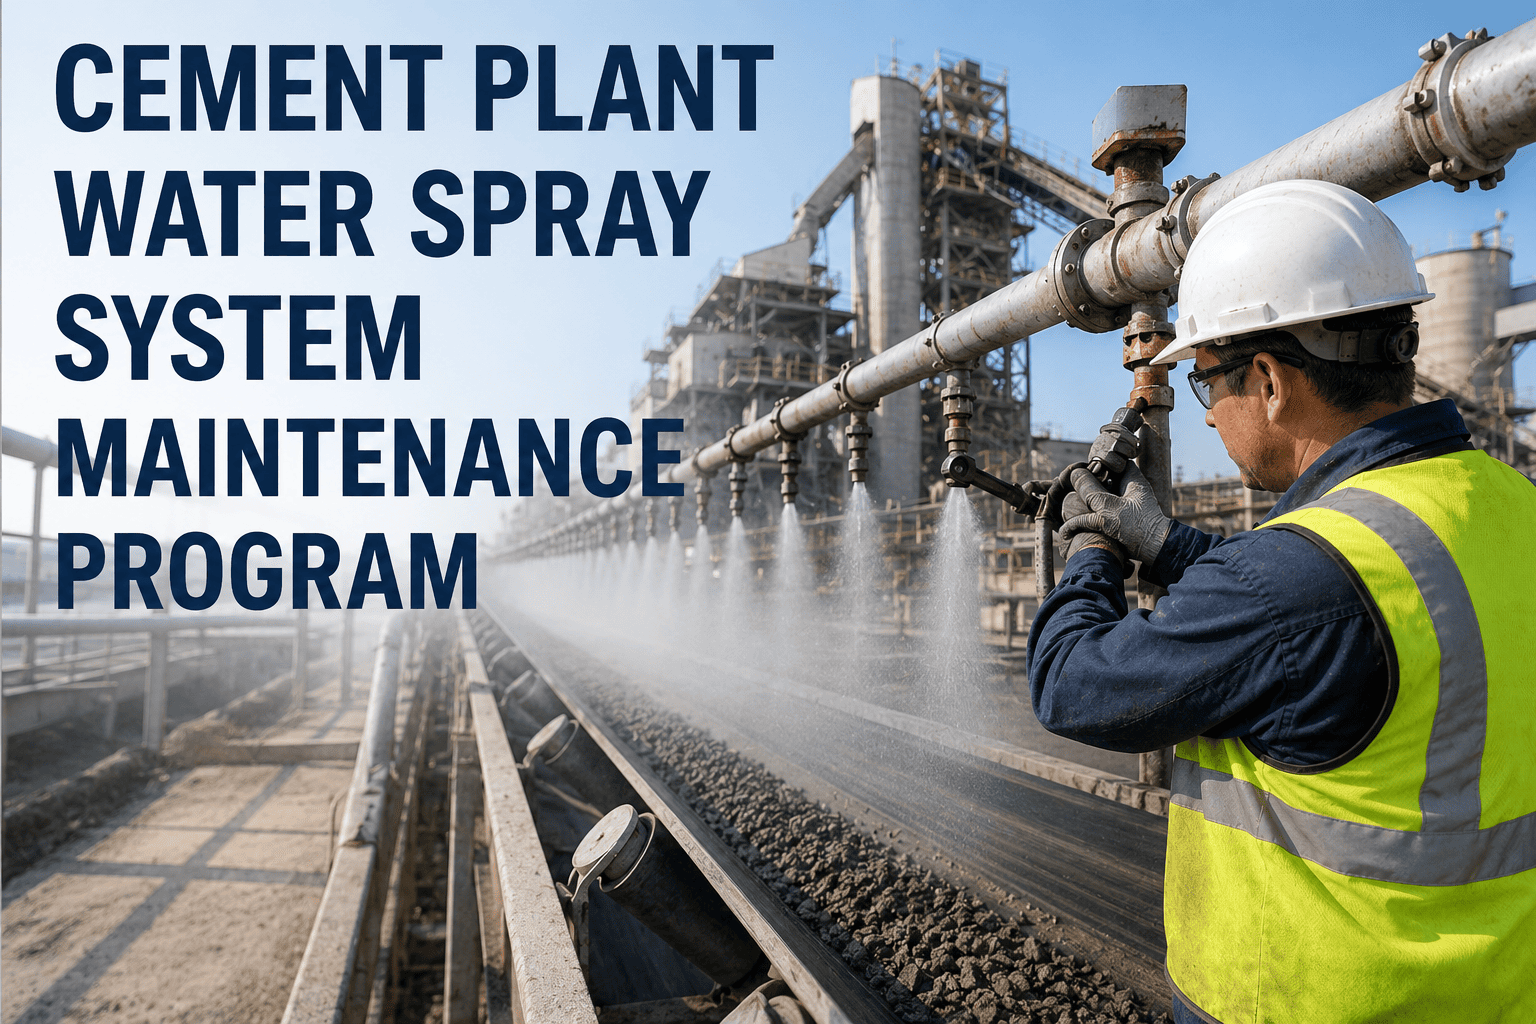
Conveyor water spray headers
Atomizing nozzles at transfer points clog every 14-30 days from calcium carbonate buildup. Without meter-based PM, droplet size drifts above 200 microns and suppression efficiency falls below 40%.
PM every 14 daysStockpile dust suppression rings
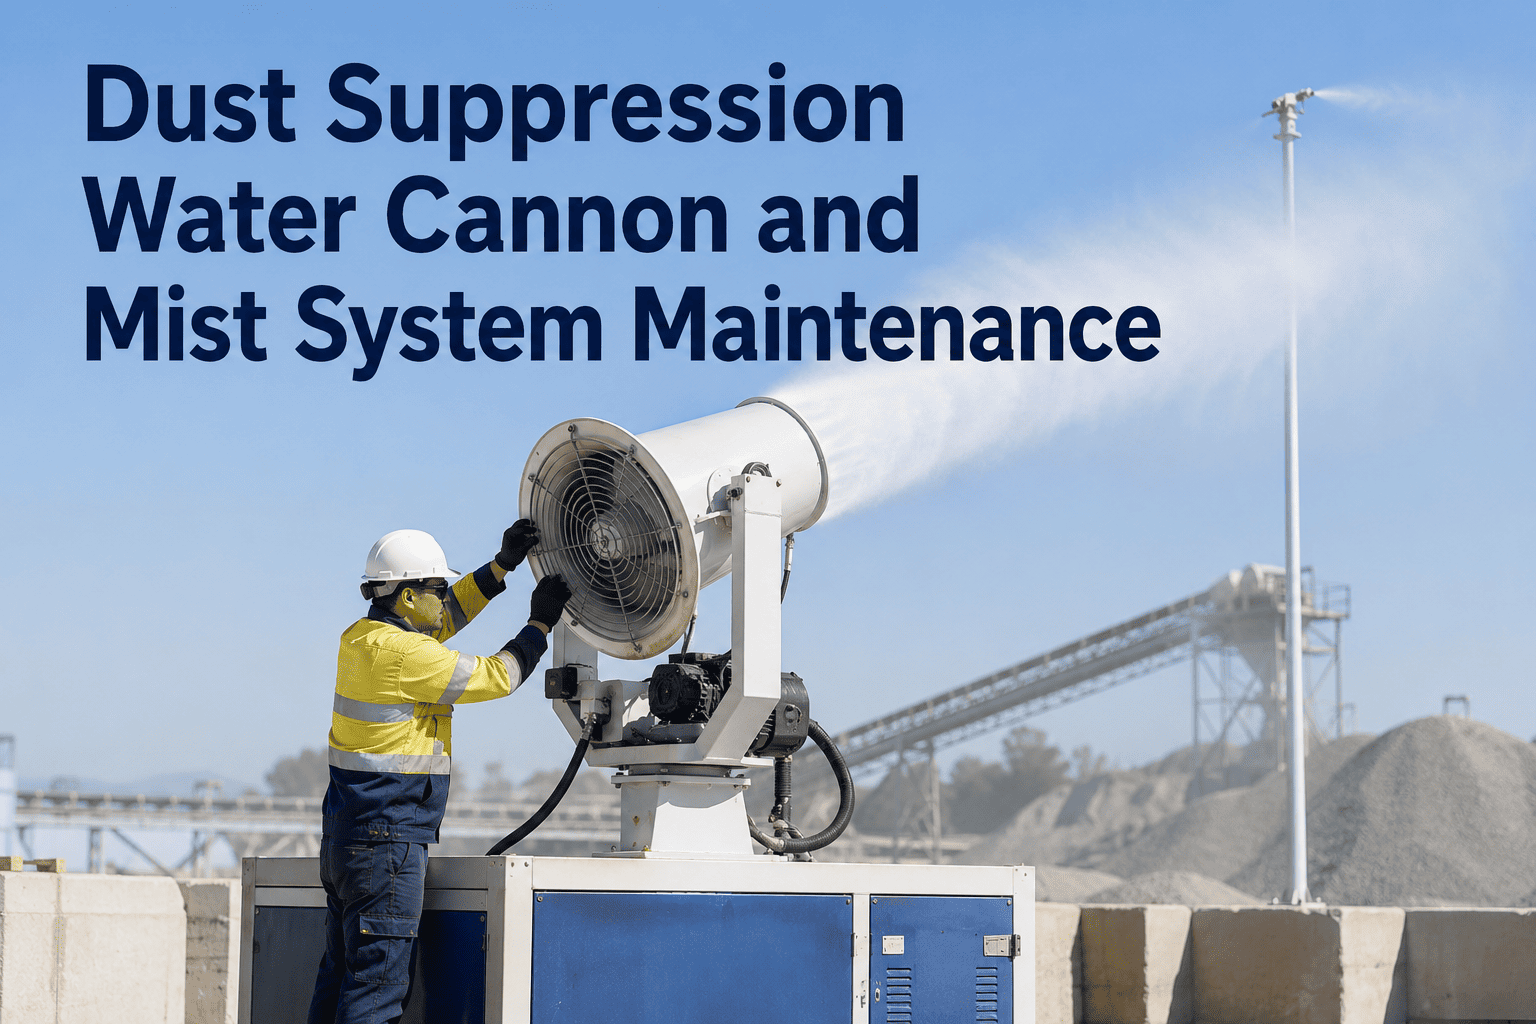
Perimeter spray rings and gantry-mounted cannons cover 40-60m radius zones. Wind shift above 12 m/s defeats the pattern; the system must trigger on anemometer input, not a timer.
Anemometer-triggeredChemical dosing skids
Surfactant and binder dosing at 0.3-1.0% concentration reduces surface tension so water coats fine particles instead of beading. Dosing pumps need calibration every 90 days or chemical cost spikes 25%.
Calibrate quarterlyWind barrier fences
Porosity-critical wind fences (28-34% open area) lose effectiveness when panels tear or fasteners corrode. A single 2m² gap redirects airflow and re-entrains 15-20% of settled dust back into the airstream.
Inspect monthlyThe 12-month suppression maintenance calendar
Triggered PMs inside a CMMS stagger nozzle cleaning, dosing calibration, barrier inspection, and compliance reporting across the year so nothing clusters in one shutdown window.
Nozzle baseline + flow audit
Catalog every nozzle by location, orifice size, spray angle, and rated flow. Baseline pressure at the header (target 3.5-5.0 bar). Flag any nozzle delivering <85% of rated flow for replacement — a 15% drop means the orifice is already 30% occluded.
Chemical dosing calibration
Pull dosing pump stroke rate and verify actual delivery against setpoint with a graduated cylinder catch test. Adjust concentration to 0.5% for conveyors, 0.8% for stockpiles. Log consumption per tonne of material handled to spot drift early.
Wind barrier + enclosure integrity
Walk every fence line and transfer tower enclosure. Photograph tears, missing fasteners, and corroded frame joints. Use a portable anemometer to verify internal air velocity stays below 4 m/s at all stockpile discharge points.
Pump and valve preventive maintenance
Replace diaphragms on dosing pumps (typical service life 4,000-6,000 hours), check solenoid valve coil resistance, and flush header lines with descaler. A failed solenoid on one zone can dump 200L of chemical into a single stockpile in 8 hours.
Compliance review + annual rebuild
Compile PM completion rates, chemical consumption per tonne, fenceline PM10 trends, and community complaint logs into the annual environmental report. Replace nozzles that have been cleaned more than 6 times — they never return to rated flow.
What a CMMS-driven suppression program actually saves
A worked example: a 180-asset cement plant spending $42K/year on suppression chemicals, nozzle replacements, and reactive callouts.
| Suppression KPI | Pre-CMMS baseline | Post-CMMS (90 days) | Change |
|---|---|---|---|
| Fenceline PM10 (24-hr avg) | 78 µg/m³ | 48 µg/m³ | -38% |
| Nozzle PM completion rate | 61% | 97% | +36 pts |
| Chemical cost / tonne handled | $0.18 | $0.11 | -39% |
| Community dust complaints / quarter | 14 | 3 | -79% |
| Permit deviation notices / year | 4 | 0 | -100% |
| Mean time between nozzle failures | 22 days | 58 days | +164% |
Map every nozzle, dosing pump, and wind fence in one system
Trigger suppression PMs automatically, track chemical consumption per tonne, and generate compliance-ready reports in under 10 minutes.
Six automated PMs your CMMS should fire for suppression assets
Each trigger below is a condition, not a guess. Configure them once and the system generates work orders, assigns technicians, and logs results against the asset record.
Runtime hours on conveyor spray pumps
At 500 hours, auto-generate a nozzle inspection work order. At 2,000 hours, generate a pump service order including diaphragm replacement and pressure-relief valve check.
Anemometer threshold breach
When wind speed exceeds 10 m/s for 3 consecutive minutes, fire an alert to activate perimeter stockpile cannons and log the event for compliance reporting.
Chemical tank level low
At 20% tank volume, generate a reorder notification tied to the supplier lead time. At 8%, escalate to the shift supervisor so dosing never runs dry mid-shift.
Flow rate deviation at header
If flow sensor reads >15% below setpoint for 5 minutes, flag the zone for nozzle cleaning. The CMMS auto-schedules the clean within the next shift window.
Quarterly dosing calibration
Every 90 days, generate a catch-test work order for each dosing skid. Record actual vs. setpoint delivery and auto-adjust the CMMS asset profile if drift exceeds 5%.
Community complaint logged
When a complaint is entered, auto-pull the last 72 hours of suppression PM records, anemometer data, and spray activation logs into a single compliance packet.
A 5,000 TPD plant cut fenceline dust 38% in 90 days
Paper logs, time-based PMs, 14 complaints/quarter
- Nozzle cleaning on a fixed 30-day calendar — regardless of condition
- Dosing pumps last calibrated 11 months prior; concentration unknown
- 3 permit deviation notices in 12 months; $22K in fines
- Fenceline PM10 averaging 78 µg/m³ against a 60 µg/m³ permit limit
Condition-based PMs, automated triggers, 3 complaints/quarter
- Nozzles cleaned on flow-deviation trigger — 35% fewer replacements
- Dosing calibrated quarterly; chemical cost per tonne down 39%
- Zero permit deviations in the following quarter
- Fenceline PM10 down to 48 µg/m³ — 20% below the permit limit
The CMMS trigger on flow deviation was the single biggest win. We stopped cleaning nozzles that didn't need it and caught the ones that did before they dumped dust into the neighborhood.
— Maintenance Manager, 5,000 TPD integrated cement plant
Cement dust suppression CMMS — what plants ask first
How often should conveyor spray nozzles be cleaned in a cement plant?
In high-calcium environments, inspect every 14 days and clean when flow drops 15% below rated output. A fixed 30-day calendar is too long — by day 30, a partially occluded nozzle is already operating below 60% efficiency. Configure a CMMS trigger on the flow sensor so cleaning happens on condition, not guesswork.
What chemical concentration works best for stockpile dust suppression?
For cement stockpiles, a surfactant dose of 0.5-0.8% in water reduces surface tension enough to coat fine particles without over-wetting the material. Above 1.0% you waste chemical and risk clinker quality issues; below 0.3% the water beads off and suppression drops below 30%. Calibrate the dosing pump quarterly and log consumption per tonne. You can set this up in minutes when you Start Free Trial and import your asset list.
Can a CMMS link suppression PM records to environmental compliance reports?
Yes — and this is where most plants see the fastest ROI. Every nozzle clean, dosing calibration, and wind barrier inspection is logged against the asset with a timestamp, technician, and reading. When a regulator or community complaint arrives, you export a 72-hour suppression activity packet in under 10 minutes instead of digging through paper logs.
How do wind barriers factor into a dust suppression maintenance program?
Wind fences with 28-34% porosity reduce stockpile wind erosion by up to 75%, but only if panels stay intact. A single 2m² tear redirects airflow and re-entrains settled dust. Inspect fence lines monthly for tears, corroded fasteners, and frame joint integrity. The CMMS should auto-generate a walk-down work order every 30 days and log photo evidence against the asset record.
What does it cost to implement a CMMS for dust suppression in a cement plant?
For a 180-asset plant, implementation typically runs 4-6 weeks and pays back in 3-5 months through recovered material, reduced chemical waste, and avoided fines. Most plants see $25K-$35K in annual savings. Book a Book a Demo session and we'll model the payback against your actual throughput and current chemical spend.
Stop losing material, chemical, and goodwill to fugitive dust
Import your suppression assets, configure PM triggers, and generate your first compliance report this week.
Free 14-day trial · No credit card