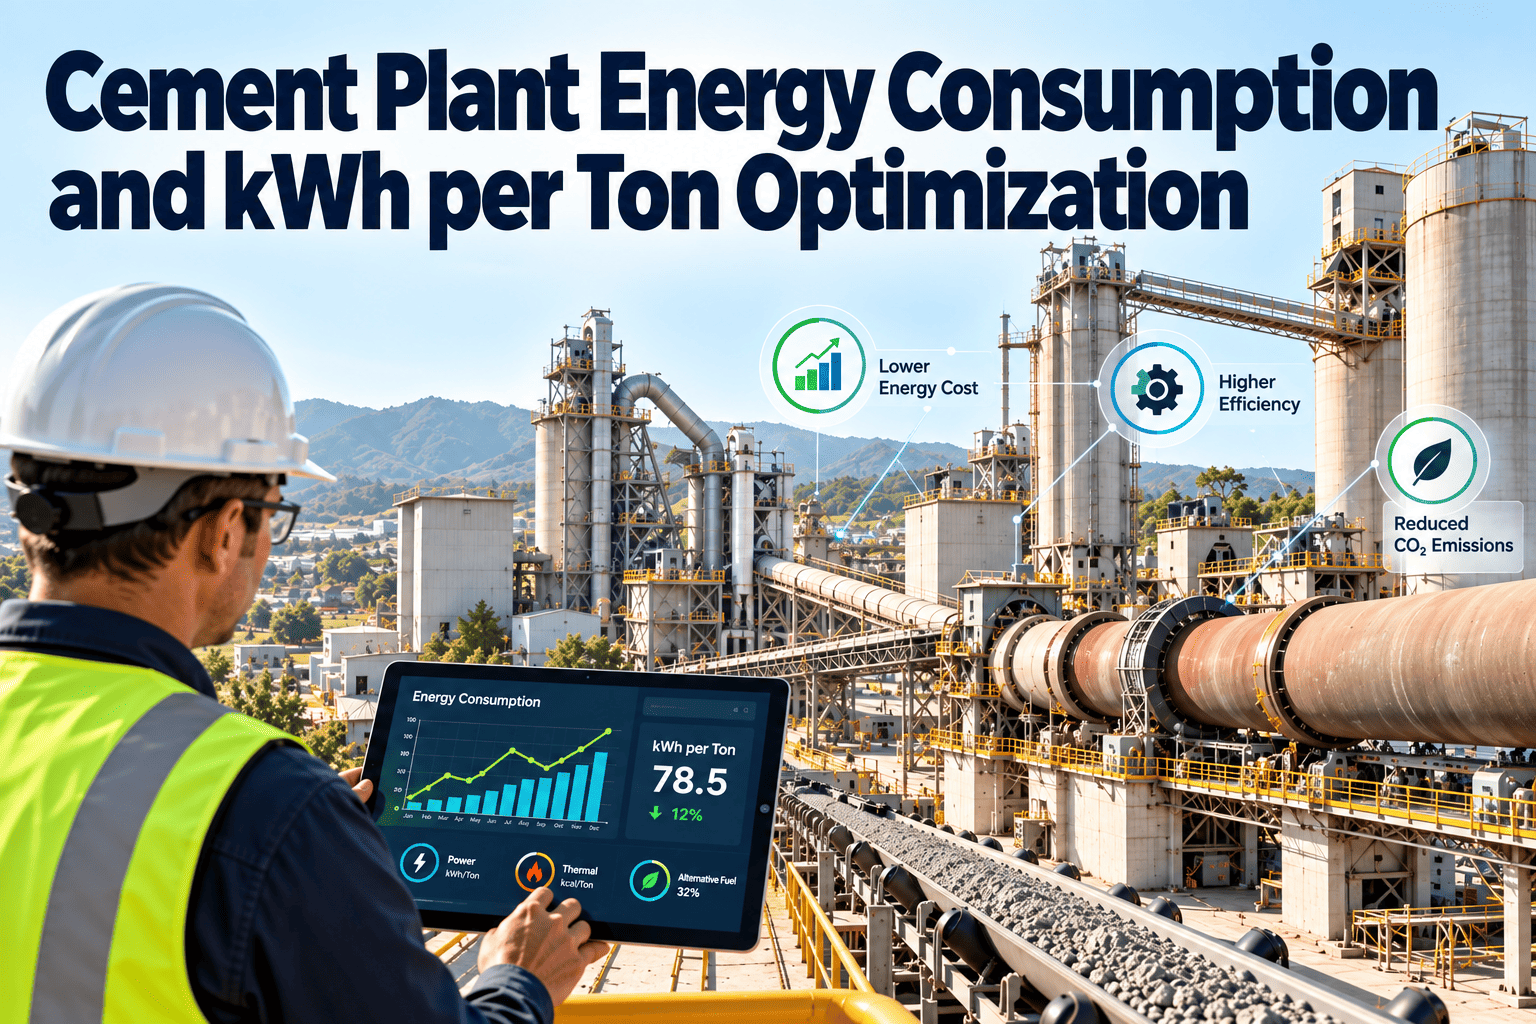
Energy is one of the largest controllable costs in a cement plant, and much of it is lost to equipment that has slowly drifted out of condition. Worn grinding parts, leaking ducts, fouled preheaters, misaligned drives, and unstable kiln operation all raise electrical and thermal consumption long before anything fails. Improving kWh per ton starts with knowing where energy goes and which assets cause the loss, and a connected CMMS for cement plants keeps that link visible.
Cement Plant Energy Consumption and kWh per Ton Optimization
High electrical and thermal energy use is often a maintenance signal in disguise. Learn where cement plants lose energy, how to measure it, and how to turn equipment condition into lower specific consumption.
Two energy problems, two kinds of waste
Thermal energy
- Measured in GJ or kcal per ton of clinker
- Driven by kiln stability, heat recovery, false air, and fuel quality
- Losses appear as high exit gas temperature and shell heat loss
Electrical energy
- Measured in kWh per ton of cement, clinker, or raw meal
- Driven by mills, fans, and drive efficiency
- Losses appear as higher motor load for the same throughput
Benchmarks vary widely by process, product mix, and plant age, so compare a plant mainly against its own best periods.
Equipment condition that raises specific consumption
| Area | Condition problem | Energy symptom | Maintenance action |
|---|---|---|---|
| Vertical roller mill | Worn rollers and table liners | Higher kWh per ton, more recirculation | Wear profile checks, timely rebuild |
| Ball mill | Ball charge and liner wear, diaphragm blockage | Lower throughput at same power | Charge audits and liner inspections |
| Separators | Worn vanes, poor seals | Overgrinding, high circulating load | Vane replacement and airflow checks |
| Fans and dampers | Fouled impellers, leakage, throttled dampers | High motor amps | Cleaning, balancing, drive optimization |
| Preheater and kiln | False air, coating, damaged refractory | High specific heat consumption | Seal repair, shell scans, refractory work |
| Motors and drives | Misalignment, bearing wear, poor lubrication | Extra losses and heat | Alignment, lubrication, vibration routes |
The energy loss cycle
Turn energy drift into planned maintenance
Tie specific consumption trends to the assets responsible and schedule work before losses become baseline.
How to measure kWh per ton usefully
- Normalize by product: kWh per ton of raw meal, clinker, and cement separately.
- Separate running hours from idle and startup consumption.
- Track specific consumption by mill and product type, since fineness and additives change the result.
- Record major asset events, such as liner changes and rebuilds, against the same timeline.
- Review trends weekly so gradual drift is visible.
Before and after a condition-based energy program
Before
- Energy reviewed monthly by finance
- Wear parts changed on fixed intervals or failure
- Mill and fan losses accepted as normal
- No link between power data and work orders
After
- Specific consumption tracked by asset
- Wear parts replaced on measured condition
- Deviations create inspection tasks
- Savings verified against completed work
Thermal efficiency: maintenance levers
Electrical efficiency: quick review points
Mills
Compare power draw against feed rate and product fineness after each rebuild.
Fans
Look for damper throttling, which suggests oversized or degraded fans.
Compressed air
Leaks quietly consume power. Include audits in routine inspections.
Drives
Assess variable speed drives where load varies and check motor condition.
KPIs for an energy and reliability review
Using Oxmaint for energy-focused maintenance
- Asset registers for mills, fans, separators, drives, and kiln equipment, with full history.
- Preventive schedules for alignment, lubrication, cleaning, and inspections.
- Condition-based triggers, such as raising a task when motor current or vibration rises.
- Work orders that record parts, labor, and outcomes for each rebuild.
- Inventory control for liners, rollers, vanes, and seals.
- Dashboards to compare maintenance activity with energy trends.
Frequently asked questions
Why does kWh per ton rise over time?
Wear, leakage, and fouling reduce efficiency until parts are replaced.
Can maintenance really cut energy use?
Yes, by restoring efficiency lost to wear. Book a demo for examples.
What is the best first step?
Record specific consumption by mill and link it to asset events.
How is thermal loss found?
Shell scans, exit gas trends, and false air checks reveal it early.
Can small plants use this approach?
Yes. Start with core assets and expand.
Lower kWh per ton by keeping assets efficient
Connect energy performance, equipment condition, and maintenance action in one system.