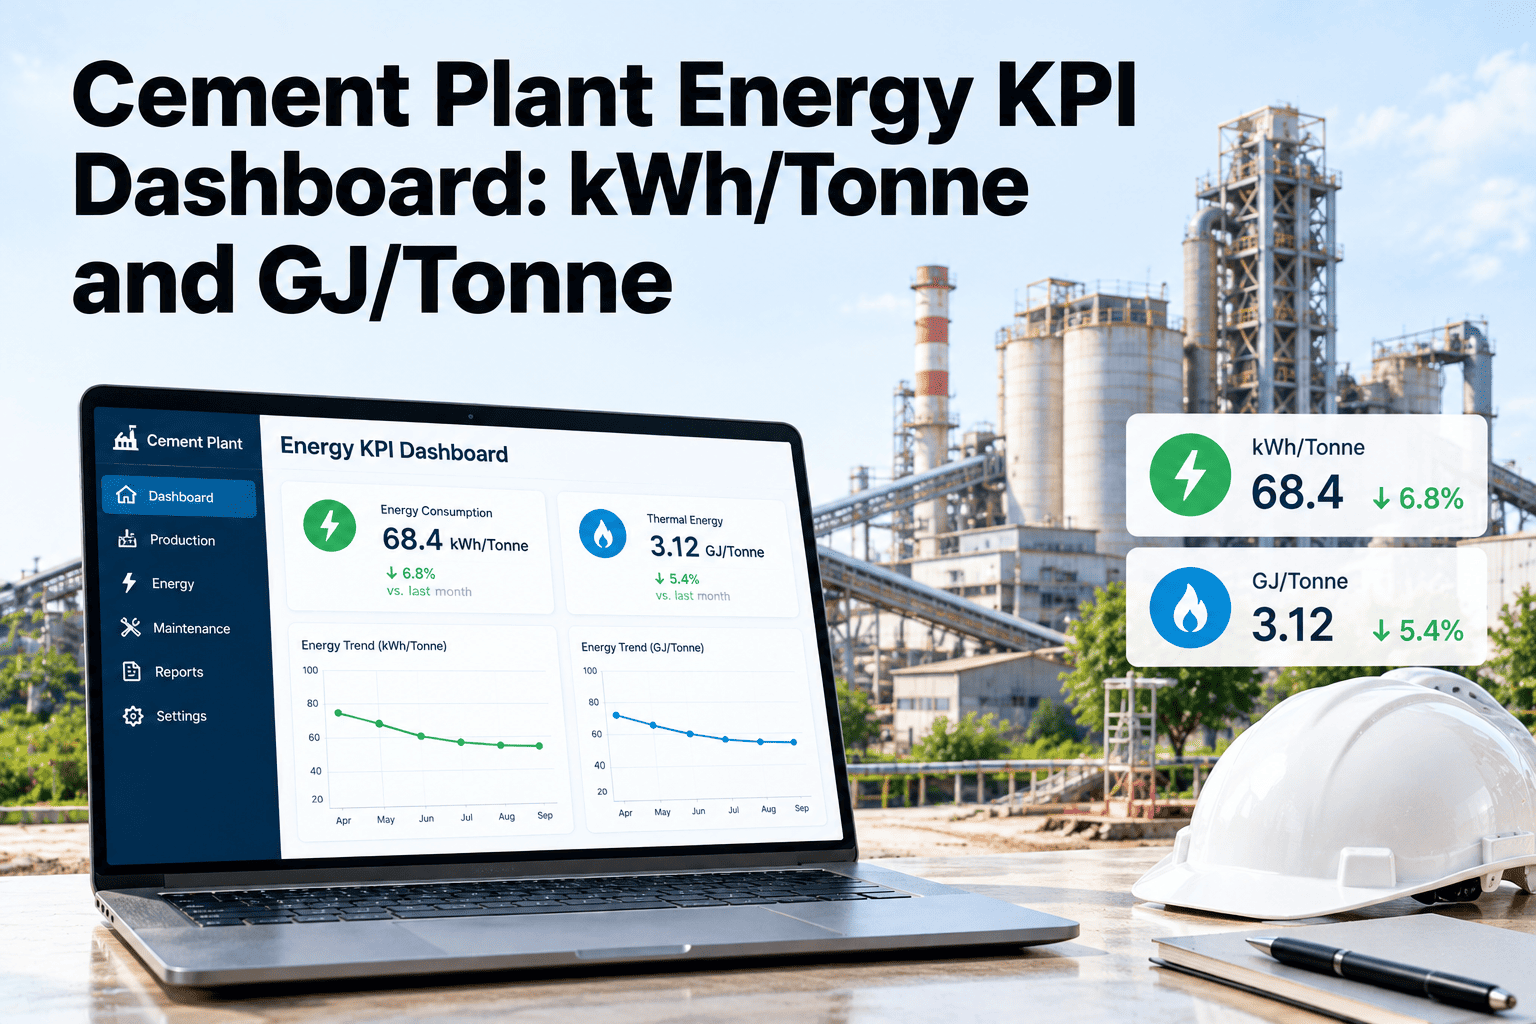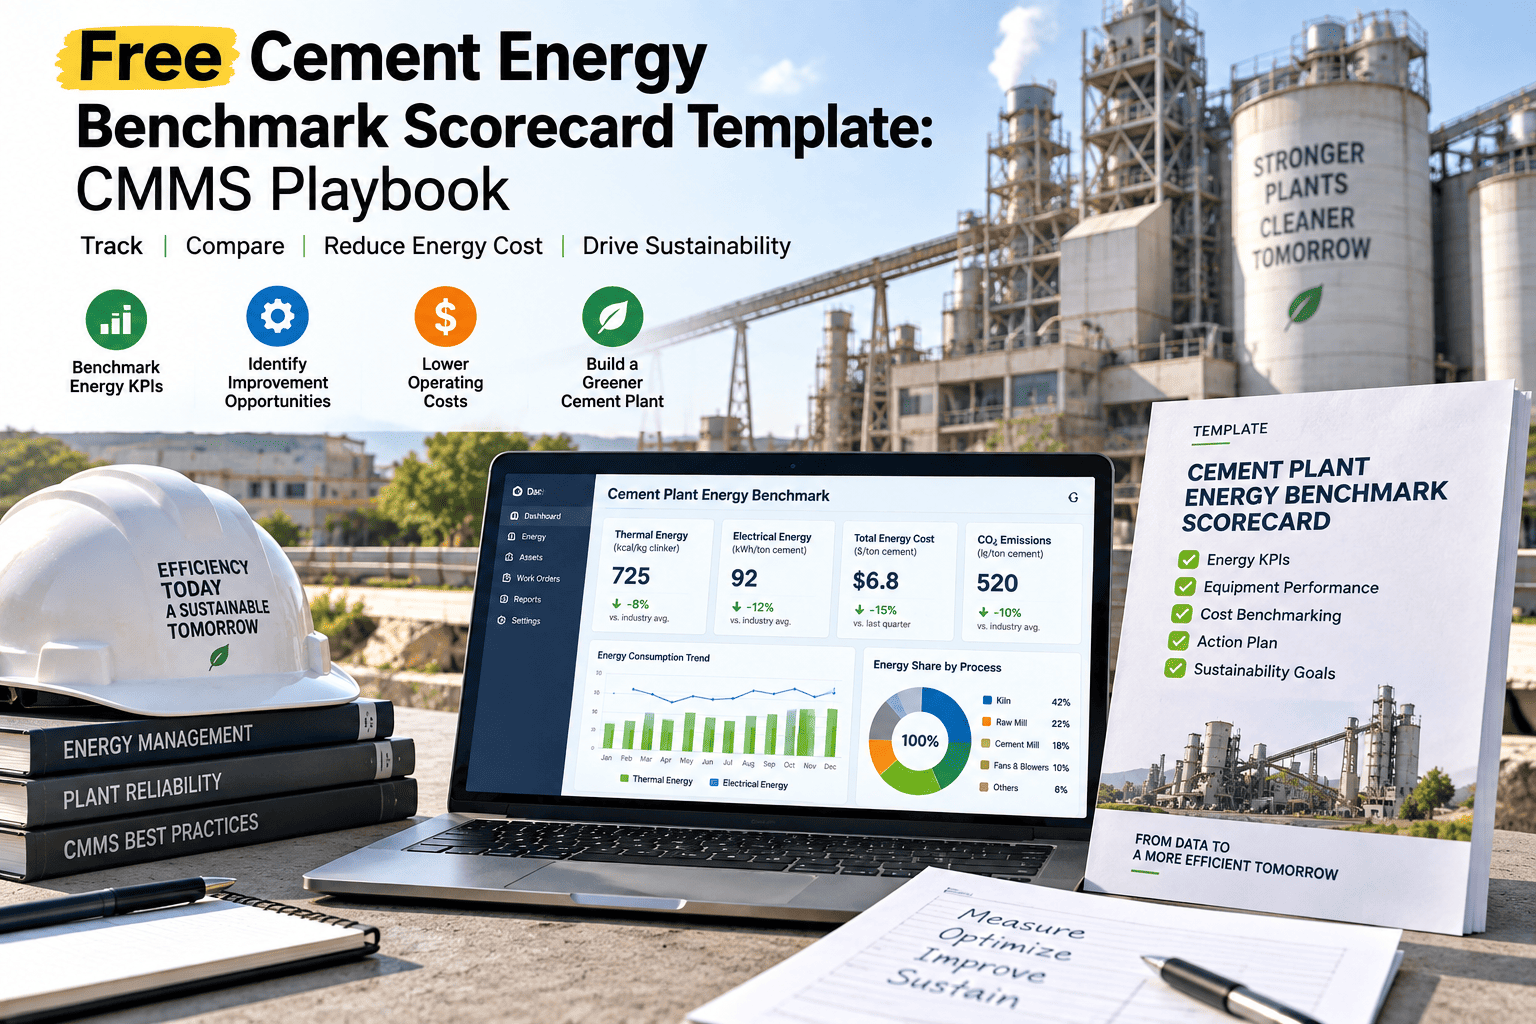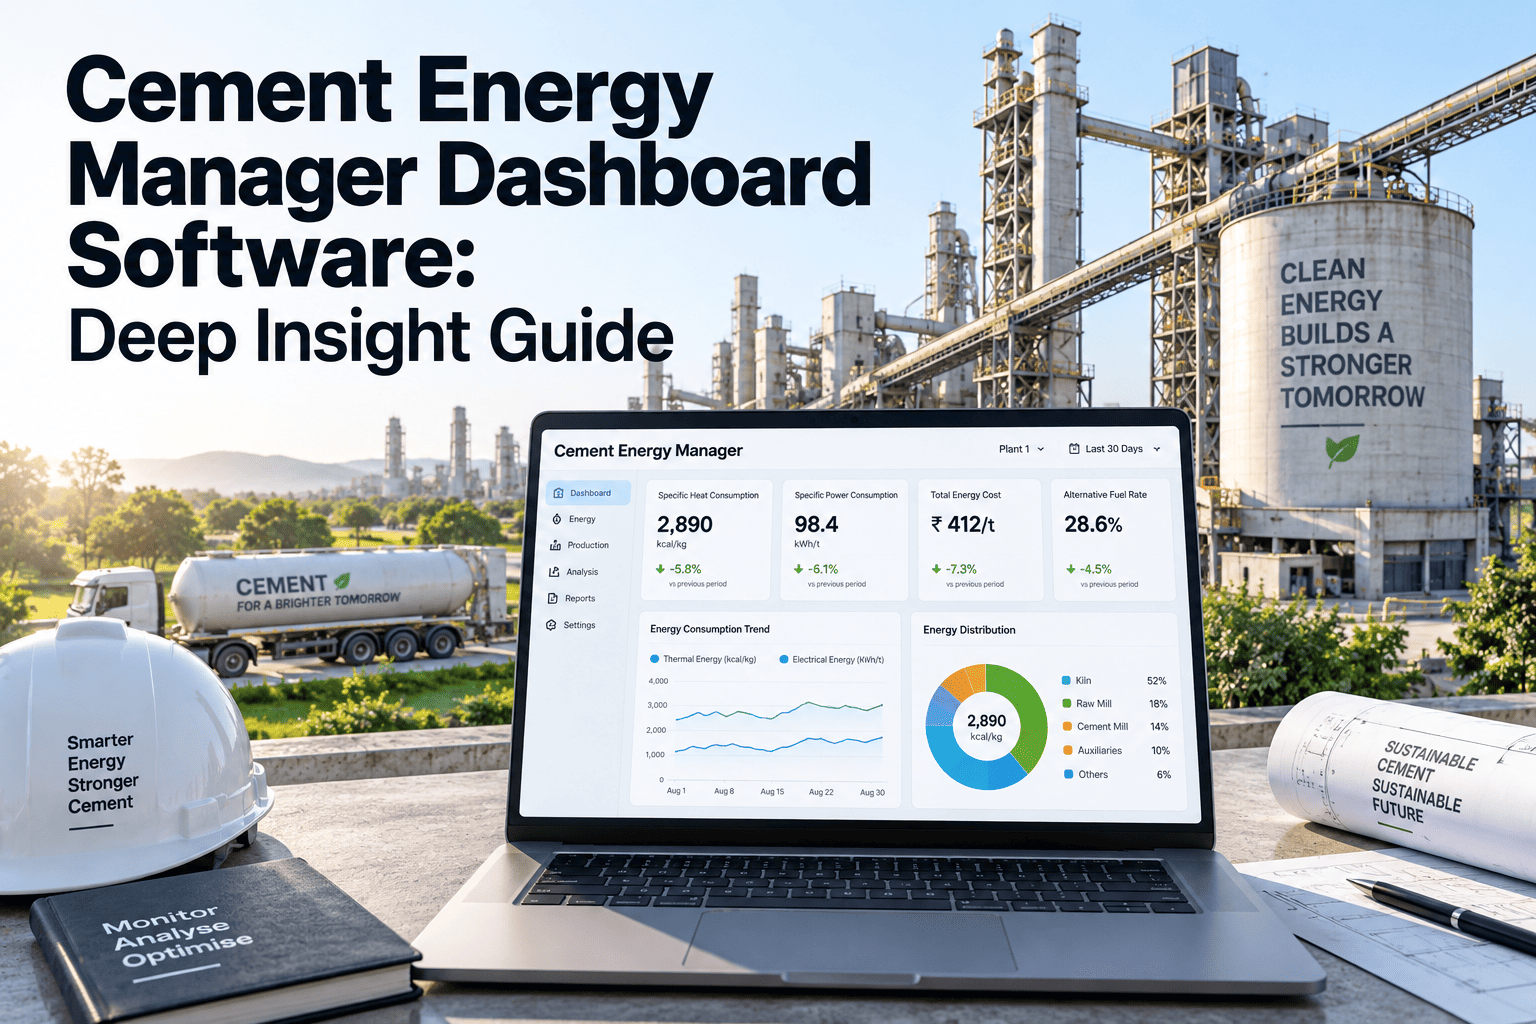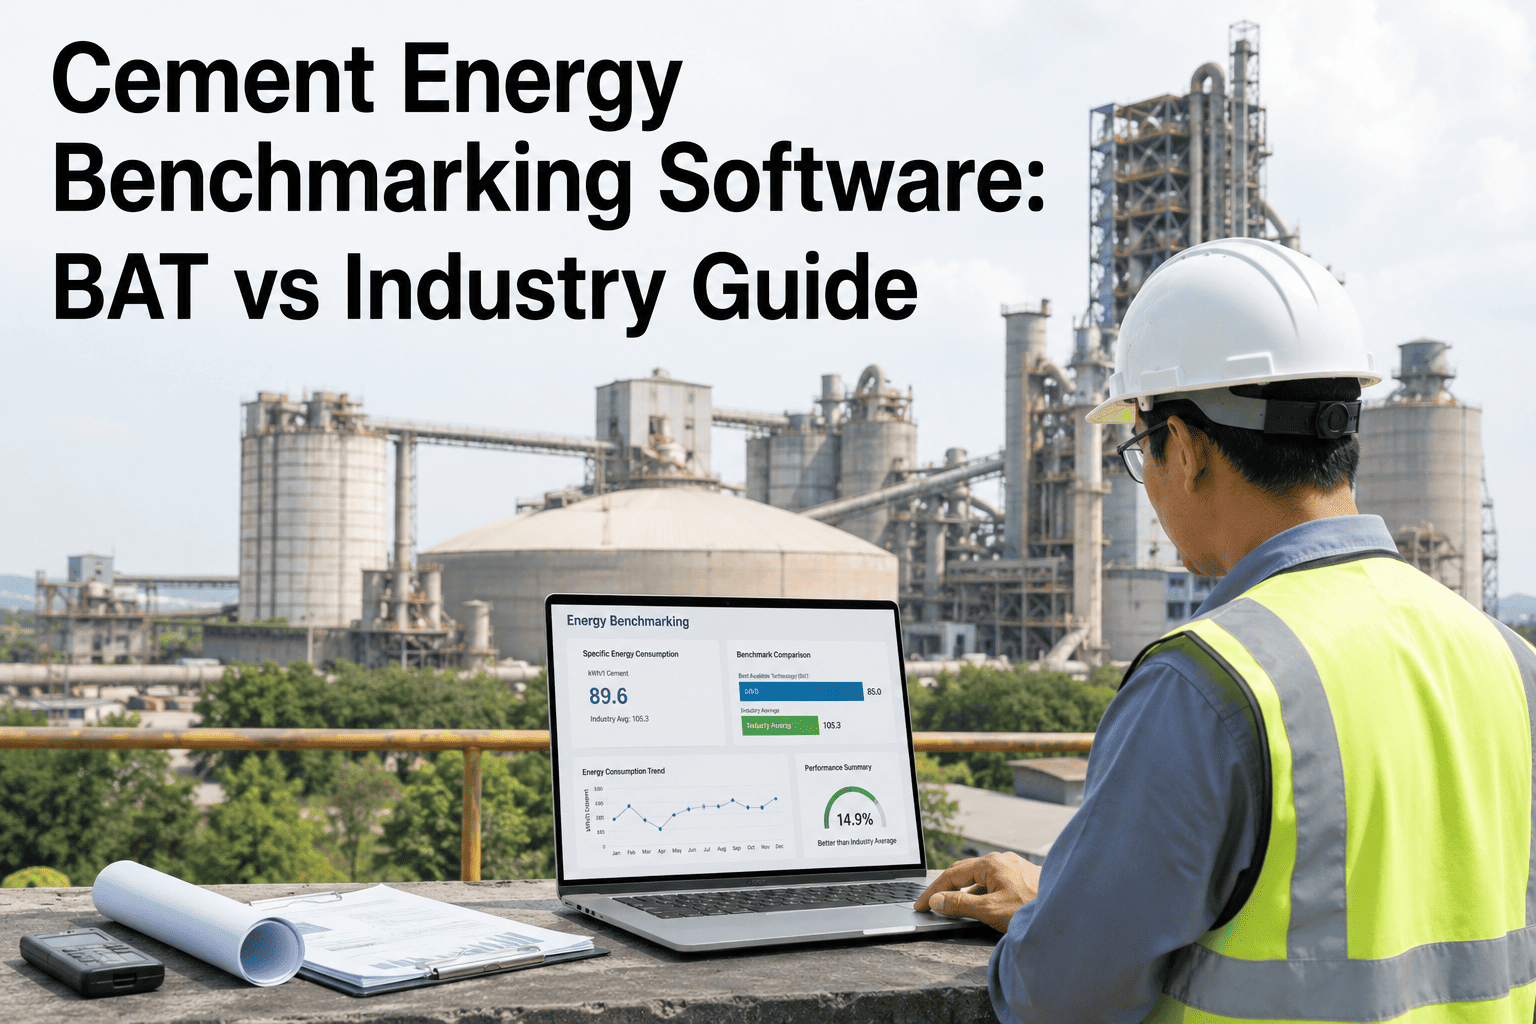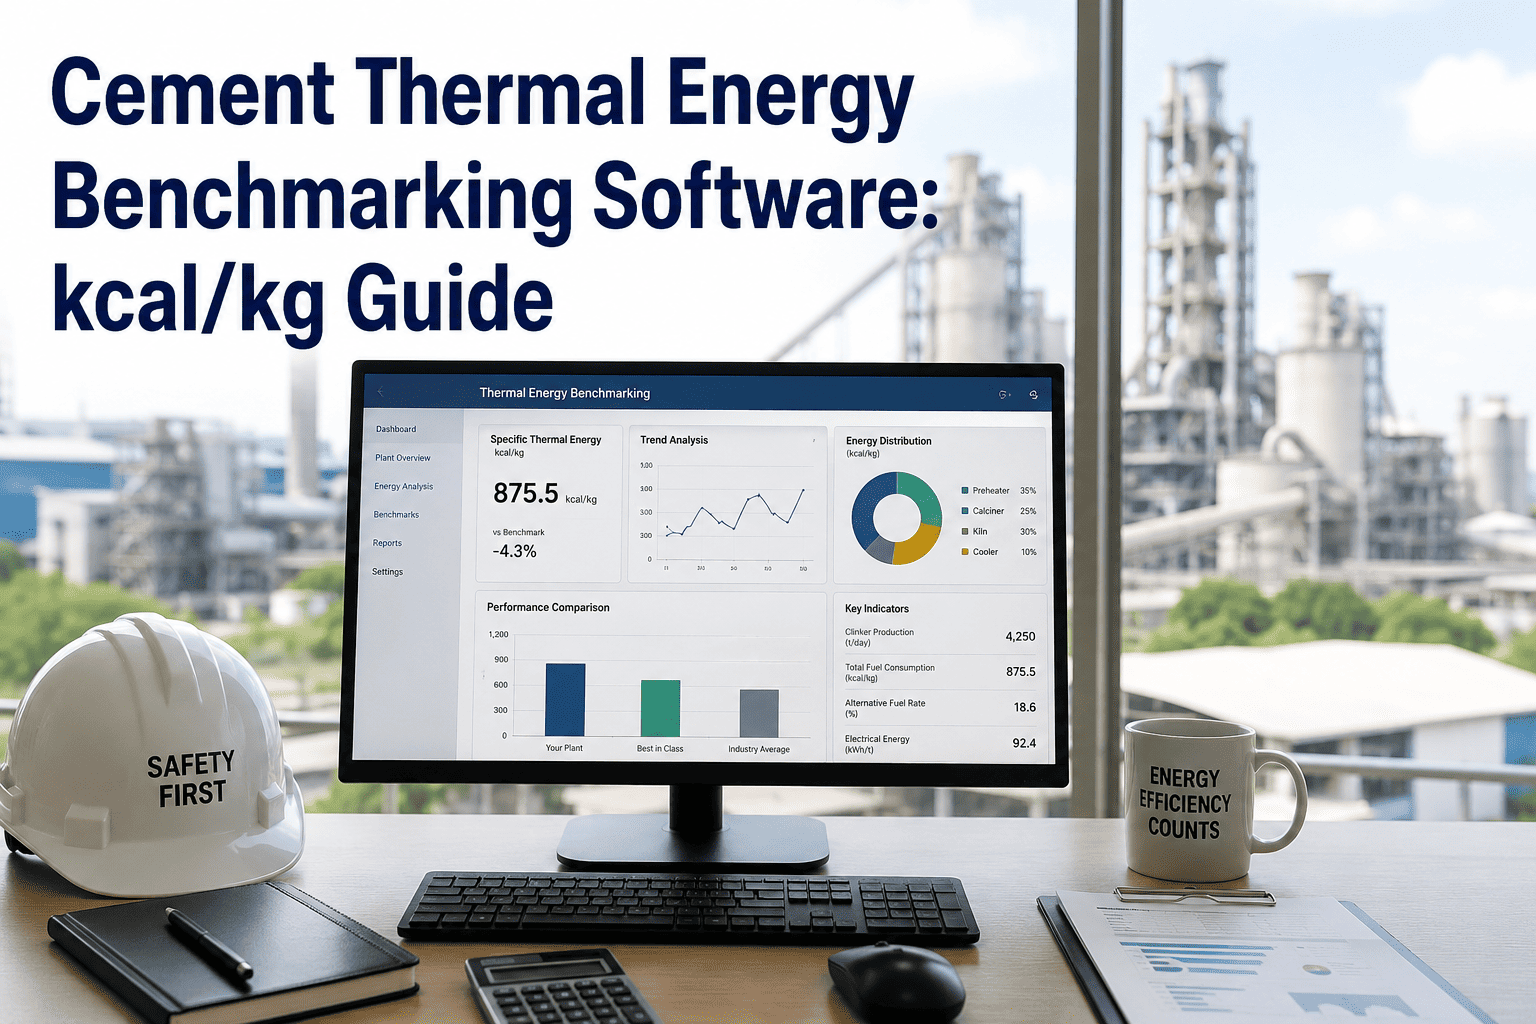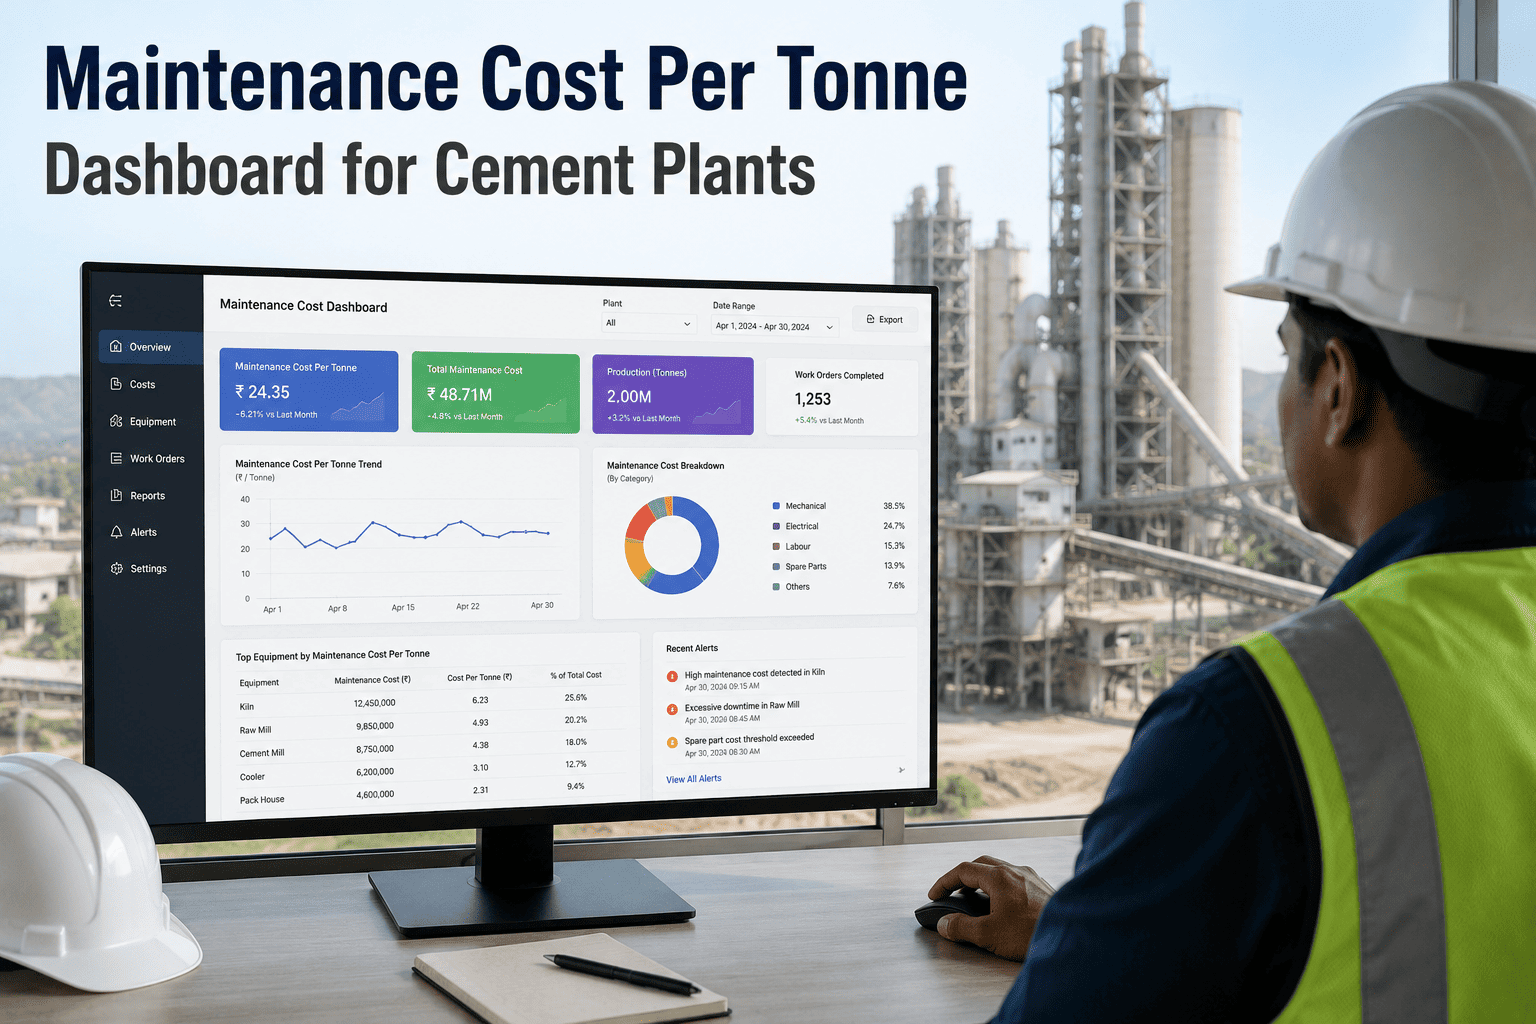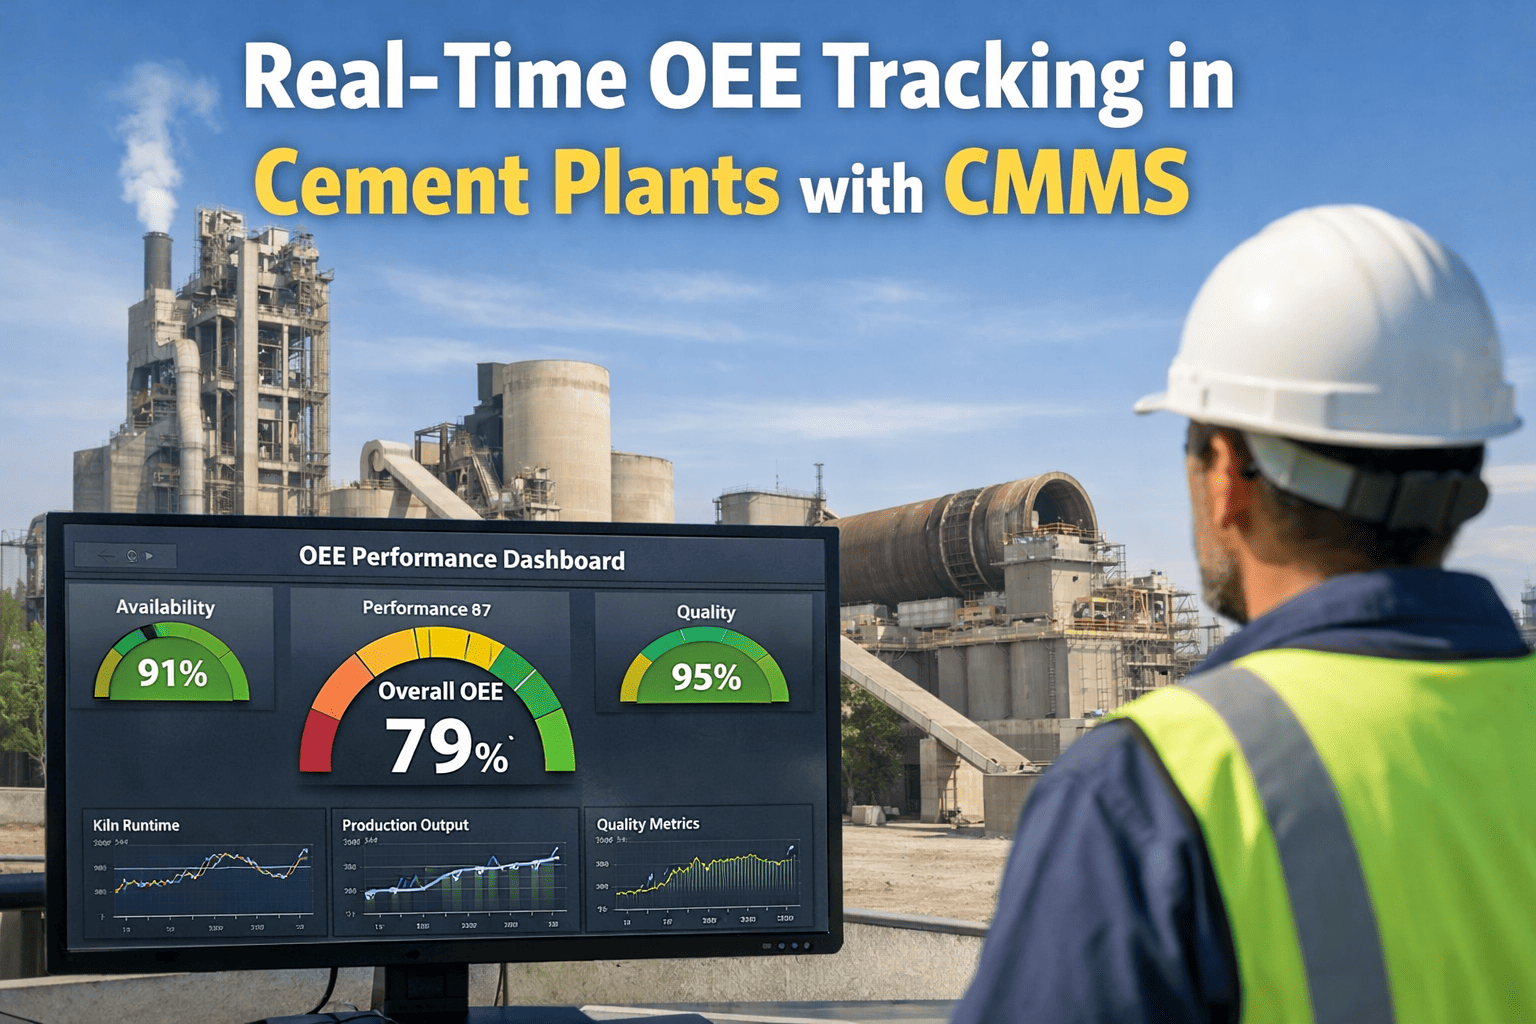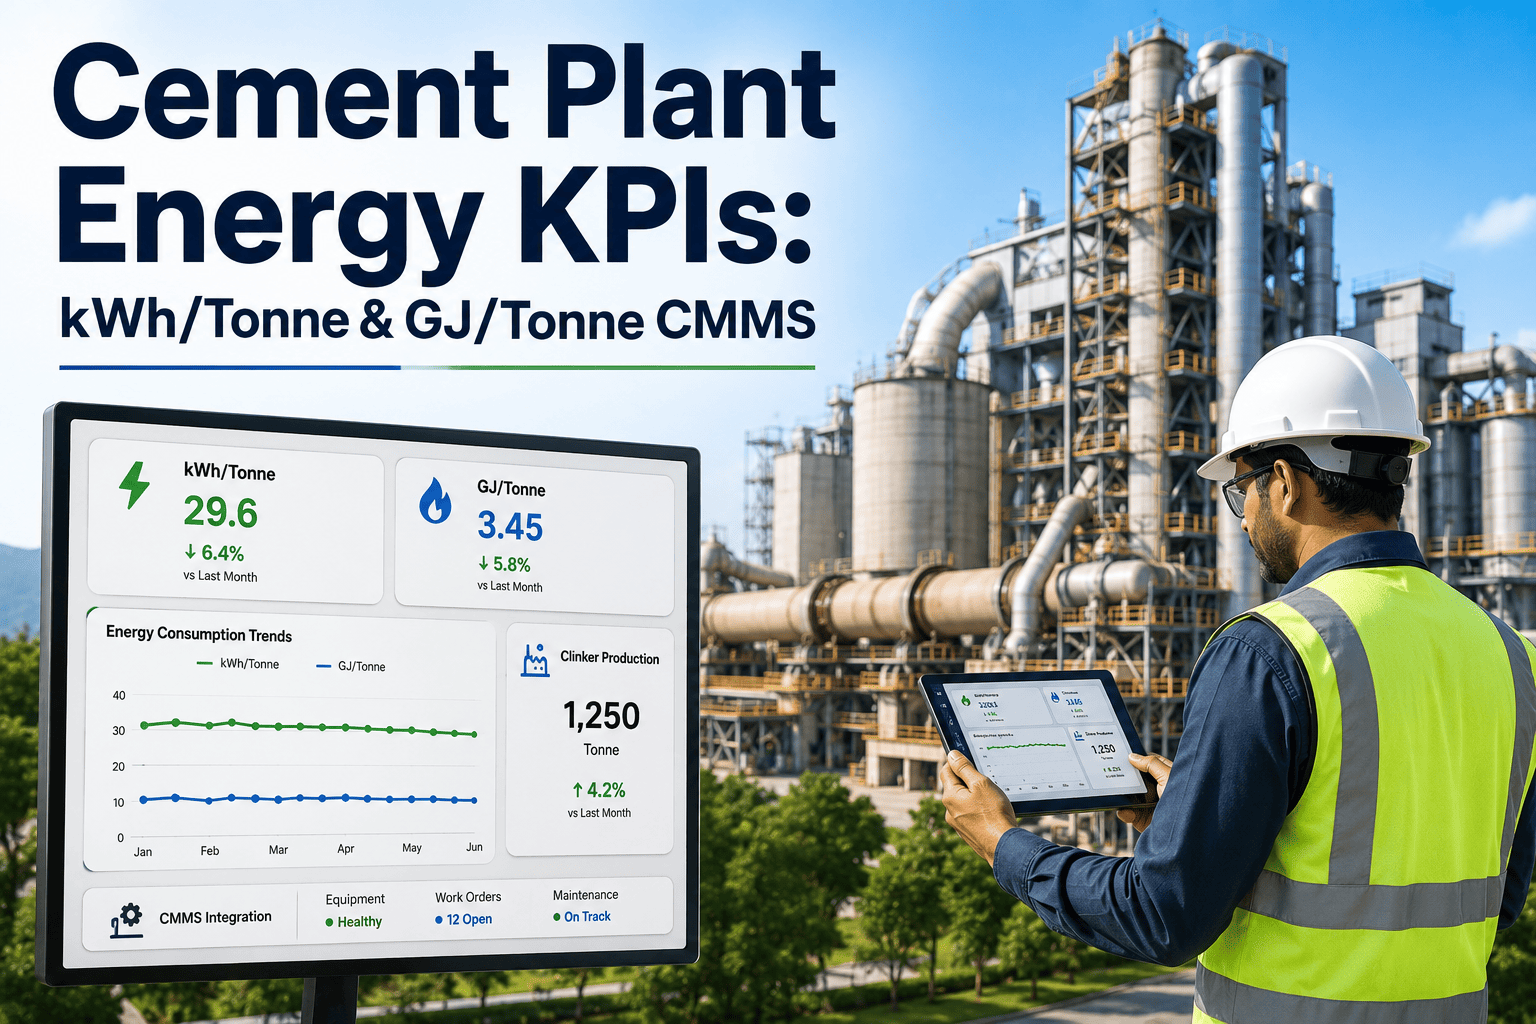
Energy is the single largest controllable cost in cement manufacturing — typically 30–40% of total production cost — which makes kWh per tonne of cement and GJ per tonne of clinker the two metrics every plant manager lives and dies by. A typical dry-process kiln burns 3.1–4.0 GJ of thermal energy per tonne of clinker and draws 90–120 kWh per tonne of cement, and the gap between a world-class plant at the low end and a struggling one at the top end can be 25% in energy spend — millions of dollars annually on a single line. Closing that gap is not about willpower; it requires rigorous KPI definition, reliable instrumentation, and a CMMS that captures run-hours, fuel flow, and meter readings against production output so variance is flagged in hours, not month-end. This guide walks through the KPIs, the measurement methodology, the industry benchmarks, the gap analysis, and the CMMS analytics that convert raw meter data into managed performance. Start Free Trial and turn your next meter reading into a corrective work order.
Cement Energy KPI Guide · CMMS-Driven
Are you burning 3.5 GJ per tonne of clinker — or 4.2?
A 0.7 GJ/t gap on a 5,000 tpd kiln is roughly 4.4 million m³ of natural gas equivalent every year — the difference between a plant that hits its cost curve and one that gets repriced out of the market. The plant that measures kWh/t and GJ/t in real time, against a CMMS-tagged asset hierarchy, closes that gap inside one operating quarter.
KPI Definitions · Measurement Methodology
The four KPIs every cement plant must track every shift
Industry publications, peer reviews and ISO 50001 energy-management audits converge on a small set of energy KPIs that, when measured consistently, expose 80% of the avoidable loss on a cement line. Each is a ratio — energy in, over a unit of product out — and each must be tagged to the asset hierarchy in the CMMS so variance triggers a work order, not just a report.
Electrical Energy per Tonne of Cement
kWh / t cement = total meter kWh (main + aux) ÷ tonnes cement dispatched
Captured from the main incomer meter plus sub-meters on the raw mill, kiln drive, cooler fans, finish mill and packing plant. Benchmark: a modern dry-process line with a vertical roller mill sits at 90–105 kWh/t; older ball-mill circuits drift to 115–130 kWh/t.
Thermal Energy per Tonne of Clinker
GJ / t clinker = fuel GJ (NCV basis) ÷ tonnes clinker produced
Calculated on net calorific value of whatever fuel is fired — coal, petcoke, AF, natural gas. A six-stage preheater with inline calciner and a high-efficiency cooler runs 3.1–3.4 GJ/t; a four-stage or wet-process legacy line can sit above 5.0 GJ/t.
Clinker Cooler Efficiency
η cooler = (secondary air enthalpy − primary air enthalpy) ÷ clinker heat content
The share of clinker heat recovered as hot secondary air to the kiln and tertiary air to the calciner. A modern grate cooler recovers 74–78%; a degraded cooler with broken grate plates, false air ingress or a poorly tuned fan curve drops to 65–70%, inflating GJ/t by 0.2–0.4.
Preheater Exit Gas Temperature
T exit (°C) = measured at preheater top, gas-tight probe, average over shift
A six-stage preheater discharges at 280–320 °C; a four-stage at 350–380 °C. Every 20 °C above benchmark is roughly 0.05 GJ/t lost to the raw mill and stack — recoverable through stage upgrades, false-air sealing, or bypass optimization.
Industry Benchmarks · Gap Analysis
Where the average plant sits — and where the best 10% sit
Benchmarking only matters if it is measured the same way. The ranges below assume dry-process clinker, NCV fuel basis, and a 12-month rolling average to smooth kiln stops and AF substitution swings. Use them as the denominator for gap analysis, then push each KPI into the CMMS as a tagged target on the relevant asset.
| KPI | Best-in-Class (10th percentile) | Industry Median | Bottom Quartile | Annual Cost Gap (1 Mtpa clinker) |
|---|---|---|---|---|
| Thermal energy (GJ/t clinker) | 3.10 | 3.55 | 4.20+ | $3.0M–$5.2M |
| Electrical energy (kWh/t cement) | 92 | 110 | 130+ | $1.4M–$2.6M |
| Cooler efficiency (%) | 78 | 73 | 66 | $0.9M–$1.8M |
| Preheater exit temp (°C) | 290 | 330 | 370+ | $0.6M–$1.2M |
| Specific heat consumption variance | ±2% | ±5% | ±9%+ | Hidden loss |
A 5,000 tpd dry-process plant runs 3.9 GJ/t clinker and 118 kWh/t cement — bottom-quartile thermal, median electrical. At $10/GJ fuel and $0.09/kWh, the gap to best-in-class costs roughly $6.8M per year. Sealing false-air leaks, restoring cooler grate plates, and tuning the ID fan recovered 0.45 GJ/t and 9 kWh/t inside two quarterly shutdowns — payback under five months on a $480K maintenance spend. The work orders, meter reads, and shift deltas were all tracked in the CMMS, so the savings were provable to the board.
CMMS Analytics · From KPI to Work Order
How a CMMS turns an energy KPI into a managed outcome
A meter reading on its own is a number. A meter reading bound to an asset, a production tag, and a work-order history is a managed KPI. The four-step flow below is how high-performing plants convert energy data into corrective action — typically inside one 8-hour shift.
Tag meters and fuel flow to the asset hierarchy
Main incomer, sub-meters, fuel flow meters and weigh feeders are each mapped to a CMMS asset ID. Production output (clinker tonnes, cement tonnes) is mapped to the same shift tag. Every kWh and every GJ is now attributable.
Calculate KPI against target each shift
The CMMS computes kWh/t and GJ/t at shift end and compares against a target curve (best-in-class, plant baseline or rolling 90-day median). Variance beyond ±3% raises a flag on the asset dashboard — not buried in a monthly energy report.
Root-cause the variance to a component
A rising GJ/t with a stable preheater exit temperature points to the cooler. A rising kWh/t on the finish mill with steady feed points to media grading or diaphragm wear. The CMMS pulls the asset's failure history, last service date and inspection checklist into one view.
Auto-generate a corrective work order
Variance over threshold raises a work order against the tagged asset — pre-loaded with the diagnostic notes, the inspection checklist, spare parts, and a target completion date. The KPI is re-measured the next shift and the loop closes.
Energy KPI · Managed
Stop reading about energy KPIs. Start closing the gap.
OxMaint binds your meters, fuel flow, and production tags to the asset hierarchy — so every kWh and every GJ is attributable, varianced, and converted into a corrective work order inside one shift.
FAQ · Cement Energy KPIs & CMMS
Five questions plant managers ask before rolling out CMMS-based energy tracking
What is a good kWh per tonne of cement — and what does the gap actually cost?
Best-in-class dry-process plants with vertical roller mills run 90–105 kWh/t cement. The industry median sits around 110 kWh/t and older ball-mill circuits drift to 125–130 kWh/t. At $0.09/kWh on a 1.5 Mtpa cement line, every 10 kWh/t of gap is roughly $1.35M per year — recoverable through media grading, fan VFD tuning, and shuttering false-air leaks, all of which the CMMS tracks as work orders against the tagged asset.
How is GJ per tonne of clinker calculated, and why does fuel basis matter?
GJ/t clinker = total fuel energy on a net calorific value (NCV) basis divided by tonnes of clinker produced. NCV is used because the latent heat of water vapour in exhaust gas is not recoverable in a cement process. Mixing gross and net calorific values across coal, petcoke and alternative fuel streams is the single most common benchmarking error — it can swing reported GJ/t by 5–8% and mask real performance.
Can a CMMS actually reduce energy cost, or does it just report it?
A CMMS reduces cost when it closes the loop between measurement and action. OxMaint tags each meter and fuel flow to an asset, computes kWh/t and GJ/t at shift end, variances against target, and auto-raises a corrective work order when the breach threshold is crossed. Most plants see a 3–7% reduction in energy spend within the first operating quarter. Book a Demo to see the variance-to-work-order loop on a live asset hierarchy.
Which assets should be sub-metered first for maximum KPI coverage?
Priority order is the finish mill (largest electrical draw, 35–45% of plant kWh), the kiln main drive and ID fan (15–20%), the cooler fans (10–12%), the raw mill (12–15%), and the packing plant (3–5%). On the thermal side, meter the primary fuel weigh feeder, any AF feed, and the cooler exhaust. Sub-metering these seven points captures over 90% of attributable energy and exposes most controllable losses.
How long does it take to see a measurable energy KPI improvement after CMMS rollout?
Plants with clean metering and an existing asset hierarchy typically see first variance flags inside two weeks and verified KPI improvement inside one quarter — usually from low-cost fixes like false-air sealing, fan tuning, and media top-up. Larger gains from cooler grate restoration or preheater stage work land in the second quarter after a planned shutdown. Start Free Trial and the first shift-level KPI dashboard is live within 48 hours of onboarding.
Your Energy KPI · Managed
Turn every meter reading into a corrective work order.
Tag meters to assets, variance kWh/t and GJ/t every shift, and auto-raise work orders the moment a KPI breaches target. Most plants recover 3–7% of energy spend inside one operating quarter.
Free 14-day trial · No credit card