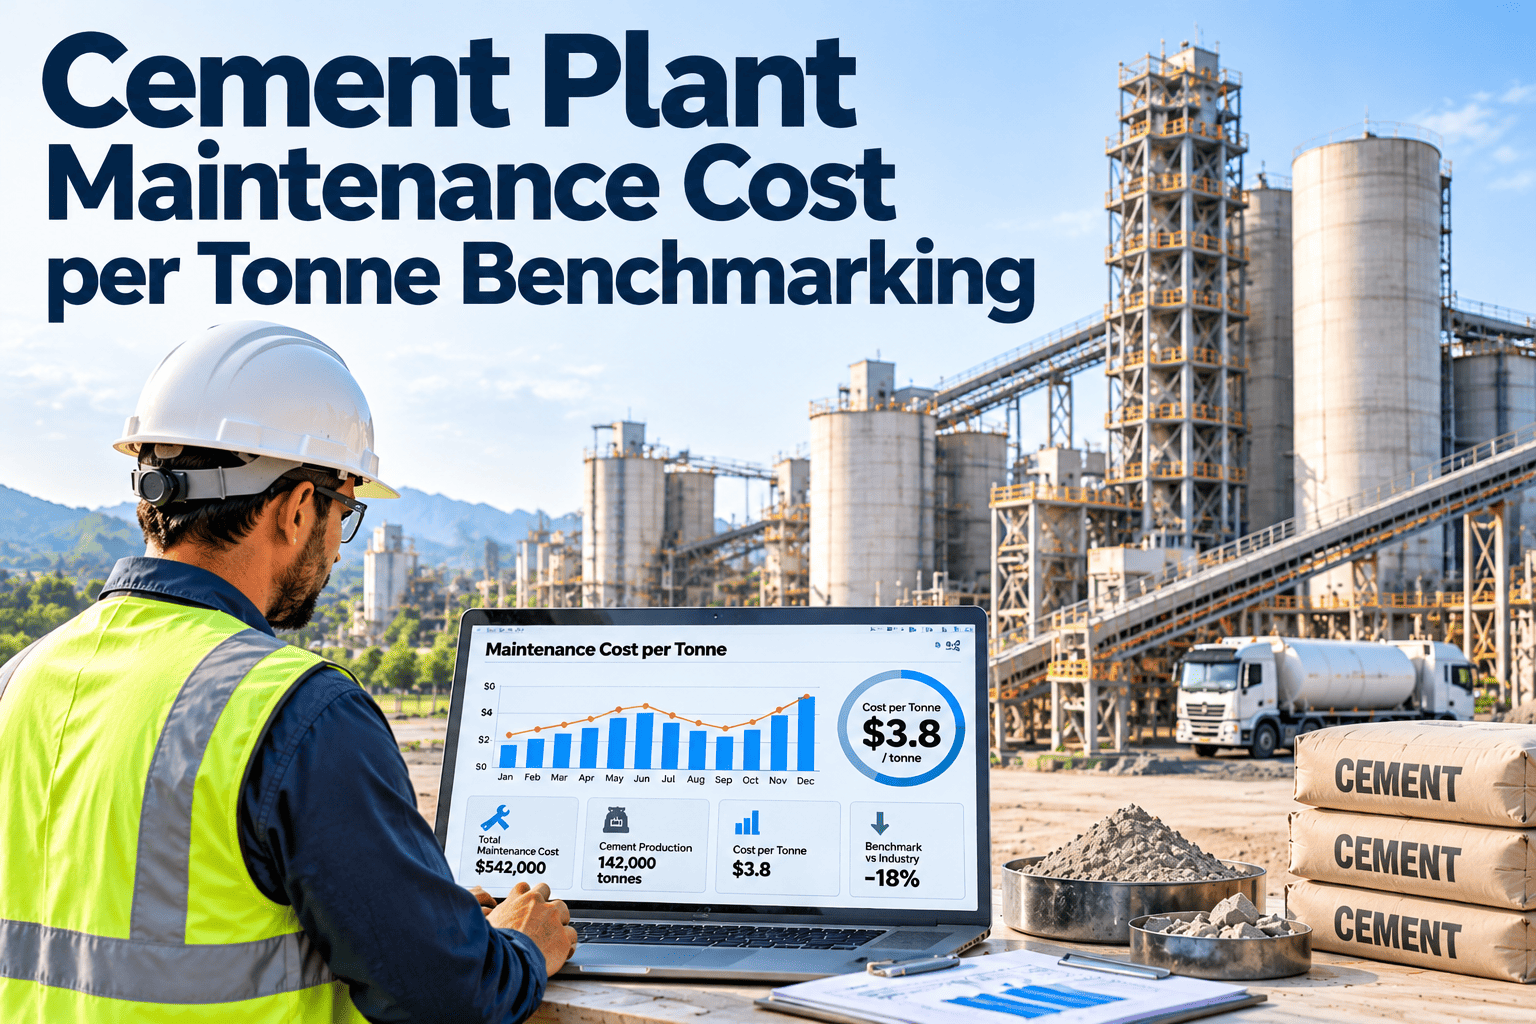
Maintenance cost per tonne is one of the first numbers a cement plant manager is asked for and one of the easiest to compare badly. Two plants can report very different figures because they define cost differently, run different equipment, or sit at different points in a wear cycle. Done well, benchmarking shows where maintenance money goes, which areas are out of line, and whether spending is buying reliability. This guide covers how to define the metric, normalize it, compare it fairly, and trace it to records kept in maintenance management software.
Cement Plant Maintenance Cost per Tonne Benchmarking
Define, normalize, and benchmark maintenance cost per tonne across areas, periods, and plants, and use the result to direct spending where it improves reliability.
What Goes Into the Cost Side
The first benchmarking failure is inconsistent scope. Agree exactly what counts before comparing anything.
| Cost category | Examples | Common scope question |
|---|---|---|
| Direct maintenance labor | Mechanical, electrical, instrumentation technicians | Include overtime and supervision? |
| Spare parts and materials | Bearings, seals, gearbox parts, lubricants, electrical components | Issued from stock or purchased direct? |
| Wear parts | Mill liners, grinding media, roller tires, crusher parts, refractory | Treated as maintenance or capital? |
| Contractor services | Specialist repairs, shutdown crews, inspections | Include contractor supervision and mobilization? |
| Shutdown and overhaul work | Annual kiln stop, mill relines | Spread over years or booked in the stop year? |
| Condition monitoring and tools | Sensors, thermography, vibration services | Included in maintenance or in technology budget? |
| Maintenance support | Planning, stores, CMMS, training | Direct cost or allocated overhead? |
Choosing the Denominator
Use the denominator that matches the area being measured, and keep the same definition across all periods.
Why Raw Comparisons Mislead
- Plant age and equipment condition
- Kiln technology and capacity
- Fuel mix and raw material abrasiveness
- Utilization: low volume raises cost per tonne
- Capital versus expense rules for wear parts
- Currency, inflation, and local labor cost
- Outage year versus non-outage year
- Compare against replacement asset value
- Use multi-year averages to smooth outages
- Convert costs to constant prices
- Separate wear parts from other spares
- Normalize by capacity utilization
- Group comparable plants into peer sets
Start With Reliable Maintenance Cost Records
Benchmarking is only as good as the underlying data. Track labor, parts, and contractor cost by asset with Oxmaint.
A Step-by-Step Benchmarking Process
Cost per Tonne by Plant Area
A single plant-wide number hides where the money goes. Break it down by area and look at share of total cost.
| Area | Main cost drivers | Questions to ask |
|---|---|---|
| Quarry and crushing | Crusher wear parts, conveyors, mobile equipment | Are wear parts replaced by condition or by schedule? |
| Raw material grinding | Mill liners, rollers, gearboxes, motors, fans | How does wear life compare with tonnage processed? |
| Pyroprocessing | Refractory, kiln drive, fans, cooler, burner | How much of cost is planned outage versus breakdown? |
| Cement grinding | Mill internals, grinding media, separators, drives | Is cost stable or rising with output? |
| Packing and dispatch | Packers, bag handling, loading systems | Is repair cost increasing with age? |
| Utilities and general plant | Compressors, water systems, electrical distribution | Are repairs increasing or planned work decreasing? |
Planned Versus Unplanned Cost Mix
Two plants with the same cost per tonne can have very different reliability. Look at how the money is spent.
A falling cost per tonne driven by deferred planned work is not an improvement. It often precedes higher emergency cost.
Link Cost to Reliability, Not Only to Budget
| Pair this cost metric | With this reliability metric | What you learn |
|---|---|---|
| Maintenance cost per tonne | Unplanned downtime hours | Whether lower cost is costing availability |
| Cost by area | Failure count by area | Where spending is not improving reliability |
| Spare parts cost | Inventory turns and stockouts | Whether stock is balanced |
| Contractor cost | Repeat failures after contractor work | Quality of outsourced repairs |
| Wear part cost | Wear life per tonne processed | Whether materials and settings are performing |
Cost per tonne tells you what was spent. Reliability data tells you what it bought.
Using Replacement Asset Value as a Reference
Maintenance cost as a share of estimated replacement asset value is widely used to compare plants of different size and age.
- Estimate replacement value consistently, using the same method every year.
- Compare plants only when valuation methods match.
- Track the ratio over time, since sharp changes signal aging or underinvestment.
- Use it alongside cost per tonne, not instead of it, and explain large movements in the monthly report.
It is also useful in capital planning. Rising maintenance cost against asset value may support replacing a high-cost machine.
How Oxmaint Supports Maintenance Cost Benchmarking
Oxmaint is maintenance management software. It holds the asset-level cost records that make benchmarking traceable, while production tonnes and finance data come from other systems.
- Asset hierarchy by plant, area, line, and equipment, so cost rolls up the same way you benchmark.
- Work orders with labor hours, parts used, contractor cost, and downtime.
- Work type classification for preventive, corrective, condition-based, and emergency work.
- Inventory records showing parts issued to each asset and work order.
- Cost and failure history by asset, to support repair-or-replace decisions.
- Reports and dashboards for cost by area, planned share, repeat failures, and overdue work.
Before and After: Moving From Totals to Traceable Cost
- One plant figure each year
- No split by area or work type
- Contractor and spare cost mixed
- Cannot explain a rise or fall in cost
- Targets set from last year budget
- Monthly cost by area and asset
- Planned, condition, and emergency work separated
- Contractor, parts, and labor visible
- Drivers explained from work orders
- Targets tied to reliability and cost data
KPIs to Report Alongside Cost per Tonne
| KPI | Why report it |
|---|---|
| Maintenance cost as share of replacement asset value | Normalizes for plant size and age |
| Planned work share of hours and cost | Shows maturity of the program |
| Emergency cost share | Tracks cost of unplanned events |
| Spare parts inventory value and turns | Highlights excess or shortage |
| Wear life per tonne processed | Tests wear part performance |
| Backlog of deferred work | Shows hidden future cost |
Common Benchmarking Pitfalls
Worked Example: Normalizing for an Outage Year
The figures are hypothetical and show the method, not a benchmark.
| Item | Year 1 (no kiln stop) | Year 2 (major kiln stop) | Comment |
|---|---|---|---|
| Production | Normal | Normal | Same output basis |
| Routine maintenance cost | Baseline | Close to baseline | Underlying trend stable |
| Shutdown cost | Low | High, one-time | Drives the raw increase |
| Raw cost per tonne | Lower | Higher | Looks like a deterioration |
| Two-year average cost per tonne | Shared | Shared | Better basis for comparison |
Reporting routine and shutdown cost separately, and also as a multi-year average, avoids false alarms in outage years and false comfort in quiet years.
Treating Wear Parts Properly
Wear parts are among the largest maintenance costs in cement and depend heavily on tonnage and raw material. Track them with their own measures.
- Record wear life in tonnes processed, not only in months in service.
- Compare wear cost per tonne by supplier, alloy, and operating setting.
- Separate planned replacement from early failure, since the causes differ.
- Link wear measurement results to replacement decisions in the work order.
- Photograph worn parts at removal and attach the images to the work order, so later reviews can check why a part was replaced.
- Review wear part cost per tonne beside cost of other maintenance, so a rising wear bill does not look like poor maintenance.
- Keep supplier trial results in the asset history, including operating conditions, so a longer wear life can be credited to the right cause.
Wear-part benchmarking often gives plants their clearest savings, because small improvements in life repeat on every replacement.
In-House Labor Versus Contractors
- Cost per job and per hour
- Repeat work after contractor repairs
- Time to mobilize for urgent jobs
- Safety performance and permit compliance
- Wrench time and planned labor share
- Overtime hours and emergency callouts
- Skill coverage for critical equipment
- Backlog and response time
Compare total cost and repeat failure rate, not only the hourly rate, before deciding which work to outsource.
Spare Parts Inventory and Its Effect on Cost
- Excess stock ties up cash and may become obsolete, but it is not always visible in maintenance cost per tonne.
- Stockouts raise emergency freight, overtime, and downtime cost.
- Critical spares should be held based on failure consequence and lead time, not only usage rate.
- Review slow-moving items annually and decide to use, return, or write off, and record the decision against the item.
- Link parts usage to work orders so stock decisions rest on real consumption.
Report inventory value and turns next to cost per tonne. A plant can lower its yearly spend by running down stock, which only shifts cost into a future outage.
Setting Targets by Area
Cost Data Quality Checklist
- Every work order is linked to the correct asset and area.
- Labor hours are booked to work orders, not to general codes.
- Parts issues are charged to work orders at the time of use.
- Contractor invoices are matched to work orders and assets.
- Capital and operating spend follow written rules.
- Work type is recorded: preventive, corrective, condition-based, or emergency.
- Monthly cost is reconciled with finance before reporting.
Fixing booking discipline for a few months usually improves benchmarking quality more than any new calculation.
First 90 Days of a Benchmarking Program
Trends Affecting Cement Maintenance Cost
- Alternative fuels: different fuel mixes can change wear and buildup in kilns and preheaters, which shifts maintenance cost.
- Energy and emissions projects: new equipment adds assets and tasks that must be maintained.
- Condition-based maintenance: shifts spend from calendar tasks to targeted work.
- Group-level benchmarking: multi-plant companies compare cost and reliability through shared definitions.
- Digital records: mobile work orders improve cost capture and reduce unbooked labor, which makes area comparisons more accurate.
- Lifecycle thinking: plants increasingly compare maintenance cost with replacement and upgrade cost when deciding whether to keep running an old machine.
Maintenance Cost per Tonne Questions
Know Exactly Where Your Maintenance Money Goes
Turn work orders, parts, and contractor jobs into cost data you can trace and benchmark. Start building it in Oxmaint.