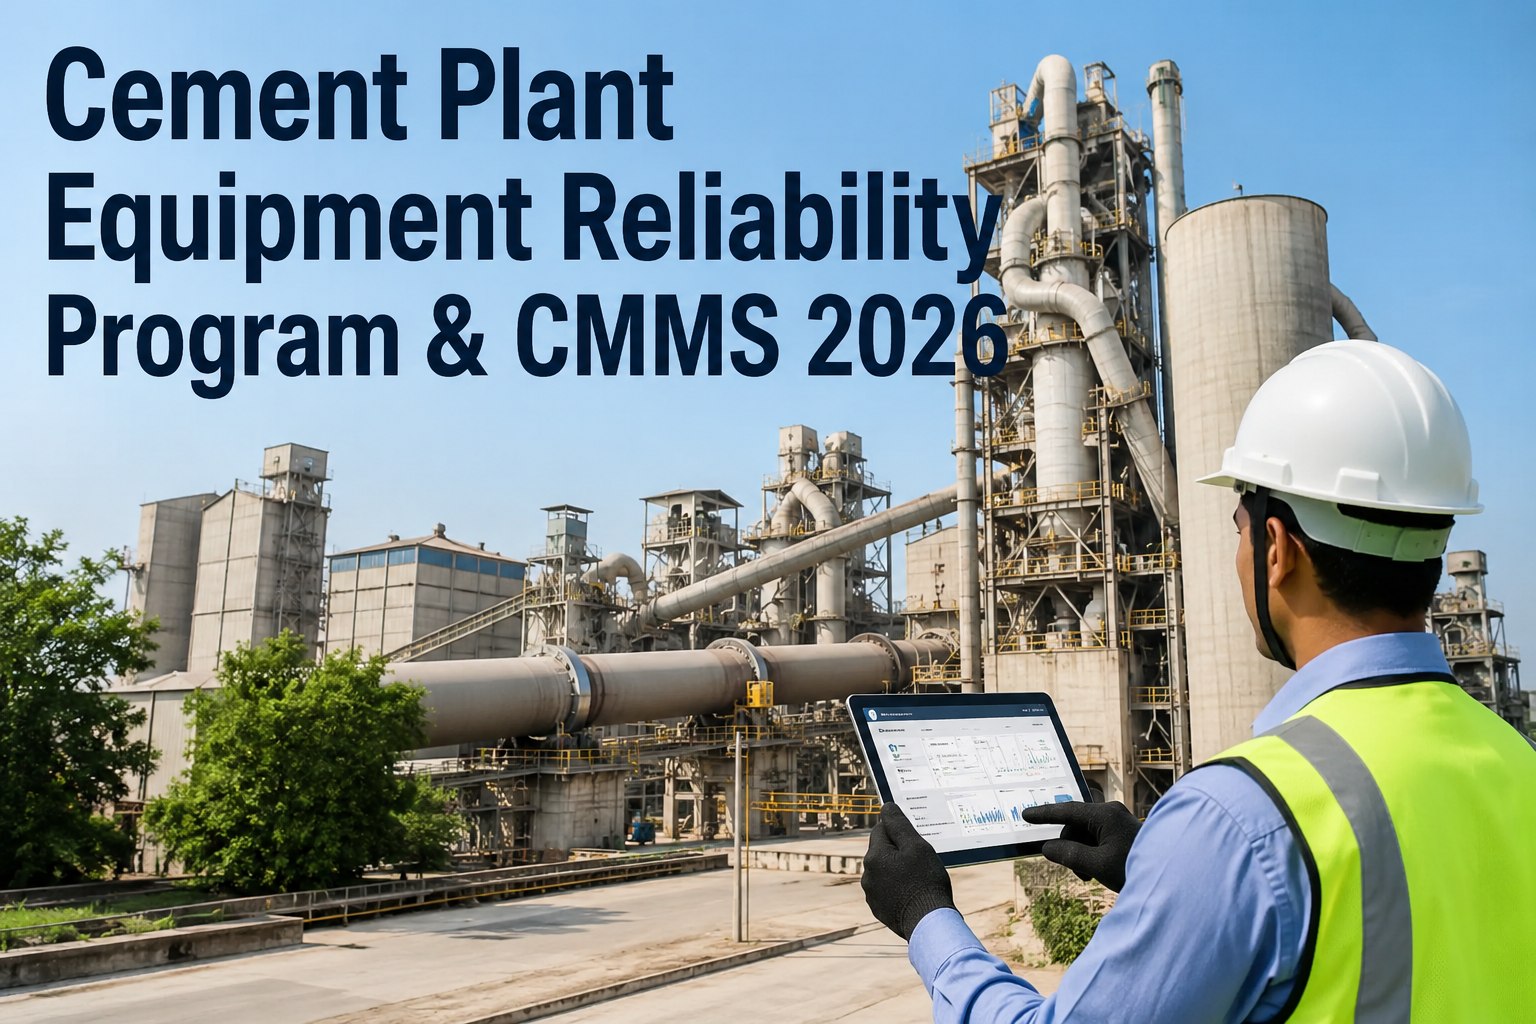
Most cement plants can report how many preventive maintenance tasks were completed last month. Far fewer can say whether those tasks reduced failures, found problems early, or were worth the labor. PM effectiveness measurement closes that gap by testing each part of the program: whether work is done, done well, aimed at the right failure modes, and delivering lower downtime and cost. This framework gives cement maintenance teams a practical way to measure and improve, with maintenance management software supplying the records it depends on.
Cement Plant PM Effectiveness Measurement Framework
Measure whether preventive maintenance actually prevents failures in kilns, mills, fans, and conveyors, and decide which tasks to keep, change, or remove.
Why Completion Rates Hide the Real Picture
A plant can complete almost every scheduled task and still suffer repeated breakdowns. High completion proves activity, not value.
- Tasks completed on time
- Hours spent on PM
- Number of inspections done
- Did PM find faults before failure?
- Did failures fall on covered equipment?
- Did the work justify its cost and downtime?
The framework below measures both, starting with execution and moving up to value.
Level 1: Execution Metrics
If tasks are not done on time, nothing else can be judged. Execution metrics show whether the program is operating as planned.
| Metric | Definition | What a poor result suggests |
|---|---|---|
| PM compliance | PM tasks completed divided by PM tasks scheduled in the period | Resource shortage, access problems, or unrealistic schedules |
| On-time completion | Tasks finished within the allowed window around the due date | Planning gaps or conflicting priorities |
| PM backlog | Overdue PM tasks, in count and in labor hours | Persistent under-resourcing or too many low-value tasks |
| Critical asset PM coverage | Share of critical equipment with a current PM plan | Gaps on kilns, mills, and key fans |
| Planned labor share | Share of maintenance hours spent on planned work | Reactive firefighting crowding out PM |
| Task closure quality | Tasks closed with readings, findings, and comments | Checklists treated as a formality |
Make PM Data Measurable
Capture task results, readings, and findings in every PM work order, so effectiveness can be measured from real records. Start with Oxmaint.
Level 2: Quality Metrics
Quality metrics test whether each PM task is useful. A task that never finds anything may be unnecessary, and one that causes faults may be harmful.
Level 3: Outcome Metrics
Outcome metrics show whether equipment is more reliable. Compare covered equipment over time, and compare similar assets with different PM approaches.
| Metric | How to use it | Caution |
|---|---|---|
| Failure count by asset class | Compare before and after PM changes | Normalize for running hours |
| MTBF | Mean time between failures for key equipment | Needs consistent failure definition |
| Repeat failure rate | Same failure mode on the same asset within a set window | Shows weak root cause correction |
| Unplanned downtime hours | Stoppage due to breakdown, by area | Separate kiln, mills, fans, and conveyors |
| Planned versus unplanned work ratio | Trend over quarters | Do not count deferred PM as planned work |
| Emergency work orders | Count and cost of urgent repairs | Needs a clear emergency definition |
Level 4: Value Metrics
Value metrics are estimates that depend on your cost model. Be open about assumptions, and avoid claiming savings that cannot be traced to records.
Diagnosing a PM Program That Is Not Working
When failures continue despite high compliance, trace the problem through these questions in order.
Task Review: Keep, Change, Convert, or Remove
| Finding | Decision | Example in cement |
|---|---|---|
| Task finds real issues and ties to a failure mode | Keep | Gearbox oil sampling on main drives |
| Task is useful but timed badly | Change interval | Fan bearing lubrication adjusted for dust and duty |
| Failure is detectable by a measurable condition | Convert to condition-based | Fixed-time bearing replacement replaced by vibration trend |
| Task never finds anything and has no link to a failure mode | Remove after review | Duplicate visual check on a low-criticality conveyor |
| Task causes errors or needs special skill | Revise procedure or training | Complex alignment steps on a mill drive |
| No task exists for a recurring failure | Add task | Repeated seal failures on a cooler fan |
Review tasks with the people who do the work. Technicians often know which checks are useful and which are routine habit.
Cement-Specific Factors That Affect PM Results
What Data You Need and Where It Comes From
- Asset register with criticality, area, and running hours.
- PM plans with task steps, intervals, and failure modes addressed.
- Completed work orders with dates, labor, parts, readings, and comments.
- Failure records with cause codes and downtime hours.
- Production data to normalize failures by running time or throughput.
- Cost data for labor, parts, and contractors, linked to assets.
If failure codes are inconsistent, spend the first month fixing them. Every outcome metric depends on them.
How Oxmaint Supports PM Effectiveness Measurement
Oxmaint is maintenance management software, and the records it holds are the raw material of this framework.
- Preventive maintenance schedules by calendar, meter reading, or running hours, with due dates and compliance tracking.
- Task checklists that capture readings, findings, and comments at closure.
- Work orders that link follow-up repairs to the PM that found them.
- Asset records with criticality, history, and failure details.
- Inventory and cost tracking for parts and labor used in PM and repairs.
- Dashboards and reports for compliance, backlog, planned versus unplanned work, repeat failures, and downtime.
- Mobile access so technicians complete and close tasks at the equipment.
A Monthly and Quarterly Review Rhythm
Scorecard Template for Each Area
| Area | Compliance | Backlog hours | PM yield | Unplanned downtime | Repeat failures | Action |
|---|---|---|---|---|---|---|
| Quarry and crushing | Fill from records | Fill from records | Fill from records | Fill from records | Fill from records | Owner and date |
| Raw and cement mills | Fill from records | Fill from records | Fill from records | Fill from records | Fill from records | Owner and date |
| Kiln and cooler | Fill from records | Fill from records | Fill from records | Fill from records | Fill from records | Owner and date |
| Packing and dispatch | Fill from records | Fill from records | Fill from records | Fill from records | Fill from records | Owner and date |
Use the same columns every month so trends are visible, and require an owner and a date for every action.
Common Measurement Mistakes
- Reporting compliance as proof of reliability
- Counting deferred tasks as completed
- Mixing planned and emergency work in one category
- Ignoring running hours when comparing failures
- Changing intervals without recording why
- Reporting compliance next to outcomes
- Closing only tasks that were actually done
- Keeping clear work type definitions
- Normalizing failures by running time
- Recording every strategy change in the asset history
Targeting PM by Criticality
Measuring every asset equally wastes effort. Rank equipment by consequence of failure, then set measurement depth accordingly.
Criticality should consider safety, environmental risk, production loss, repair cost, and lead time for spare parts.
Worked Example: Reviewing a Fan Bearing PM
The numbers are hypothetical and show the reasoning, not a benchmark.
| Question | Evidence in records | Conclusion |
|---|---|---|
| Is the task done? | Completed on time in nearly every cycle | Execution is healthy |
| Does it find issues? | Few findings across many cycles | PM yield is low for the current task content |
| Do failures still occur? | Bearing failures on the same fan, often between PMs | Task does not detect the real failure mode |
| Can the failure be detected earlier? | Vibration and temperature rise in the weeks before failure | Condition monitoring is a better fit |
| Decision | Keep lubrication task, add vibration route, plan bearing change by trend | Records support the change |
After the change, track repeat failures on this asset for several quarters before concluding that the new approach works.
Failure Coding That Makes Metrics Reliable
| Field | Purpose | Good practice |
|---|---|---|
| Asset and component | Locates the failure | Use the asset register, not free text |
| Failure mode | Describes how it failed, such as bearing seized or seal leaking | Short standard list used by all technicians |
| Cause | Explains why, such as lubrication, wear, misalignment | Fill after inspection, not only at breakdown |
| Detection method | Shows how the issue was found | Inspection, condition monitoring, operator report, or breakdown |
| Downtime and cost | Quantifies impact | Record start and end times, parts, and labor |
The detection method field is especially useful. It shows which tasks and technologies actually find problems early.
Planning PM Around Shutdowns
- Group tasks that need kiln or mill stops into planned outage packages, with materials and permits ready in advance.
- Measure shutdown work completion separately from routine PM, since the constraints differ.
- Review carry-over tasks after every outage and ask why each was not done.
- Use inspection findings from running equipment to decide what to include in the next stop.
- Close shutdown work orders with findings, so the next plan is based on evidence.
- Track how many tasks were planned, completed, deferred, and added during the stop, and review the ratio each time.
Plants that connect running inspections to outage scope tend to avoid last-minute work and unplanned parts orders.
Who Owns PM Effectiveness
Trends in PM Optimization
- Condition-based conversion: more plants move selected tasks from fixed intervals to measured condition.
- Risk-based strategy: criticality and failure consequence guide task selection, not only manufacturer schedules.
- Mobile data capture: technicians record readings and photos at the asset, which improves data quality.
- Analytics on work order history: plants review closure data to find weak tasks and recurring failures.
- Integrated KPIs: PM metrics are reviewed with energy, cost, and production data in one meeting.
PM Effectiveness Questions
Measure What Your PM Program Actually Delivers
Give every task a result and every asset a history. Use Oxmaint to track compliance, findings, failures, and downtime in one place.