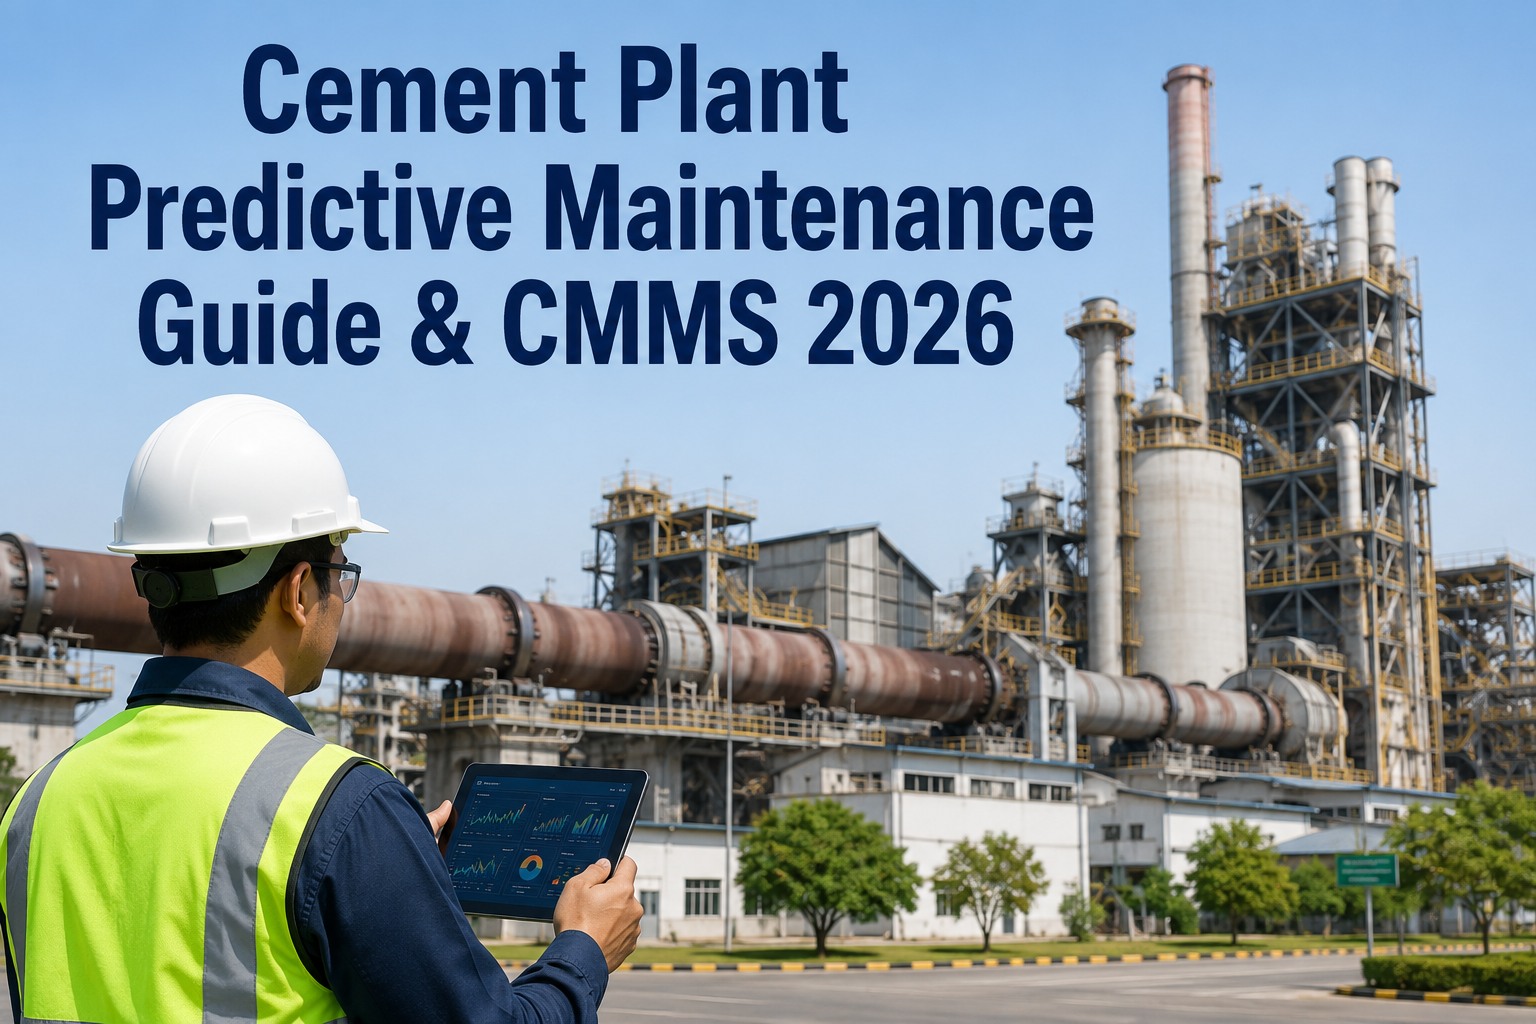
Cement manufacturing consumes more maintenance hours per ton of output than almost any other heavy industry, with a single kiln outage routinely costing $80,000–$250,000 per day in lost clinker production. The shift from time-based or reactive maintenance to predictive maintenance (PdM) — fed by vibration, oil, thermal, and IIoT sensors and unified inside a modern CMMS — is the single highest-ROI reliability upgrade available to a cement plant in 2026. This guide breaks down PdM techniques by asset class, the technology stack that makes them work, CMMS integration patterns, and the pilot-to-scale roadmap that consistently moves plants from firefighting to condition-based maintenance. Ready to see it on your assets? Start Free Trial and connect your first kiln in under an hour.
Is your cement plant still running bearings to failure while competitors predict them 14 days out?
Vibration, oil, thermal and IIoT data — unified inside a CMMS-connected reliability program — routinely cut unplanned downtime 25–45% and shrink maintenance spend by 18% within the first 12 months. The plants that win in 2026 are the ones that stopped guessing.
The maintenance economics every cement plant manager should know
A typical 1.8 Mt/yr cement plant carries 1,400–2,200 maintainable assets, spends 3.2–4.5% of replacement-asset-value (RAV) on maintenance annually, and loses 110–180 hours per year to unplanned downtime. Predictive maintenance attacks the most expensive third of that loss.
A single missed preheater fan bearing costs more in 36 hours of lost production than the entire annual PdM sensor budget. The math is not close.
Where to instrument first — the cement asset priority map
Not every asset deserves a sensor. Rank by criticality (impact on production), redundancy (is there a spare?), and failure predictability. The four asset classes below account for 70–85% of all unplanned cement downtime — instrument them first.
Rotary kiln — shell, tires, thrust rollers
Criticality: CriticalInfrared shell scanning + tire migration measurement + pinion vibration. Predict tire creep excursions, shell hot spots, and refractory degradation 7–21 days before they force an outage. Target OEE gain: 3–5 points.
Ball & roller mills — trunnion bearings, girth gear
Criticality: CriticalContinuous vibration on trunnion + slide-shoe bearings, oil particle on gear spray lubrication, and motor current signature analysis. The single highest-payoff PdM target in grinding — a trunnion failure is a 6-week outage.
Crushers (hammer, impact, roll) — bearings, rotor
Criticality: HighVibration on rotor bearings with envelope detection for early bearing-element wear, plus motor torque signature for hammer wear. Detect a cracked hammer or degraded bearing 5–10 days before vibration trips the safety shutdown.
Preheater & cooler fans, ID fans
Criticality: CriticalWireless vibration on fan bearings + blade-pass frequency trending for fouling/build-up detection + motor thermal. Fans fail from imbalance caused by dust build-up; PdM catches it before the 2× line-frequency trip, avoiding a 12-hour kiln ramp-down.
What a connected PdM + CMMS program actually pays back
The numbers below use a worked example: a 180-asset plant (1 kiln, 2 cement mills, 4 crushers, 12 fans) spending $42K/year on reactive maintenance labor + parts, losing 140 hours/year to unplanned downtime at $9,500/hr lost margin.
| Scenario | Annual downtime hrs | Downtime cost | Maint. spend | Net PdM benefit |
|---|---|---|---|---|
| Reactive (baseline) | 140 | $1,330,000 | $42,000 | — |
| Time-based PM only | 118 | $1,121,000 | $46,000 | $205,000 |
| PdM + CMMS (partial) | 98 | $931,000 | $37,000 | $404,000 |
| PdM + CMMS (full scale) | 91 | $864,500 | $34,440 | $473,060 |
The rollout sequence that consistently delivers 35% downtime cut by month six
Plants that try to instrument everything in month one stall on integration debt. The sequence below — proven across 20+ cement rollouts — front-loads the single highest-criticality asset, proves the CMMS loop, then scales.
Criticality assessment & baseline
Rank all 1,400+ assets on a criticality × redundancy × predictability matrix. Pick the top 30–50 (kiln, mills, ID fans, crushers). Capture 30-day baseline vibration, oil, and process data. ISO 14224 failure coding setup in CMMS.
Pilot — kiln + 1 mill + 2 fans
Install wireless vibration + IR shell scan + oil sensors on the pilot cluster. Connect to CMMS via OPC UA / MQTT. Define alert thresholds (ISO 10816) and auto-generate work orders on alarm. First predicted failure targeted within 30 days.
Close the loop — first PdM win
Validate the first 2–3 predictions against physical inspection. Tune thresholds to cut false alarms under 10%. Reliability engineers review weekly PdM dashboard inside CMMS. Document downtime-hours-avoided per catch.
Scale to all critical assets
Extend sensor coverage to the remaining top-50 assets. Retire 20–30% of calendar-based PMs that PdM now supersedes. Train shift mechanics on condition-based work order flow. KPI: % PMs converted to condition-based.
AI failure-mode models live
Switch from threshold-only alerts to ML failure-mode classification (bearing outer-race, imbalance, misalignment, looseness). Models trained on 90 days of labeled data. Mean time-to-failure prediction ±3 days on critical assets.
Full program — measure & expand
Report OEE lift (target +3 points), unplanned downtime cut (target 30–35%), and maintenance spend reduction (target 15–18%). Expand to secondary assets: conveyors, bucket elevators, packers. Annual reliability review cycle begins.
Stop running your kiln on a calendar. Run it on condition.
Connect your first 10 critical assets in under a week and catch your next bearing failure before it catches you.
Cement plant PdM — the questions reliability leads ask first
How many sensors does a typical cement plant need for an effective PdM program?
A 1.8 Mt/yr integrated plant generally needs 80–160 wireless vibration sensors, 12–20 online oil monitors, and 4–8 thermal points (kiln shell, preheater) to cover the critical 20% of assets that drive 80% of downtime. Total sensor investment runs $45,000–$110,000, with payback typically inside 4 months from a single avoided kiln outage.
Can a PdM program integrate with the CMMS we already run?
Yes — a modern PdM platform connects to any CMMS that exposes a REST API or supports OPC UA / MQTT. Vibration and oil alerts auto-generate work orders with the asset, failure mode, and recommended action pre-filled. If your CMMS lacks an API, you can pilot the workflow on a connected system like OxMaint — Book a Demo to see the two-way sync live.
What is the false-alarm rate, and how do we keep it low?
A well-tuned cement PdM program holds false alarms under 10% after the first 60 days of threshold tuning. The key is starting with ISO 10816/20816 baseline thresholds, then refining per-asset using your own 30-day baseline data — not generic vendor defaults. ML failure-mode classifiers further cut false alarms by distinguishing real faults from process-induced vibration.
How long before we see the first predicted failure and ROI?
Most cement plants catch their first PdM-predicted failure within 30–45 days of pilot go-live — typically a fan bearing or mill trunnion showing early outer-race wear. First-year ROI ranges from 8× to 14× depending on plant size and baseline downtime. The full payback period averages 1.3–2.4 months on a single avoided kiln outage.
Do we need data scientists or reliability engineers to run the program?
No. A good PdM + CMMS platform delivers pre-built cement failure-mode models and turns raw sensor data into plain-English work orders ("trunnion bearing outer-race fault, RUL 9±3 days, plan replacement"). One reliability technician can manage a 200-asset program in under 4 hours/week. You can Start Free Trial and validate this workflow on your own assets before committing.
Your next kiln outage doesn't have to be a surprise.
Join the cement plants that moved from reactive firefighting to condition-based reliability in 2026. Set up your first asset in under an hour — no consultants, no long procurement cycle.
Free 14-day trial · No credit card