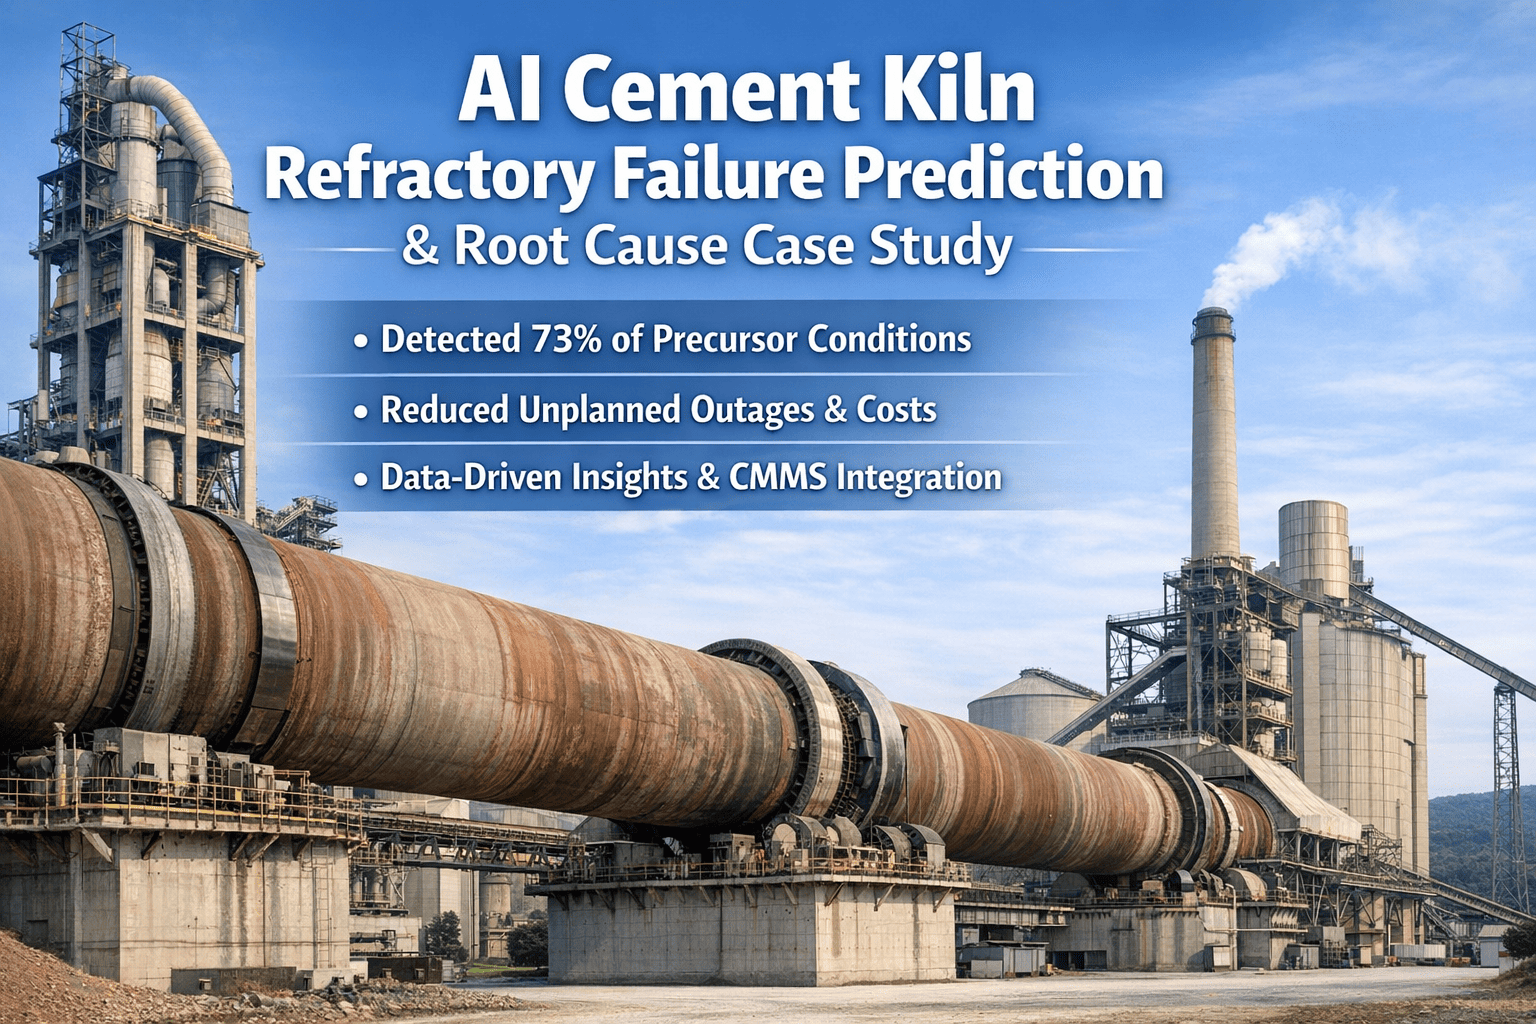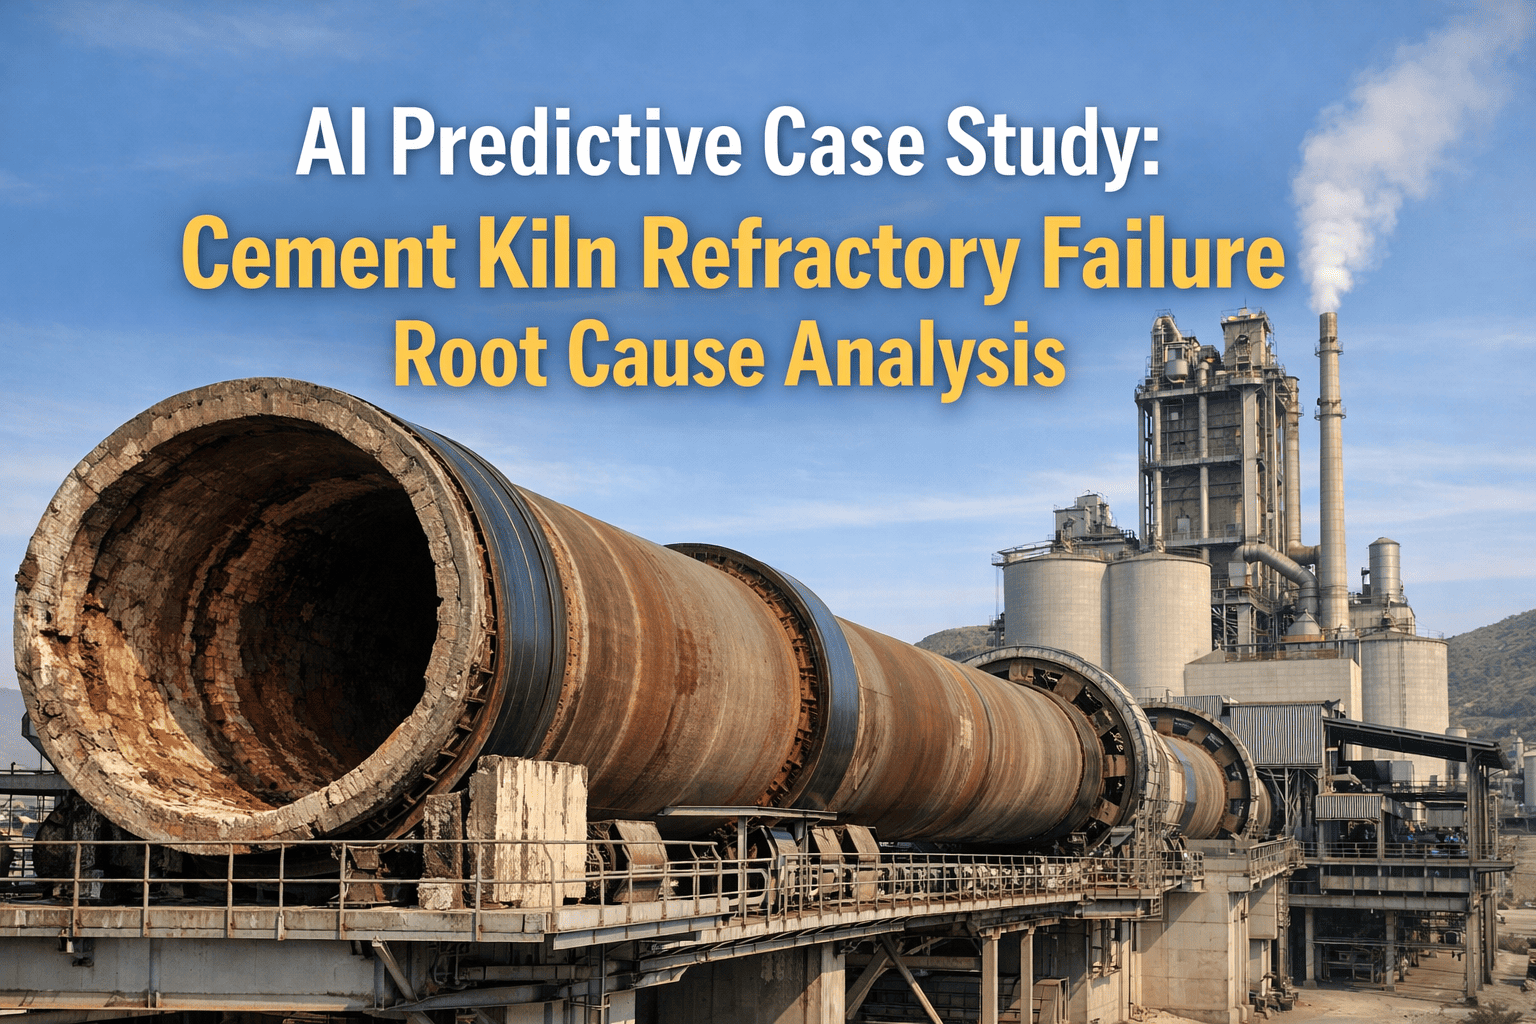
A rotary kiln's refractory lining is one of the most expensive consumables in a cement plant, and also one of the hardest to plan around. Burning-zone brick, transition-zone spinel, and preheater castable each wear at different rates, driven by flame temperature, alkali chemistry, and mechanical flexing of the shell. Most plants still schedule relines against a fixed campaign length borrowed from an OEM manual, which means good lining gets pulled early in some zones while a worn zone in another runs uncomfortably close to shell exposure. This guide walks through how remaining useful life prediction actually works for kiln refractory, what data it needs, and how a connected CMMS turns wear measurements into a defensible reline date instead of a guess.
Stop Relining Your Kiln By The Calendar Instead Of The Wear Curve
Burning zone, transition zone, and preheater brick each degrade on a different clock. A zone-by-zone RUL model turns shell scans and inspection data into a reline date your planning team can actually schedule around.
Refractory Is One Of The Largest Controllable Costs On A Kiln Line
A full reline on a large kiln can run into the millions once brick, labor, and lost production are added together, and the shutdown itself typically removes the kiln from service for several days. Because that cost is so concentrated into one event, plants tend to treat the reline date as fixed rather than something that can be actively managed.
Clinker production does not pause gracefully while the shutdown is underway either. Downstream grinding and packing schedules have to be adjusted around the outage window, spare capacity at a sister kiln may need to absorb demand, and the shutdown crew itself is a scarce, contracted resource that has to be booked well in advance. Every week the reline date shifts unexpectedly, whether earlier or later than planned, ripples through all of that scheduling. A wear-based forecast that updates continuously gives the planning team a moving target they can track, instead of a fixed date that either holds or breaks with no warning in between.
The gap between what a fixed schedule assumes and what the brick is actually doing is where a remaining useful life program pays for itself, whether that shows up as extra campaign days recovered or as an emergency breakout avoided entirely.
A Single Campaign Number Hides Five Different Wear Curves
Refractory does not fail as one lining — it fails zone by zone, and each zone has its own chemistry, temperature swing, and mechanical load. Applying one campaign-length figure to the whole kiln is administratively simple, but it consistently gets two things wrong at once.
A zone still has 20–30% of usable brick life left when the calendar date arrives, and that lining is discarded along with everything else during the shutdown.
A faster-wearing zone crosses into shell-exposure risk before the scheduled date, forcing an emergency stop that costs far more than a planned reline.
Neither outcome is visible until it happens, because most plants only track lining age in months, not lining condition in millimeters of remaining brick. That gap is exactly where a remaining useful life program earns its keep — talk to a specialist about building a zone-level model for your kiln.
What Actually Degrades Each Section Of The Kiln
Before a wear model means anything, the failure mechanism driving each zone needs to be understood on its own terms. Alkali attack behaves nothing like mechanical abrasion, and both behave nothing like thermal spalling.
The burning zone sees the highest temperatures on the kiln and typically wears fastest, since repeated thermal cycling causes the coating layer that protects the brick to form and shed, gradually exposing fresh refractory to peak flame temperature each time. The transition zones sit at the boundary where volatile alkali compounds condense out of the gas stream, so those bricks face a slower but chemically aggressive attack that can undermine brick strength well before visible thinning shows up on a thickness gauge.
| Zone | Refractory Type | Dominant Wear Mechanism | Typical Lining Life |
|---|---|---|---|
| Inlet / Preheater | Dense castable, 42% alumina brick | Raw meal abrasion, inlet seal cycling | 18–36 months |
| Upper Transition | 70% alumina or spinel brick | Alkali salt infiltration (K₂O, Na₂O, SO₃) | 12–24 months |
| Burning Zone | Magnesia-spinel, doloma brick | Thermal spalling, clinker coating loss | 9–18 months |
| Lower Transition | Spinel or high-alumina brick | Mechanical flex, chemical attack | 12–24 months |
| Outlet / Nose Ring | Castable, silicon carbide brick | Abrasion from clinker discharge | 10–20 months |
Three Data Sources Feed A Usable RUL Model
A remaining useful life estimate is only as good as the wear data behind it. Three measurement streams, layered together, give a model enough signal to be trusted for shutdown planning.
Weekly infrared scans at fixed intervals around the shell circumference are the earliest indicator of brick thinning. A steady upward trend at a given point, not a single hot reading, is what signals accelerating wear.
Laser profilometry or manual thickness checks during planned inspection windows give a direct millimeter reading of remaining brick, anchoring the model against the shell-temperature trend.
Feed rate swings, cold stops, and fuel mix changes each accelerate wear at a known rate. Logging these events against the affected zone lets the model account for damage that a temperature scan alone would miss.
No single stream is sufficient on its own. Shell temperature is continuous but indirect, since it reflects heat transfer through whatever brick remains rather than a direct thickness reading. Profile measurement is direct but only available during a planned inspection window, so it anchors the trend rather than tracking it day to day. Operating history explains the deviations that the other two streams would otherwise treat as noise, which is why a credible RUL model needs all three feeding the same zone record rather than living in separate spreadsheets kept by different teams.
From Wear Rate To A Reline Date In Four Steps
Plot successive thickness readings against operating days to calculate a millimeter-per-month wear rate specific to that zone, not the kiln as a whole.
Define the minimum safe brick thickness before shell exposure risk, typically with a margin built in for the interval between inspections.
Divide the remaining thickness above threshold by the current wear rate to produce a remaining-operating-days figure per zone, updated after every new measurement.
When the shortest-lived zone crosses a configurable lead-time threshold, a reline work order and shutdown planning task are generated automatically instead of waiting for a calendar date.
Every Extra Campaign Day Is Tonnes Of Clinker You Weren't Planning On
Oxmaint turns shell scans, thickness readings, and operating history into a zone-level remaining useful life estimate that updates automatically after every measurement upload.
Calendar-Based Relining vs Wear-Based Relining
What A Mature Refractory RUL Program Actually Delivers
Once zone-level tracking has been running through a few campaign cycles, the benefits stop being theoretical and start showing up in three places: the shutdown calendar, the reline budget, and the number of surprise stops the plant has to absorb.
None of this requires replacing existing inspection routines. It requires putting the readings that are already being collected into a system that tracks them per zone, trends them over time, and turns a crossed threshold into a work order automatically rather than a note in someone's inspection binder.
It also changes the conversation with brick suppliers. Once campaign history is logged consistently against each zone and each supplier, it becomes possible to compare how a given brick grade actually performed under this kiln's specific chemistry and operating pattern, rather than relying on the supplier's general life claims. That comparison is often the strongest lever a reliability team has for negotiating better material or catching a batch that is underperforming before it becomes the whole plant's problem.
How Oxmaint Supports A Refractory RUL Program
A wear model is only useful if it lives next to the work orders, inspection routes, and shutdown plans it is meant to drive. Oxmaint keeps refractory data, maintenance history, and scheduling in one connected asset record.
Each kiln zone is tracked as its own asset with brick type, install date, and thickness history, instead of one combined refractory record for the whole kiln.
Shell temperature scans and profile checks are scheduled as recurring mobile inspections, with results logged directly against the zone they were taken from.
Thickness and temperature trends are plotted per zone over time, making acceleration visible well before it reaches an alarm threshold.
When a zone's projected remaining life crosses a configured lead-time setting, a reline planning work order is generated automatically.
Every past reline, brick supplier, and installation crew is stored against the asset, so campaign-over-campaign comparisons reveal which suppliers actually perform.
Projected reline dates feed directly into shutdown and outage planning, so refractory work can be bundled with other planned maintenance instead of forcing a standalone stop.
Where Refractory RUL Programs Go Wrong Early On
Most plants that try to build a wear model run into the same handful of problems in the first year. Knowing them in advance saves months of rework on the model itself, and prevents the reliability team from losing credibility with operations the first time a forecast turns out to be wrong for a reason that was actually avoidable.
Blending thickness readings from the whole kiln into a single average wear rate hides the zone that is actually closest to threshold, which defeats the purpose of building a model in the first place.
Shell temperature readings taken from slightly different circumferential positions each week introduce noise that can mask a genuine wear trend for months before it becomes obvious.
A wear model built only from steady-state data will systematically underestimate remaining life after a string of cold stops or a sustained feed rate swing, unless those events are logged and factored in.
A dashboard that shows wear trends but does not automatically generate a planning work order at threshold still relies on someone remembering to check it, which reintroduces the exact risk the model was built to remove.
Refractory RUL Prediction, Answered
How much data is needed before a refractory RUL estimate is trustworthy?
A single shell scan combined with prior lining history is enough to start an estimate, though accuracy improves with each additional measurement cycle. Start a free trial to begin logging your first zone.
Does every kiln zone need the same inspection frequency?
No. Faster-wearing zones like the burning zone typically warrant more frequent scans than a slower-wearing inlet section, and a RUL program should weight inspection intervals accordingly.
Can a RUL model account for cold stops and feed rate swings?
Yes, when operating events are logged against the affected zone, the model can adjust the projected wear rate rather than assuming a constant curve.
How does zone-level tracking change reline shutdown planning?
Instead of one kiln-wide date, planning teams get a ranked list of which zones need attention first, letting a reline be scoped to only the zones that actually require it. Book a demo to see this in a live account.
What happens if a zone's wear rate suddenly accelerates?
A sustained deviation from the established trend line triggers an alert well before the projected failure date, giving planners time to move up the shutdown rather than react to a breakout.
Turn Wear Data Into A Reline Date You Can Plan Around
Oxmaint tracks zone-level wear, schedules inspection routes, and triggers reline work orders automatically as thresholds are crossed. No credit card required to start.