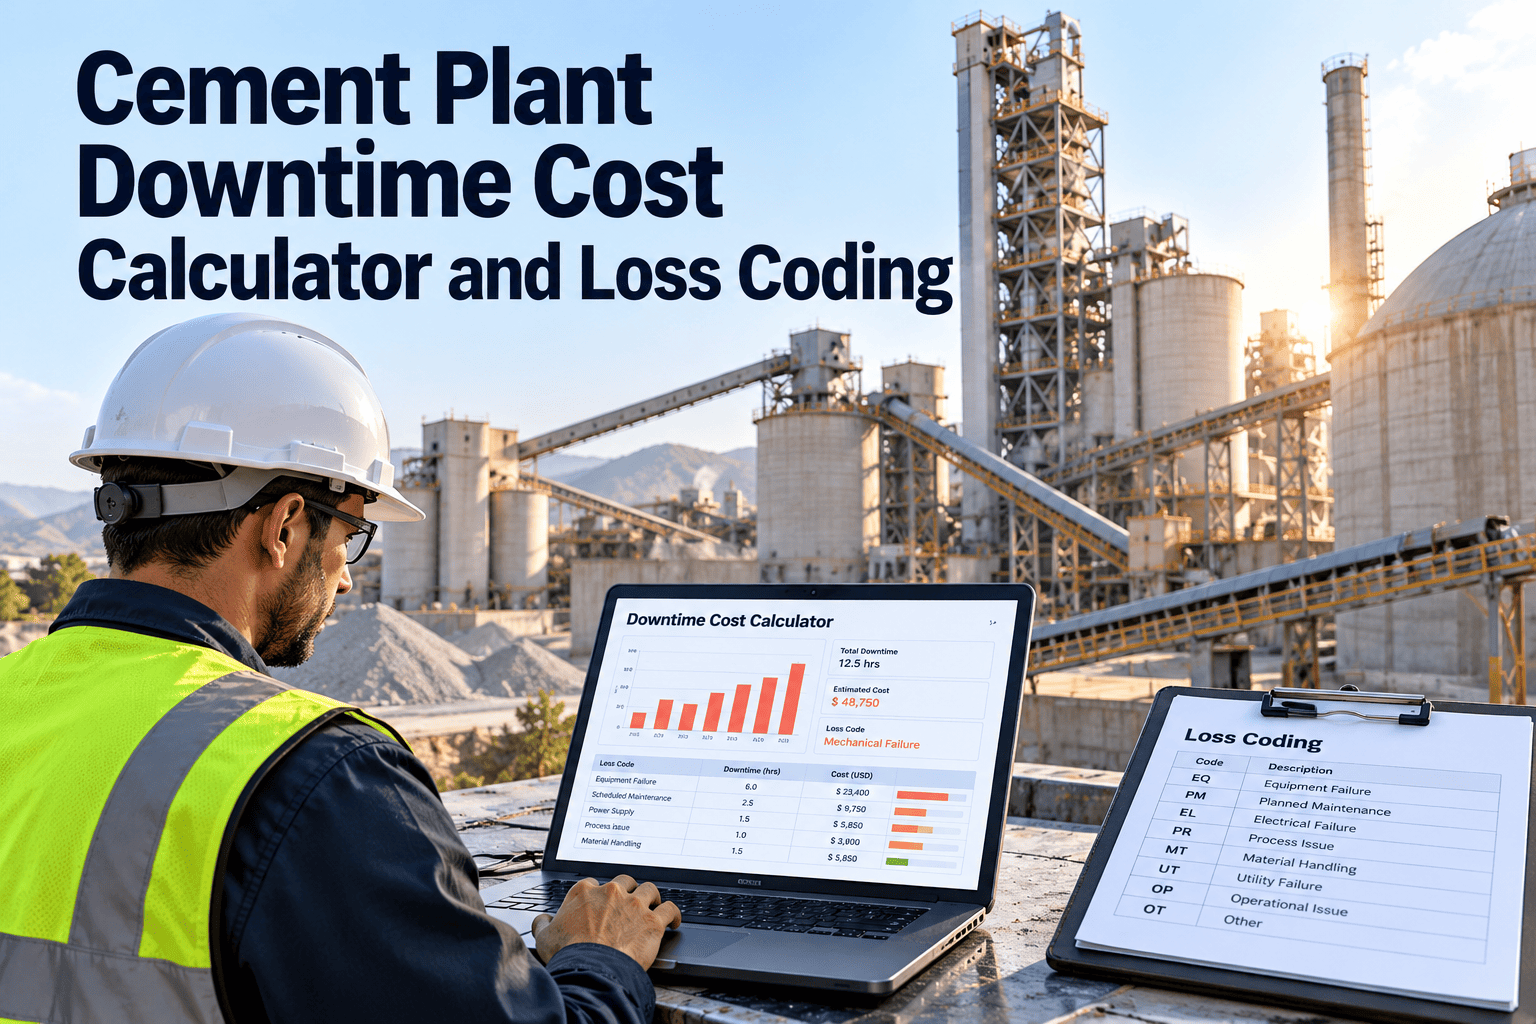
Cement plants that cannot precisely code production loss to its maintenance cause are flying blind on their reliability strategy. Every hour of unplanned kiln downtime costs ₹8–18 lakhs in lost clinker production — yet most plants aggregate all downtime into a single "breakdown" bucket that tells operations nothing about which assets, failure modes, or maintenance gaps are actually driving the most cost. OxMaint's production loss coding module lets your team tag every maintenance event with asset-level cause codes and production impact values in real time, converting raw downtime data into the analytics your plant manager and finance team need to make capital and maintenance budget decisions. Start coding your downtime free on OxMaint or book a 15-minute demo to see live production loss analytics.
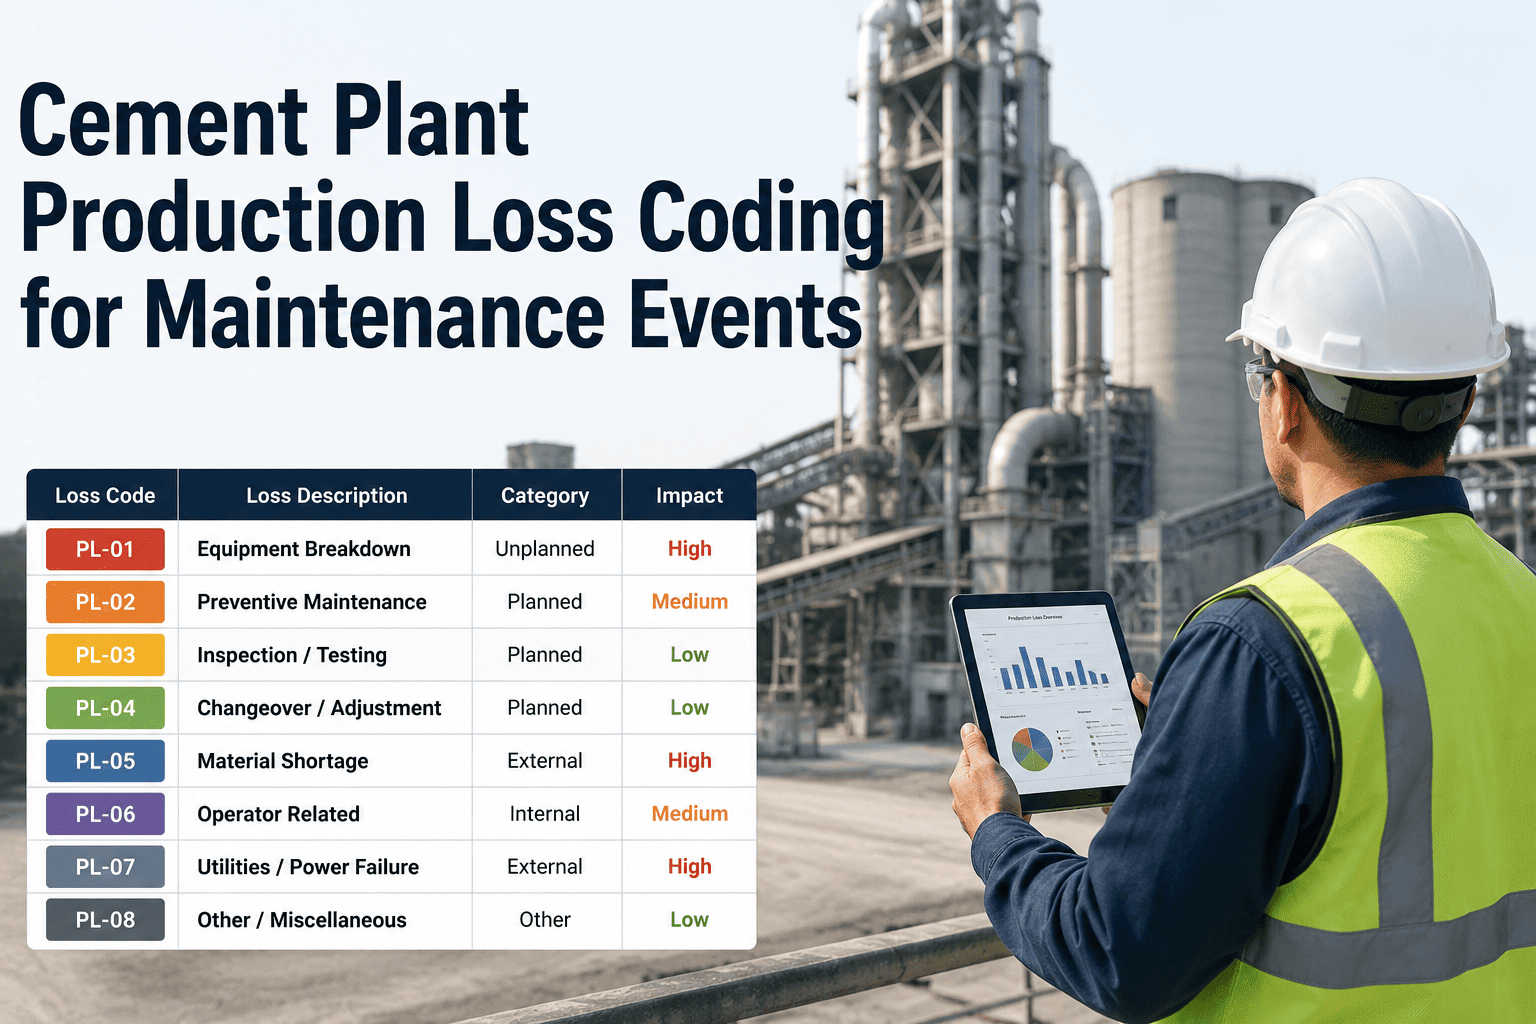
Cement Plant Production Loss Coding for Maintenance Events
Stop aggregating downtime. Start understanding exactly which assets, failure causes, and maintenance gaps are costing your plant the most — kiln event by kiln event.
What Most Cement Plants Cannot Answer — But Should
Ask a maintenance manager at a typical cement plant which three assets caused the most production loss in the past 12 months. Most cannot give a precise answer backed by data. They can point to memorable incidents — the kiln drive that failed in April, the VRM separator bearing from August — but they cannot rank them with costs attached, cannot show the trend, and cannot prove which corrective investments made a difference. This is the visibility gap that production loss coding closes.
The OxMaint Production Loss Coding Structure for Cement Plants
Effective production loss coding requires a framework that is detailed enough to drive decisions but simple enough that technicians complete it accurately on every work order. OxMaint uses a three-tier coding structure developed for cement plant operations.
Which major system or asset group caused the event
Root cause category of the maintenance event
Quantified production loss linked to the event
What the Analytics Dashboard Shows After 6 Weeks of Coded Events
Six weeks of consistently coded production loss events gives your maintenance and plant management team a Pareto-ranked view of where production losses are actually originating — and enough data to begin making evidence-based decisions about PM frequency, spare parts stocking, and capital replacement priorities.
Ranked bar chart showing total production loss in MT and ₹ by asset over the selected period. Identifies the top 3–5 loss contributors that account for the majority of total downtime cost.
Breakdown of total production loss by failure cause category. Shows whether lubrication failures, refractory wear, or electrical faults are the dominant loss driver — directing PM programme focus.
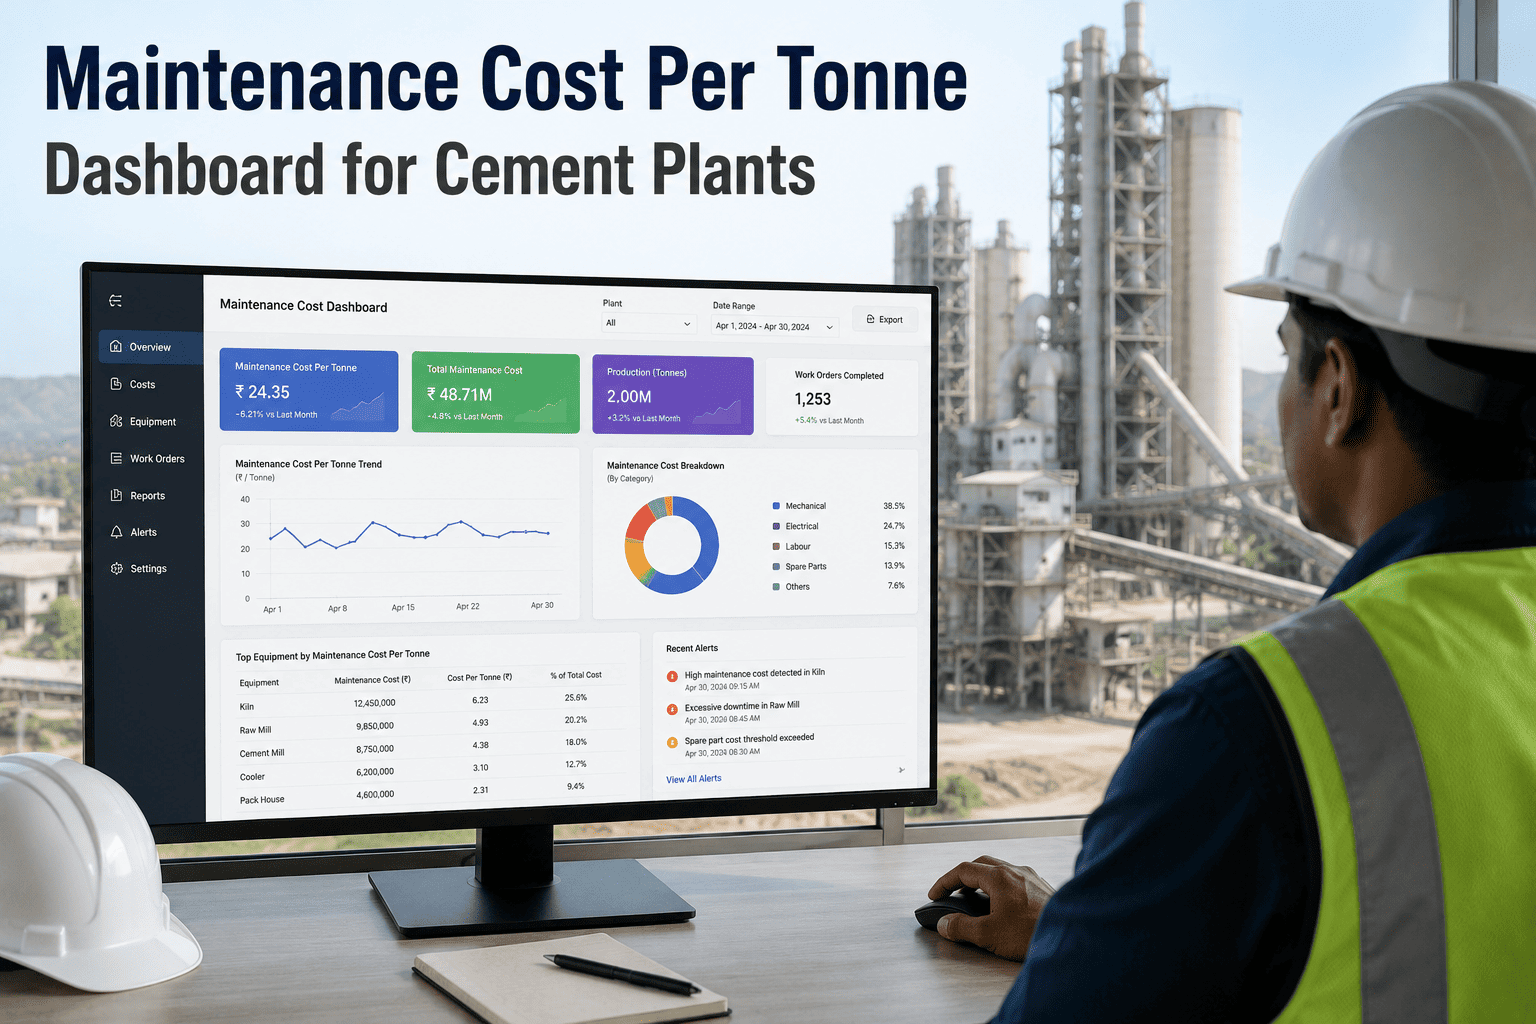
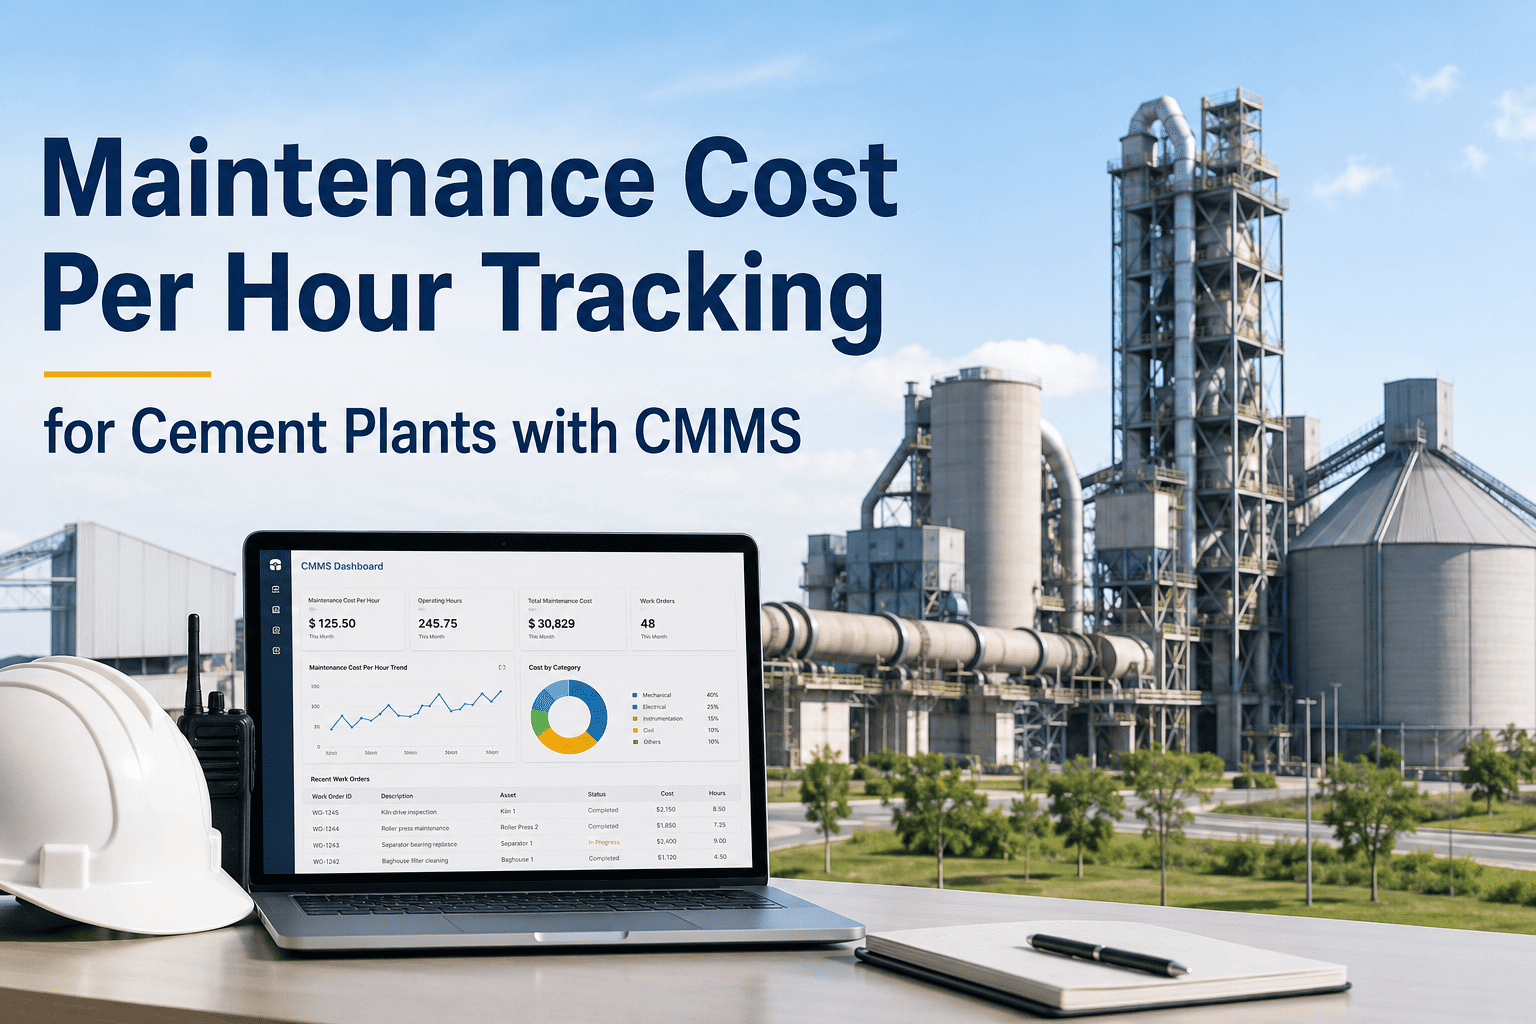
Monthly maintenance cost per tonne of clinker produced — a key metric linking maintenance programme quality directly to the production economics your finance team tracks.
Assets and failure modes that have appeared more than once in the coded event log, ranked by total accumulated loss. The repeat failure view is typically the highest-priority action list for the maintenance manager.
Visual decomposition of OEE loss — showing how much Availability, Performance, and Quality loss is directly attributable to coded maintenance events versus process factors.
OxMaint can be deployed and producing coded downtime data within days. Book a demo and we will walk through how to configure asset codes, cause codes, and production rate parameters for your specific cement plant layout.
The 8 Production Loss KPIs Every Cement Plant Should Track
Production loss analytics is only as useful as the metrics it surfaces to decision-makers. These eight KPIs are the standard output of a well-configured OxMaint production loss coding deployment in cement plants.
| KPI | Definition | Target Range | What Drives It | OxMaint Data Source |
|---|---|---|---|---|
| Unplanned Downtime Rate | % of planned production hours lost to unplanned breakdowns | Below 2% | PM compliance, predictive maintenance coverage | Coded breakdown work orders |
| Cost per Tonne (Maintenance) | Total maintenance cost divided by clinker production volume | ₹55–90 per tonne | Spare parts cost, labour, breakdown frequency | Work order cost + production data |
| MTBF by Asset | Mean time between failures for each tracked asset | Asset-specific | PM quality, lubrication discipline, inspection coverage | Failure event log with timestamps |
| MTTR by Asset | Mean time to repair once breakdown occurs | Below 4 hrs for major assets | Spare parts availability, technician skill, work order clarity | Work order open and close timestamps |
| Production Loss Pareto | Ranked list of assets by total production loss value | Top 3 under 40% of total | Asset reliability, PM programme gaps | Cause-coded events with impact values |
| Repeat Failure Rate | % of breakdown events that are recurrences of a previous failure | Below 15% | Root cause resolution quality, corrective action follow-through | Failure mode coding matches |
| PM Compliance Rate | % of scheduled PMs completed on time | Above 92% | Technician availability, schedule quality, work order system | PM schedule vs. completion data |
| Maintenance-Related OEE Loss | OEE availability loss attributable to coded maintenance events | Below 3% | Unplanned downtime rate, PM quality, inspection discipline | Coded event OEE impact fields |
Scroll horizontally on mobile · Target ranges are indicative for 1–2 MTPA integrated cement plants
How Production Loss Coding Works in the OxMaint Mobile Workflow
The value of production loss coding depends entirely on whether technicians complete it consistently. OxMaint embeds the coding workflow into the standard work order close-out sequence — it takes under 90 seconds and requires no plant floor terminal.
Technician or operator raises a breakdown work order in OxMaint mobile. The system records the exact time of the report as the production loss start timestamp — no manual entry needed.
When the technician opens the work order, they select the affected asset (Tier 1) and the failure cause code (Tier 2) from dropdown lists configured for your plant. This takes under 30 seconds and is mandatory before the work order can be closed.
On work order closure, OxMaint records the repair completion time. The system calculates total downtime duration automatically from the report and close timestamps. No manual duration calculation.
OxMaint multiplies the downtime duration by the asset's production rate (which you configure once during setup) to calculate clinker lost, cost per tonne impact, and OEE impact. These values flow into the analytics dashboard instantly.
All coded events update the Pareto dashboard, trend charts, and KPI widgets immediately on work order closure. Plant managers and maintenance managers see live data — no end-of-month report compilation required.
Frequently Asked Questions
OxMaint's production loss coding turns every breakdown into a data point on your reliability Pareto — giving your maintenance and finance teams the asset-level cost evidence needed to make better capital, parts, and PM investments.