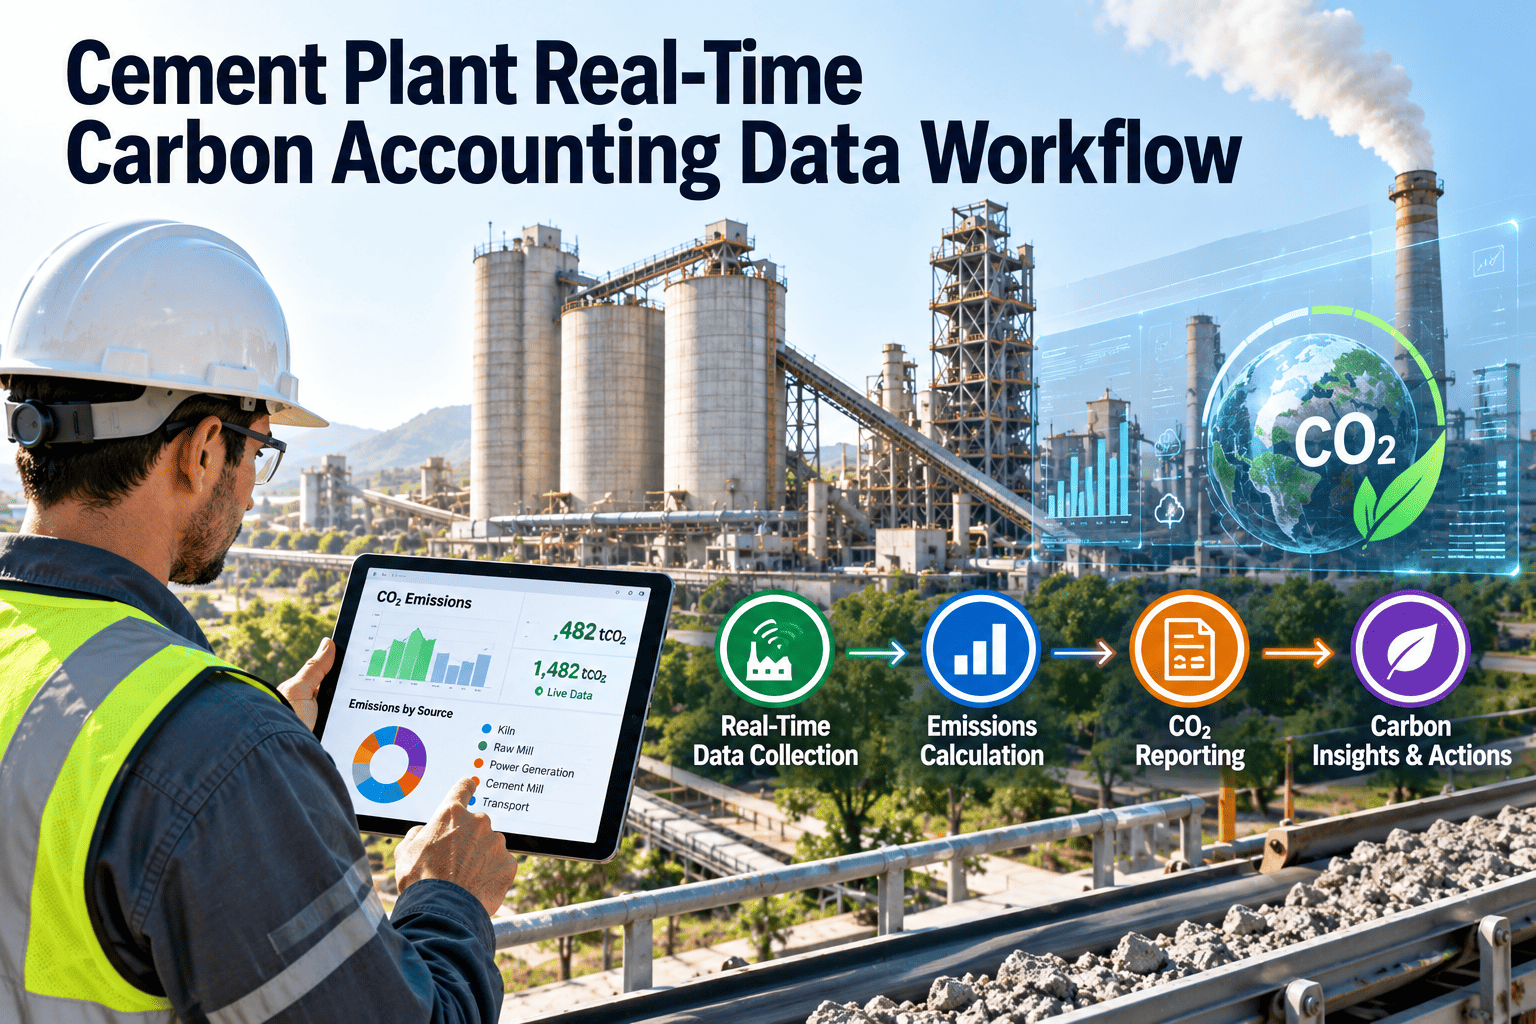
Most cement plants still build their carbon figures after the period closes. Someone collects kiln feed records, fuel deliveries, clinker output and stack readings, pastes them into a spreadsheet and hopes nothing drifted along the way. A faulty weigh feeder or an uncalibrated gas analyzer can distort the inventory for weeks before anyone notices. A real-time carbon accounting workflow treats emissions data as a live product that operations and maintenance own together. This guide follows the data from sensor to report, shows which maintenance tasks keep each link trustworthy, and explains how a CMMS such as Oxmaint can hold the evidence in one place.
Cement Plant Real-Time Carbon Accounting Data Workflow
Carbon numbers are only as good as the weigh feeders, flow meters and analyzers behind them. Build a workflow where every measurement point has an owner, a calibration schedule and an audit trail.
Why cement carbon accounting is harder than it looks
Two emission streams, many instruments
- Process emissions come from calcination, when limestone releases CO2 as it becomes clinker. They are driven by raw meal composition and clinker production, so they depend on accurate feed and quality data.
- Combustion emissions come from kiln and calciner fuels, including coal, petcoke, and alternative fuels. They depend on fuel quantity, calorific value and the share of biogenic material.
- Indirect emissions come from purchased electricity, which depends on metering at mills, fans and compressors.
Where the data breaks
- Weigh feeders drift between calibrations and over-report or under-report fuel and raw meal.
- Gas analyzers foul with dust and moisture, so readings flatten or lag.
- Manual entries for alternative fuels arrive late or without a source reference.
Typical emission mix (indicative)
The real-time data workflow, stage by stage
Define measurement points and owners
Capture data at the source
Validate before calculating
Apply emission factors and methods
Publish and verify
Which instruments matter, and what keeps them accurate
| Measurement point | What it feeds | Typical failure | Maintenance control |
|---|---|---|---|
| Kiln feed weigh feeder | Process CO2 and clinker factor | Belt wear, load cell drift, build-up | Scheduled calibration and belt inspection |
| Fuel dosing and scales | Combustion CO2 | Blockage, calibration drift, bridging | Routine checks and test weighing |
| Stack gas analyzer and flow | Direct CO2 measurement and cross-check | Probe fouling, sample line leaks | Cleaning rounds and validation tests |
| Alternative fuel records | Biogenic and fossil split | Missing delivery data | Mandatory inspection fields at receipt |
| Power meters | Indirect emissions | Communication loss, wrong scaling | Periodic verification and tag audit |
Before and after: spreadsheet inventory versus maintained data chain
Spreadsheet approach
- Figures assembled after month end
- Calibration dates kept in separate files
- Instrument faults found during verification
- Corrections applied without a clear trail
Maintained workflow
- Figures visible daily with validation flags
- Calibration plans tied to each instrument
- Faults raised as work orders within a shift
- Every correction linked to a record and approver
Risk view: which data failures hurt the inventory most
Turn data flags into maintenance actions
Detect
Dispatch
Document
Keep the instruments behind your carbon data under control
Compliance and reporting context
Why evidence matters
- Emissions trading schemes and monitoring plans expect documented methods, uncertainty control and traceable calibration.
- Voluntary protocols such as the GCCA CO2 and energy accounting approach rely on consistent boundaries and data quality.
- Border carbon rules such as the EU CBAM make verifiable plant-level emission data a commercial matter for exporters, so confirm current requirements for your market.
What a verifier usually asks for
- Instrument list with ranges, locations and calibration status.
- Records of faults, repairs and data substitutions.
- Evidence that method and factor changes were approved.
Audit-ready checklist
- Every measurement point registered as an asset
- Calibration due dates scheduled and tracked
- Instrument faults closed with results attached
- Manual entries time-stamped and sourced
- Emission factor versions approved and logged
KPIs that show whether the workflow is healthy
Calibration on-time rate
Data availability
Time to fix a data fault
Manual entry share
Mass-balance gap
Recurring faults
Rolling it out in a working plant
Where Oxmaint fits in the carbon data chain
Asset management
Preventive maintenance
Work orders and mobile
Reports and compliance records
Common causes of error in cement carbon data
Measurement error
Boundary and method error
Process and timing error
Handling alternative fuels and biogenic carbon
Why records matter
- Alternative fuels such as waste-derived fuels, biomass and tyres have different fossil and biogenic fractions, so each delivery needs a source and a composition record.
- Calorific value and moisture change between batches, so sampling and analysis results should be linked to the feed period.
- Dosing systems for solid and liquid alternative fuels block and wear, so their reliability affects both substitution rate and data quality.
What maintenance can do
- Include alternative fuel scales and feeders in the calibration plan with the same priority as main fuel.
- Inspect receiving and storage areas, so delivery records and samples are complete.
- Review dosing faults with the process team, since unstable feed disturbs the kiln and the numbers.
Alternative fuel data checklist
- Supplier and delivery reference recorded
- Sample taken and result stored
- Scale or feeder calibrated and in date
- Fossil and biogenic split documented
- Substitution rate reviewed weekly
Roles across operations, maintenance and sustainability
| Role | Responsibility in the workflow | What they need from the system |
|---|---|---|
| Process engineer | Owns kiln and fuel data definitions and mass balance checks | Validated data, flags and trends |
| Instrument technician | Calibrates and repairs measurement points | Calibration plans, work orders and asset history |
| Maintenance planner | Schedules calibration around kiln stops and outages | Due dates, access needs and parts |
| Sustainability or environmental lead | Owns the inventory, methods and reporting | Evidence of data quality and corrections |
| Plant manager | Reviews intensity and actions | Clear dashboards and exceptions |
How to handle data gaps without hiding them
Flag the gap immediately
Use a documented substitution method
Link the gap to its cause
Review patterns
Monthly review agenda for the carbon data team
Data quality items
- Calibrations completed and overdue
- Validation flags opened and closed
- Manual entries and their sources
- Mass-balance gaps and explanations
Performance items
- Emission intensity trend and drivers
- Fuel mix and substitution changes
- Kiln stops and their effect on figures
- Actions and owners for next month
Linking kiln operation to the data chain
Startups and stops
Raw mix changes
Fuel switches
Keep a change log
Practical advice for the first quarter
- Choose a single reporting boundary and keep it fixed for the first year, so trends are meaningful.
- Start with the measurements that drive most of the inventory, instead of trying to digitize every minor source on day one.
- Agree who may change factors, scaling or substitution rules, and require a recorded approval.
- Review the first monthly results with maintenance in the room, since instrument issues will surface quickly.
- Share simple intensity and data quality charts with shift teams, so they understand why the instruments matter.