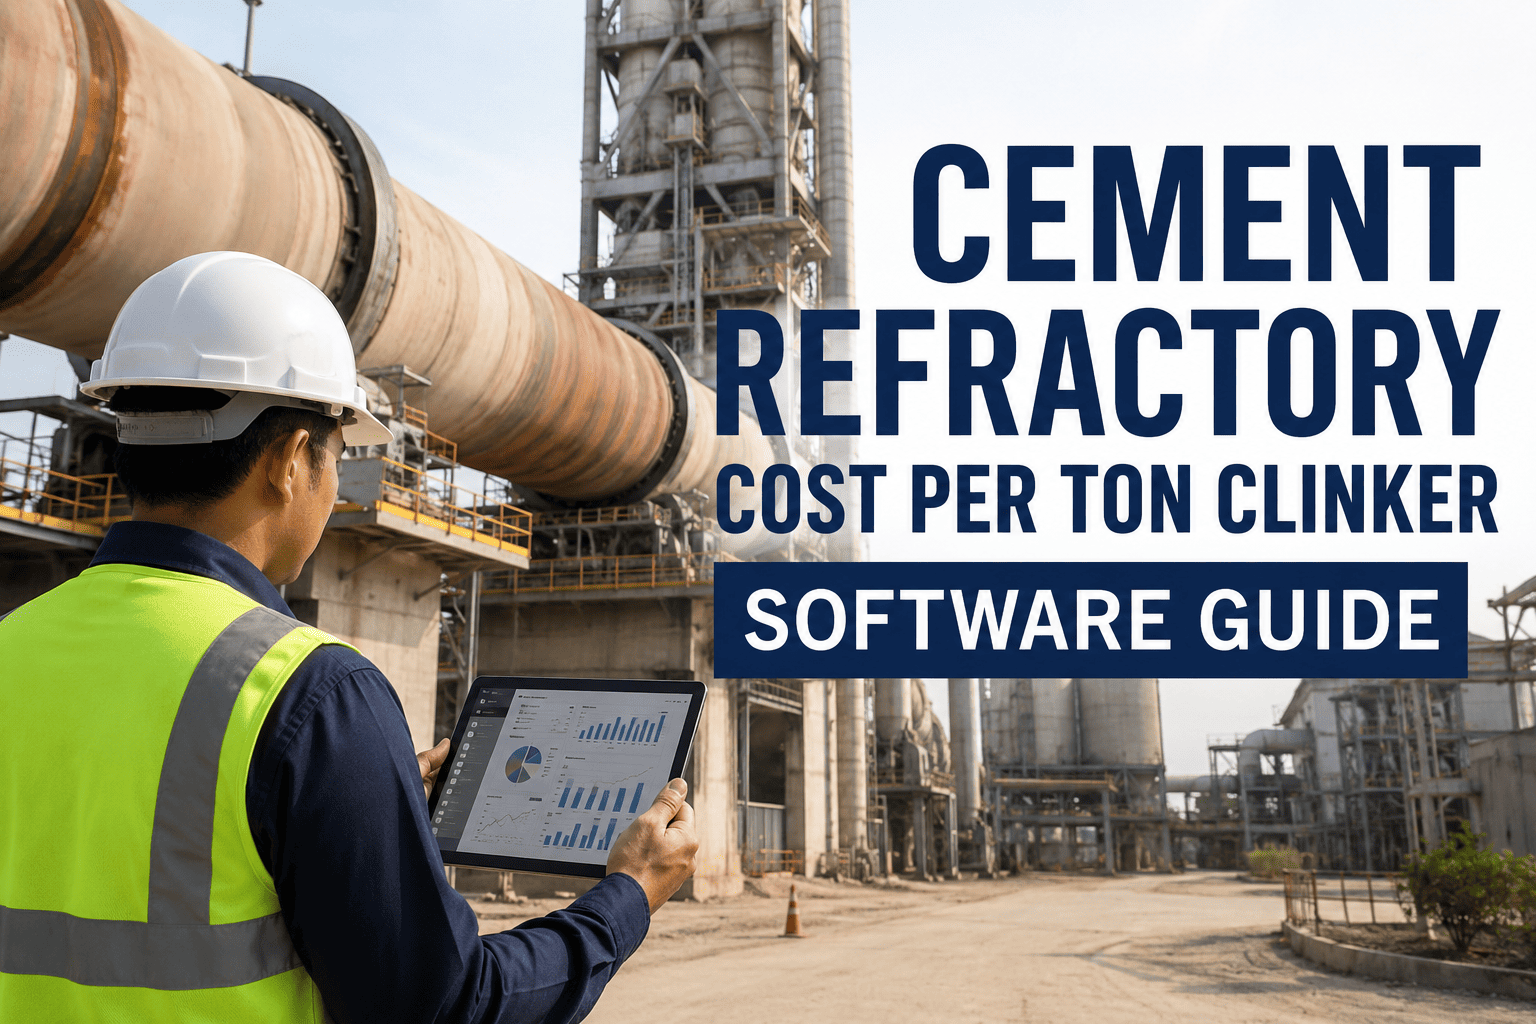
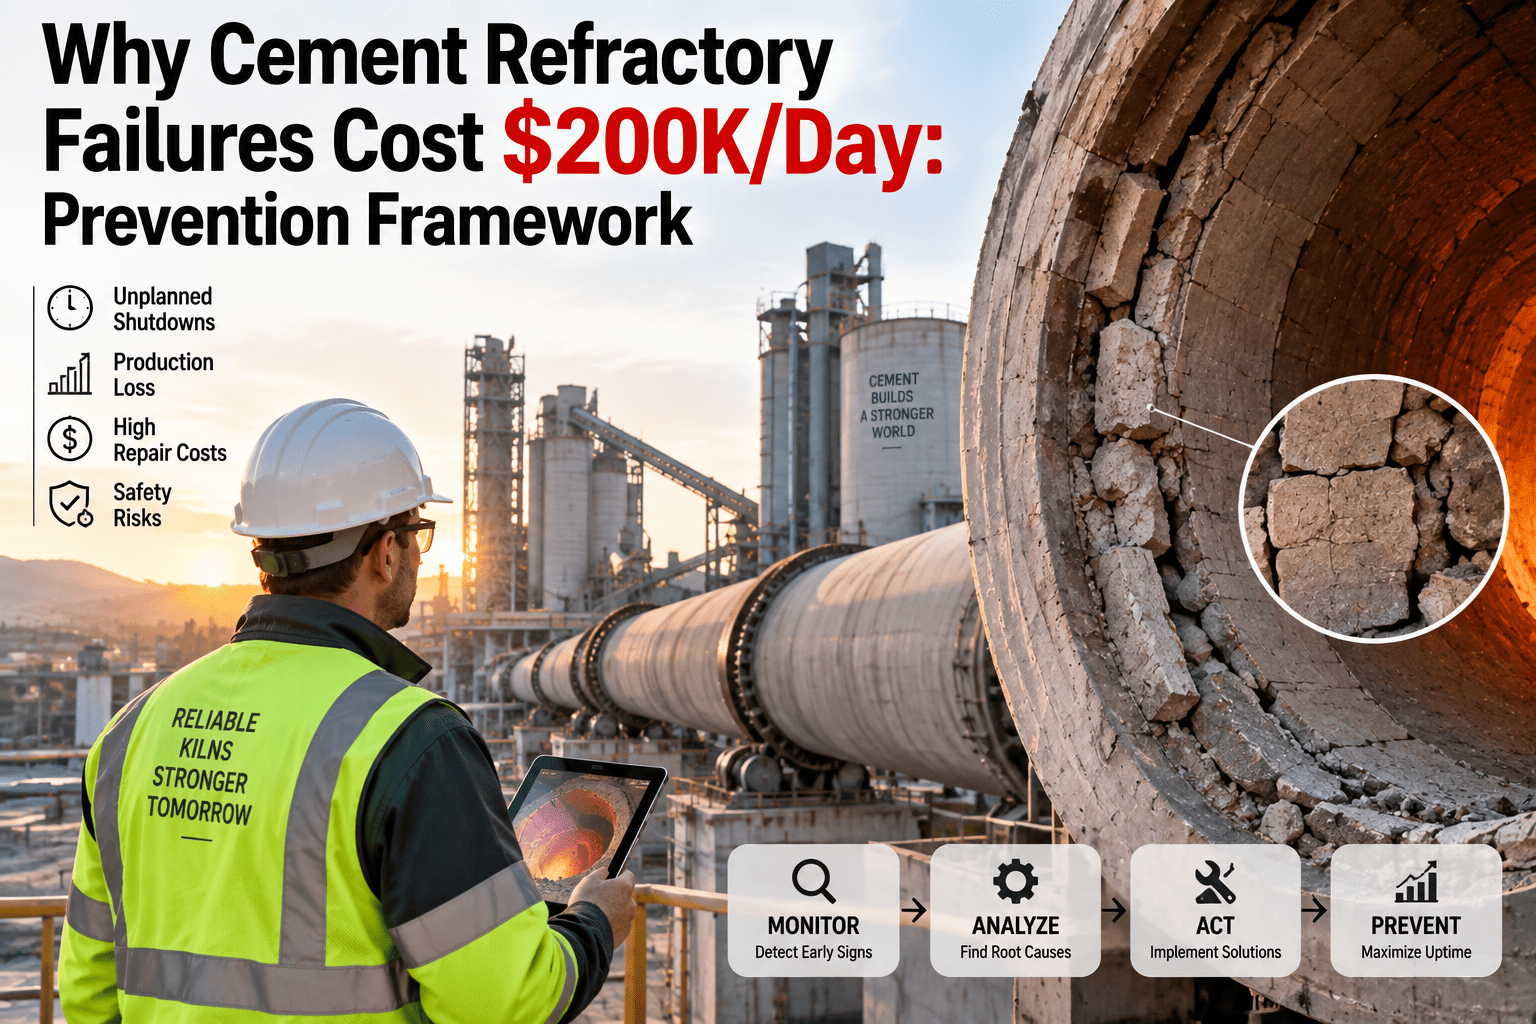
Refractory lining is one of the largest recurring line items in a cement plant's maintenance budget, yet most plants still work out refractory cost per ton of clinker once a year, long after the spend has already happened. A kiln campaign that runs eight months instead of the eleven a competing brand delivers can quietly add real cost to every ton produced, and few plant teams can put an exact number in front of a CFO mid-year. Getting refractory cost per ton clinker onto a live number — tied to campaign life, brick consumption, and downtime hours as they happen — turns a once-a-year spreadsheet exercise into a figure maintenance leaders can defend brand choices and capital requests with, and it is exactly what teams can start tracking free with OxMaint's CMMS against their own kiln data.
Cement Plant Cost Intelligence · Refractory Management
Cement Refractory Cost per Ton Clinker, Tracked Live Instead of Guessed Annually
Connect brick consumption, campaign life, and kiln downtime to clinker output so your refractory cost per ton is a number you defend, not a number you estimate after the fact.
Why Refractory Cost per Ton Deserves a Live Dashboard
8-11 mo
Typical Campaign Life Swing
The range in burning-zone campaign life between an underperforming brick brand and a strong one — the single biggest driver of your true cost per ton.
30%+
Downtime Traced to Refractory
Share of unplanned kiln stoppages that trace back to burning zone or transition zone refractory failure at plants without structured tracking.
1x / yr
How Often Cost Is Actually Checked
Most plants calculate refractory cost per ton clinker once a year during budget season, well after the spend and the brand decision are already locked in.
3 Zones
Where Most Spend Repeats
Burning zone, kiln inlet and transition, and cooler and discharge account for the large majority of repeat refractory spend on a typical kiln line.
Cost per Ton, Broken Down by Refractory Zone
Zone 01
Burning Zone (Sintering)
The burning zone carries the highest brick cost per linear meter and the shortest campaign life of any section in the kiln, so it drives the largest single share of refractory cost per ton clinker. Coating stability, kiln shell ovality, and burner alignment all shorten or extend this zone's life, which is why cost per ton varies so much between plants running the same brick specification.
Typical Campaign Life
8 to 14 months, brand and operating discipline dependent
Primary Cost Driver
Brick grade cost combined with actual campaign length achieved
Common Failure Mode
Coating loss, thermal shock spalling, chemical attack from alkali and sulfate cycles
Tracking Tip: Log every burning zone re-brick as a work order tied to a specific brand and lot, then let cost per ton calculate automatically against clinker produced since the last relining.
Zone 02
Kiln Inlet & Transition Zone
The inlet and transition zone sits between the burning zone and the preheater string and takes repeated thermal cycling every time the kiln stops and restarts. Plants that stop and start more frequently for maintenance or feed issues see this zone's cost per ton climb even when brick quality is unchanged.
Typical Campaign Life
6 to 12 months, closely tied to kiln stop frequency
Primary Cost Driver
Thermal cycling frequency and buildup or ring formation events
Common Failure Mode
Ring formation removal damage, thermal cycling cracks, mechanical abrasion from feed
Tracking Tip: Correlate transition zone relining frequency with kiln stop-start logs from your CMMS — a rising stop count almost always shows up here first.
Zone 03
Cooler & Discharge End
Cooler refractory and wear plates absorb direct clinker impact and abrasive wear rather than the extreme process temperatures of the burning zone, so cost per ton here tracks tonnage throughput and clinker granulometry more than kiln chemistry.
Typical Campaign Life
12 to 24 months for wear-resistant castable and plate systems
Primary Cost Driver
Abrasive wear rate against total clinker tonnage passed through
Common Failure Mode
Mechanical erosion, plate loosening, localized hot spots from lining thinning
Tracking Tip: A CMMS-driven inspection log for cooler plate wear gives you the leading indicator before a hot spot forces an unplanned stop.
Zone 04
Preheater & Riser Duct
Preheater cyclones and riser ducts see lower unit costs per relining but a higher relining frequency in plants running high alternative fuel rates, since chlorine and sulfur cycles concentrate here and accelerate chemical attack on the lining.
Typical Campaign Life
18 to 36 months, shorter with higher alternative fuel ratios
Primary Cost Driver
Chemical attack intensity linked to alternative fuel and raw material chemistry
Common Failure Mode
Chemical spalling, buildup-driven mechanical damage during cleaning
Tracking Tip: Segment cost per ton by fuel mix period so a shift toward alternative fuels does not get buried inside an annual average.
Every zone above needs the same underlying record: a work order, a brand, an install date, and clinker output since that date. OxMaint links refractory work orders directly to production data so cost per ton calculates itself, zone by zone, instead of living in a spreadsheet someone updates once a year.
Three Ways Plants Track Refractory Cost per Ton
| Method |
What It Actually Captures |
Update Frequency |
Decision It Can Support |
| Annual Audit Spreadsheet |
Total spend divided by annual clinker output, no zone detail |
Once a year |
Retrospective budget review only |
| Stores Ledger / Bin Card |
Brick purchases and issues, no link to campaign life or output |
Per transaction, unlinked |
Inventory reorder, not cost decisions |
| OxMaint Live Dashboard |
Cost per ton by zone, brand, and campaign, tied to real clinker output |
Continuous |
Brand selection, capex timing, CFO reporting |
Frequently Asked Questions
What is a normal refractory cost per ton clinker range?
There is no single industry number because it depends on kiln size, fuel mix, and brick specification. What matters more than the absolute figure is trending your own plant's cost per ton by zone over time so a rising number gets caught before it becomes a budget surprise.
How do I compare two refractory brands fairly on cost per ton?
Compare installed cost divided by clinker output achieved during that specific brick's campaign, not calendar time. A brand that costs more per brick but reaches a longer campaign life often wins on true cost per ton once downtime is factored in.
OxMaint's work order records make this comparison automatic across campaigns.
Why does refractory cost per ton spike after switching to more alternative fuel?
Higher alternative fuel ratios generally raise chlorine and sulfur cycling, which accelerates chemical attack in the preheater string and can shorten campaign life there even while burning zone life stays flat. Segmenting cost per ton by fuel period isolates this effect.
Can refractory cost per ton data support a capex request?
Yes — a documented cost-per-ton trend by zone, backed by work order history, is exactly the evidence finance teams ask for when justifying a shell scan, coating management program, or a switch to a higher-grade brick specification.
How does a CMMS improve refractory cost tracking over a spreadsheet?
A CMMS ties every relining work order to an asset, a brand, an install date, and ongoing production output automatically, so cost per ton updates continuously instead of requiring someone to reconstruct it once a year.
Book a demo to see it running against sample kiln data.
Turn Refractory Spend Into a Number You Can Defend
OxMaint links every refractory work order to brand, install date, and clinker output so cost per ton is always current — not a once-a-year estimate built after the money is already spent. Start free today.