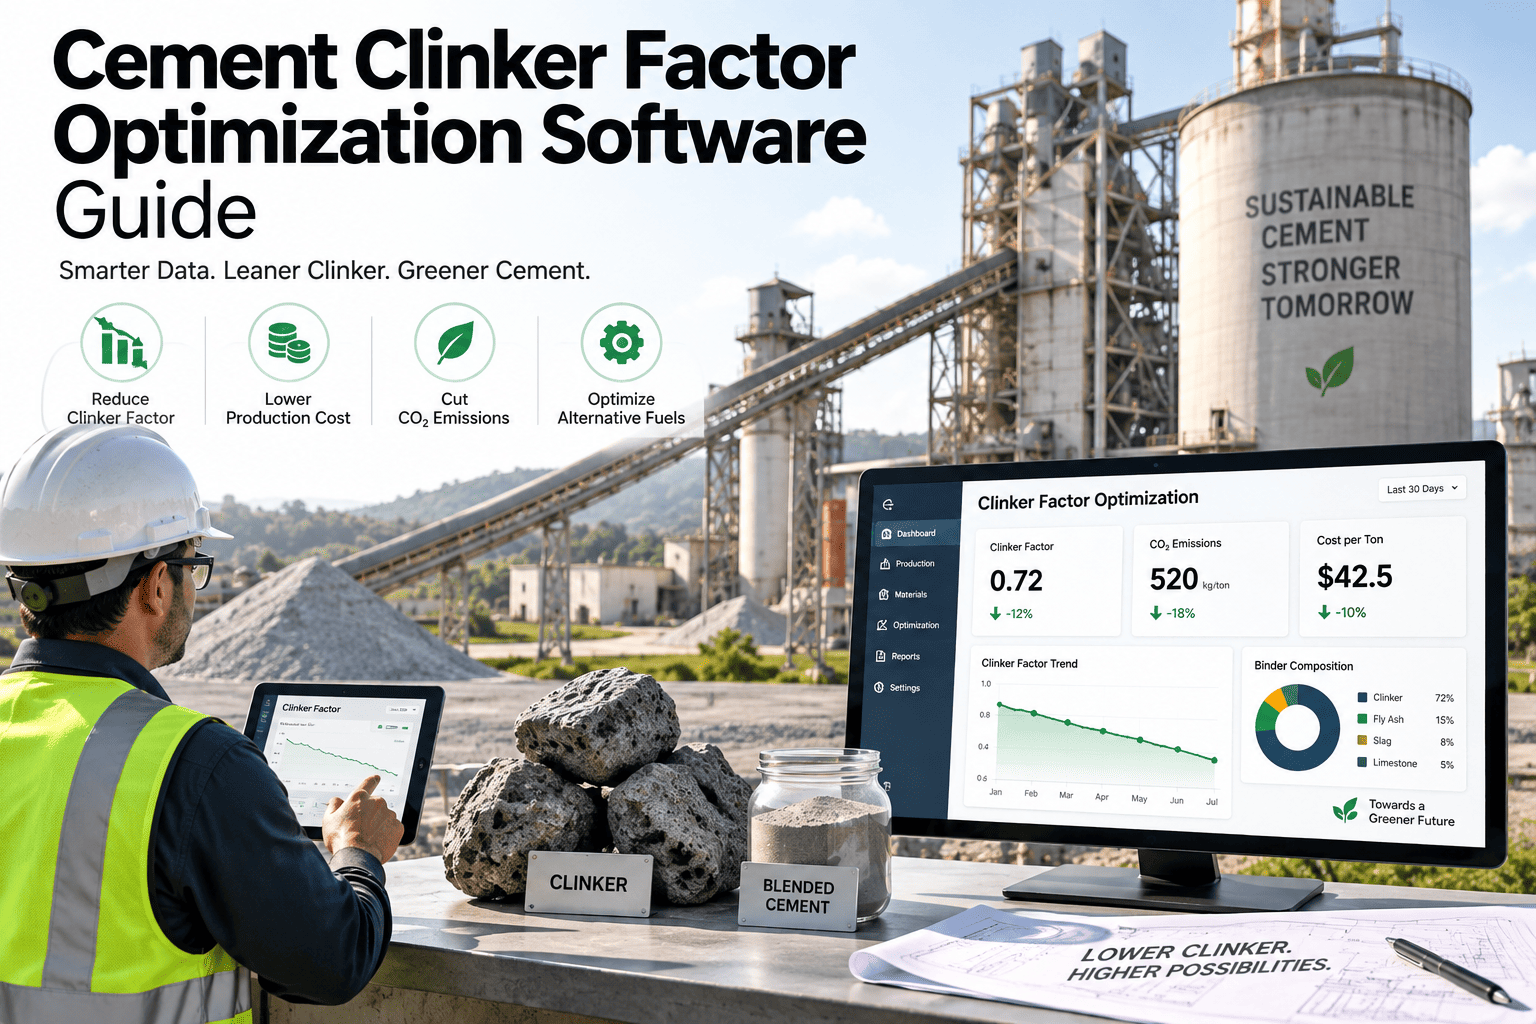
Clinker manufacturing is the single most energy- and carbon-intensive step in cement production, so lowering the clinker factor — the share of clinker in the final cement blend — is the fastest lever most plants have for cutting both fuel cost and CO2 per tonne. The barrier is rarely a shortage of fly ash, slag or calcined clay. It is inconsistent SCM sourcing, dosing that drifts between batches, and a quality-control process that cannot prove a lower-clinker blend still meets strength standards, which sends teams back to safer, higher-clinker mixes. A clinker factor optimization CMMS closes that gap by tying material tracking, dosing records and QC results together.
Every point of clinker factor you cut is a point of fuel, power and CO2 you no longer have to buy.
Ordinary Portland Cement typically runs a clinker factor near 90–95%. Blended cements using fly ash, slag or calcined clay can bring that down to 55–80% without giving up strength class — if the SCM supply, dosing and QC process are tracked well enough to trust the blend.
Why clinker factor is the decarbonization lever plants reach for first
Calcining limestone releases process CO2 regardless of fuel source, and clinker grinding is the most power-intensive step in cement manufacturing. Cutting clinker factor addresses both at once, which is why it typically moves faster than kiln-fuel switching or carbon capture investment.
| Cement type | Typical clinker factor | Common SCM | Relative carbon footprint |
|---|---|---|---|
| Ordinary Portland Cement (OPC) | 90–95% | Gypsum only | Highest |
| Portland Pozzolana Cement (PPC) | 60–80% | Fly ash | Moderate |
| Portland Slag Cement (PSC) | 35–40% | Ground granulated blast furnace slag | Low |
| Composite cement (CC) | varies by blend | Fly ash + slag + limestone | Low to moderate |
| Limestone calcined clay cement (LC3) | ~50% | Calcined clay + limestone | Low |
The root causes that send teams back to high-clinker mixes
Almost every plant has tried SCM blending at some point. The reason many revert is rarely material availability — it is a process gap between what the mix design intends and what actually gets produced batch after batch.
Fly ash and slag reactivity shifts with the source power plant or steel mill, and particle size distribution changes between deliveries — without tracking, a mix design tuned for one batch underperforms on the next.
Feeder calibration on SCM silos drifts the same way clinker feeders do. A dosing error that goes unnoticed for a shift can produce a blend well outside the intended replacement ratio.
Blended cements typically develop strength more slowly at early ages than OPC. Without documented curing and testing protocols matched to the blend, early-age results can look like a failure when the 28-day result would have passed.
Co-grinding clinker and SCM above roughly 30–35% replacement can under-grind the softer material or over-grind the clinker fraction — separate grinding or premixing usually performs better at higher replacement rates.
A four-stage workflow for a blend that holds up under QC
Source and qualify SCM supply
Log fineness, reactivity index and chemical composition for each SCM delivery before it enters the mix, so a supply-quality shift is caught before it reaches the mill.
Set and monitor dosing ratios
Track actual feeder output against the target replacement ratio for each batch, flagging deviation before an off-spec blend reaches storage.
Test against the right standard and age
Match compressive-strength testing schedules to the blend type — many SCM blends need a 28-day or 56-day result read alongside early-age data to judge performance fairly.
Document and certify the blend
Keep source certificates, dosing logs and test results attached to each production lot, so a customer question or standards audit has a ready answer instead of a search.
Stop choosing between decarbonization and confidence in the blend
Track SCM sourcing, dosing and QC results in one CMMS record built for cement plants.
Where a CMMS fits into a clinker factor reduction program
Clinker factor reduction is a materials and quality problem first, but it depends on the same maintenance and process discipline that keeps a kiln line running reliably. That is where Oxmaint's cement plant CMMS workflows apply directly.
Material and asset tracking
SCM silos, dosing feeders and blending equipment are tracked as assets, so a feeder calibration check is scheduled on the same discipline as a kiln bearing inspection.
Inspection checklists
Digital checklists standardize SCM receiving inspections and feeder calibration checks, closing the gap between what should happen and what actually gets recorded.
Work orders on deviation
A dosing ratio or fineness result outside tolerance can trigger a work order for feeder recalibration before a full production lot is affected.
Compliance-ready records
Source certificates, dosing logs and strength results stay linked to each production lot, giving quality teams an audit-ready trail against ASTM and EN blended-cement standards.
Reporting dashboards
Plant managers can track clinker factor, SCM replacement rate and cost per tonne across mix designs in one dashboard instead of reconciling spreadsheets from three departments.
Mobile field access
Lab technicians and mill operators log fineness, dosing and test results from the floor, so data reaches the record the same shift it was collected rather than days later.
A short checklist before raising SCM replacement rate
Confirm SCM supply volume and reactivity are stable enough to support the target replacement rate year-round, not just during a trial batch.
Set dosing tolerances and confirm feeder calibration before the first production run at a new ratio.
Align strength testing schedules with the blend's expected strength-gain curve, including later-age results.
Evaluate separate grinding versus co-grinding once replacement rate moves past roughly 30%.
Document the mix design and QC process well enough to defend it to a customer or certification body on request.
Cement clinker factor optimization — frequently asked questions
How much can clinker factor realistically be reduced?
It depends heavily on available SCM supply and target application, but plants with reliable slag or fly ash access commonly run blended cements with clinker factors in the 55–80% range against a 90%+ OPC baseline.
Does a lower clinker factor mean lower strength?
Not necessarily — blended cements can match OPC strength classes, but early-age strength development is typically slower, which is why testing schedules need to account for later-age results.
What is the biggest reason plants revert to high-clinker mixes?
Usually a quality-control gap rather than a materials gap — inconsistent dosing or mismatched testing schedules produce results that look like failures when the underlying blend was sound. Book a demo to see how tracking closes that gap.
Is co-grinding or separate grinding better for SCM blends?
Separate grinding or premixing generally performs better once SCM replacement passes roughly 30%, since co-grinding at high ratios can under-grind the softer material.
How does a CMMS help with clinker factor tracking specifically?
It ties SCM sourcing, dosing and QC results into one traceable lot record, so replacement rate and blend performance can be reviewed together instead of reconstructed after the fact. Get started with a pilot on one blend line.
Turn clinker factor reduction into a repeatable process
Track SCM sourcing, dosing accuracy and QC results in one CMMS built for cement plants.
Free trial available · No credit card required