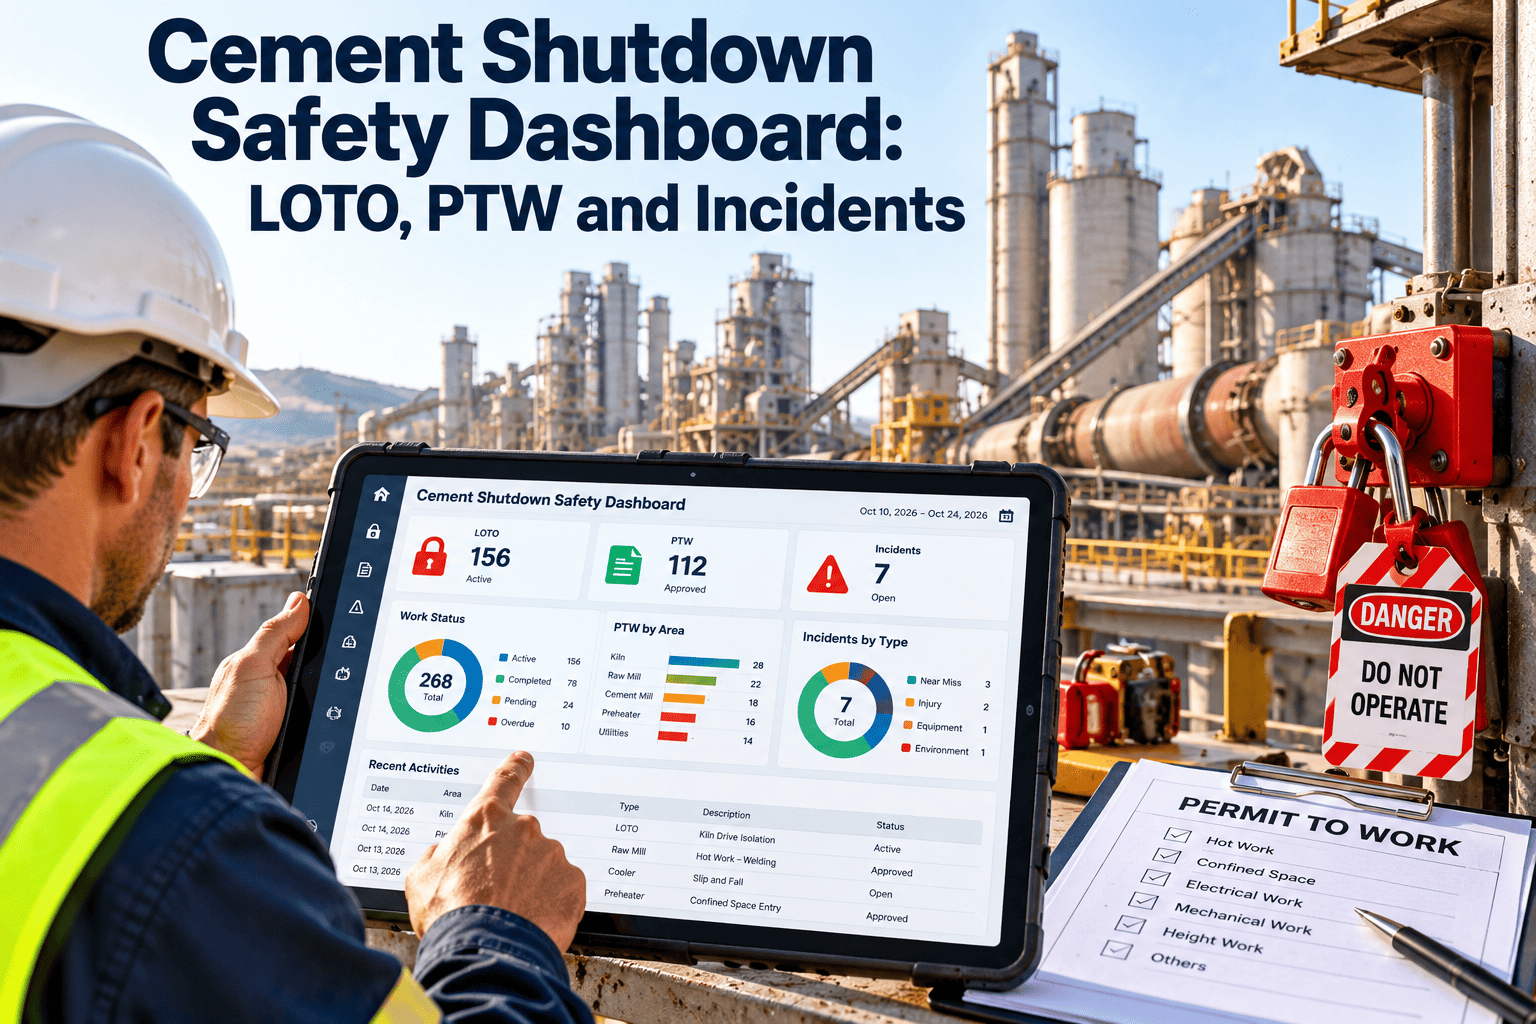
A cement shutdown compresses weeks of work into a few days, with many contractors, tight schedules and equipment that is hot, heavy and full of stored energy. Safety information in that window is usually scattered across permit binders, lock lists, radio calls and end-of-shift notes. A shutdown safety dashboard brings lockout, permits to work and incident signals into one view that supervisors can trust. This page shows what that dashboard should contain, and how Oxmaint maintenance management software connects it to the work orders and assets behind it.
Cement Shutdown Safety Dashboard: LOTO, PTW and Incidents
See active isolations, open permits and incident signals by area and shift, so shutdown leaders can act before a conflict becomes an injury.
Why shutdown safety is hard to see in real time
During normal operation, a small crew works within a known routine. During a shutdown, hundreds of tasks start at once, and no single person sees the whole picture.
Simultaneous operations
Welding above a crew, entry into a cyclone while a crane lifts nearby, or testing a drive while others work on the machine.
Many contractors
Visiting crews differ in training, language and familiarity with plant rules.
Rapid scope change
Inspection findings add jobs during the outage, and isolation plans must follow.
Fatigue and pressure
Long shifts and restart deadlines raise the risk of shortcuts.
What a shutdown safety dashboard should show
Each widget should answer a question a shutdown manager asks in the morning meeting or on the walk.
| Dashboard widget | Question it answers | Data source |
|---|---|---|
| Active isolations by area | Which equipment is locked out, and where is the highest concentration? | LOTO records linked to work orders |
| Permit register | Which hot work, confined space, height and electrical permits are open? | Permit to work records |
| Jobs without a permit or isolation | Is any active work missing required controls? | Work orders compared with permits and locks |
| Permit and isolation conflicts | Do two jobs interfere with each other in the same space? | Area and equipment overlap check |
| Contractor competency status | Are the people on site trained and authorized? | Training and induction records |
| Incident and near miss feed | What has been reported, and what follow-up is open? | Incident reports and corrective actions |
| Handover summary | What must the next shift know about open risks? | Shift notes and open permit list |
A shutdown day through the safety dashboard
Following a typical day shows where the dashboard supports decisions at each stage.
Brief
Review carried-over permits, open isolations and any incident actions from the last shift.
Release work
Approve permits only where isolation is verified and no conflicting work exists.
Monitor
Watch for scope changes, new jobs and overlapping activities in the same area.
Respond
Act on reports of near misses or unsafe conditions and record the actions.
Hand over
Close finished permits, transfer open ones and record what the next crew must know.
Give shutdown leaders one live view of safety
Connect LOTO, permits, incidents and work orders so conflicts and gaps show up before crews are exposed.
Leading versus lagging indicators
Counting injuries tells you what has already happened. A good dashboard also shows signals that predict trouble.
- Recordable injuries
- Lost time events
- Equipment damage events
- Regulatory citations
- Jobs started without a verified isolation
- Permits open longer than planned
- Near miss reports and closure time
- Shift handover completion
- Safety walkdown findings still open
Permit and isolation conflicts to detect
Many shutdown incidents involve interaction between jobs. A dashboard can flag combinations that deserve a review before work begins.
| Combination | Risk | Review action |
|---|---|---|
| Hot work and stored fuel or dust | Fire or dust ignition | Confirm clearing, fire watch and gas or dust checks |
| Confined space entry and nearby energization | Entrapment or unexpected movement | Verify isolation of all connected equipment |
| Work at height under a crane lift | Dropped objects and struck-by hazards | Separate zones or sequence the tasks |
| Cyclone cleaning and adjacent kiln activity | Material release or gas movement | Control access and confirm isolation points |
| Electrical testing and mechanical work | Unexpected energization | Coordinate through a single isolation owner |
Roles and what each one needs from the dashboard
Different people use the same data differently. Design views around those needs.
Contractor visibility during the outage
Contractors often make up most of the people on site during a shutdown. The dashboard should show who they are and what they are allowed to do.
- Company and crew list: know which contractor crews are assigned to which jobs, areas and shifts.
- Competency status: show induction, task-specific training and authorization dates so expired items are visible.
- Permit ownership: each permit names a responsible person from the contractor and a plant counterpart.
- Performance signals: track reported hazards, late closures and walkdown findings by contractor to guide coaching.
- Communication: make sure daily instructions and changes reach contractor leads, not only plant staff.
High-risk permit types in cement shutdowns
Different permits carry different hazards. Show the permit type clearly, along with the controls that must be verified.
| Permit type | Typical cement shutdown example | Controls to verify |
|---|---|---|
| Confined space entry | Cyclones, kiln interior, silos, mill chambers | Isolation, atmosphere checks, rescue plan, attendant, cooling time |
| Hot work | Welding on ducts, refractory anchors or structural steel | Fire watch, combustible clearing, gas or dust checks, extinguishers |
| Work at height | Preheater tower, cooler roof, conveyor galleries | Fall protection, anchor points, exclusion zone below |
| Electrical work | Motor, switchgear and drive servicing | Isolation, testing, authorized personnel, arc flash controls |
| Heavy lifting | Rollers, gearbox, motor and refractory handling | Lift plan, rigging inspection, trained operators, exclusion zone |
Incident and near miss reporting during a shutdown
Fast, simple reporting is what turns small warnings into prevention. The process should be quick enough to use in the middle of a busy shift.
Capture quickly
Mobile form with location, task, description and photo.
Assess severity
Safety officer reviews the report and decides on immediate controls.
Make safe
Stop or adjust work, repair the hazard and brief affected crews.
Find the cause
Review the job plan, isolation, permit and supervision involved.
Verify actions
Track corrective actions to completion and share lessons.
Escalation rules that keep decisions fast
Agree in advance who is told, and how quickly, when the dashboard shows a problem.
| Trigger | Who is notified | Expected response |
|---|---|---|
| Work started without a verified isolation | Area supervisor and safety officer | Stop the job until verification is recorded |
| Two conflicting permits in one area | Shutdown manager | Resequence the tasks before work continues |
| Contractor competency expired | Contractor lead and safety officer | Remove the person from the task until renewed |
| Serious incident or high-potential near miss | Plant manager and safety lead | Immediate review and decision on stopping related work |
| Permit open beyond planned duration | Permit issuer | Review the job status and extend or close the permit |
What undermines a shutdown safety dashboard
Most dashboard failures are data problems rather than design problems.
- Late data entry: permits and isolations recorded at the end of the shift show yesterday's risk, not today's.
- Unlinked records: if permits, locks and work orders do not share the same asset and job identifiers, conflicts cannot be detected.
- Too many measures: crowded screens hide the few signals that matter most.
- No clear owner: every widget needs a person who acts on it and who is accountable for the data.
- Different definitions: teams must agree what counts as an open, overdue or closed permit and isolation.
Compliance evidence the dashboard helps preserve
Requirements depend on country, site and contract, so confirm what applies to your plant. Structured records make most evidence requests easier to meet.
- Records of permits issued, extended and closed, with approvers and time stamps.
- Isolation and verification records linked to the equipment and the work performed.
- Incident reports, investigations and corrective actions with closure dates.
- Contractor induction and competency documentation for people who worked on site.
- Inspection and walkdown results showing hazards found and fixed during the outage.
How Oxmaint supports the shutdown safety view
Oxmaint organizes the maintenance data that safety views depend on, so the dashboard reflects real work rather than separate lists.
- Shutdown work orders: hold every task with its asset, crew, schedule and required safety controls.
- Asset records and procedures: link equipment-specific isolation procedures and hazards to the job.
- Mobile inspections and checklists: capture verification steps, walkdown findings and photos in the field.
- Scheduling: sequence tasks so conflicting jobs are visible during planning.
- Corrective actions: raise work orders for unsafe conditions and track them to closure.
- Dashboards and reporting: review progress, overdue items and completion by area and shift.
- Compliance records: keep an organized history of inspections, permits and actions for audits.
Daily shutdown safety walk checklist
Supervisors and safety staff can use a short mobile checklist to compare what the dashboard shows with what is happening on the ground.
- Locks and tags match the isolation record
- Permits are displayed and current
- Exclusion zones and barriers are in place
- Access routes and emergency equipment are clear
- Crews understand the job and the hazards
- Any mismatch between site and record
- Unsafe conditions with photos
- Corrective work orders raised
- Persons informed and actions agreed
- Follow-up date for verification
Mistakes to avoid when launching the dashboard
A rushed launch can turn a useful tool into one more screen that nobody trusts.
- Starting during the outage instead of piloting beforehand on a smaller maintenance stop.
- Not training supervisors and contractor leads on the exact data they must enter and when.
- Letting the dashboard replace face-to-face briefings instead of supporting them.
- Skipping a plan for network or device problems in remote areas, so crews have a simple fallback and enter data later.
- Failing to review the first few days of data and fix definitions and gaps quickly.
Setting up the dashboard before the outage
The dashboard is only as good as the data entered before and during the shutdown. Preparation makes the difference.
Load the scope
Create work orders for planned tasks with assets, crews and durations.
Link controls
Attach isolation plans, permit types and procedures to each task.
Register people
Record contractor companies, supervisors and competency evidence.
Define thresholds
Agree what counts as overdue, conflicting or requiring escalation.
Rehearse
Walk through a shift with the team using the dashboard before the outage starts.
After the shutdown: lessons and records
The value of the dashboard continues after restart, when teams review what happened and prepare for the next outage.
- Review which conflicts and near misses appeared most often and where in the plan they began.
- Compare planned and actual scope to see which late jobs created safety pressure.
- Check which permits and isolations were closed late, and why.
- Store the full record with the asset history so future outages start from real experience.
- Hold a short review with contractors so their feedback on permits, access and coordination shapes the next outage plan.
- Update standard job plans and isolation procedures with what the team learned, and attach them to the relevant assets.
KPIs to put on the shutdown safety dashboard
Keep the set small, and agree the definitions with safety and operations before the outage.
| KPI | Meaning | Direction |
|---|---|---|
| Jobs with verified isolation before start | Discipline of LOTO before work | Complete |
| Permits closed on time | Control of open risks | Rising |
| Open conflicts older than one shift | Speed of coordination decisions | Falling |
| Near miss reports per shift | Reporting culture and early warning | Healthy reporting with timely closure |
| Incident actions overdue | Follow-through on lessons | Falling |
| Handovers completed | Continuity between shifts | Complete |
Shutdown safety dashboard FAQs
What is a shutdown safety dashboard?
It is a live view of isolations, permits, incidents and handovers across all shutdown work, by area and shift.
Does it replace the permit to work system?
No. It brings permit, isolation and work order data together so people can see conflicts and gaps in one place.
Who should use it during the outage?
Shutdown managers, safety officers, area supervisors and contractor leads. Get started to set up roles.
Can contractors enter data from the field?
Mobile workflows let crews record checks and findings at the job, subject to your access rules and approvals.
How do we try it on our next outage?
Plan a pilot on one area first. Book a demo to scope it.
Run your next cement shutdown with safety in plain sight
Bring isolations, permits, incidents and shutdown work into a single, shared view built for maintenance teams.