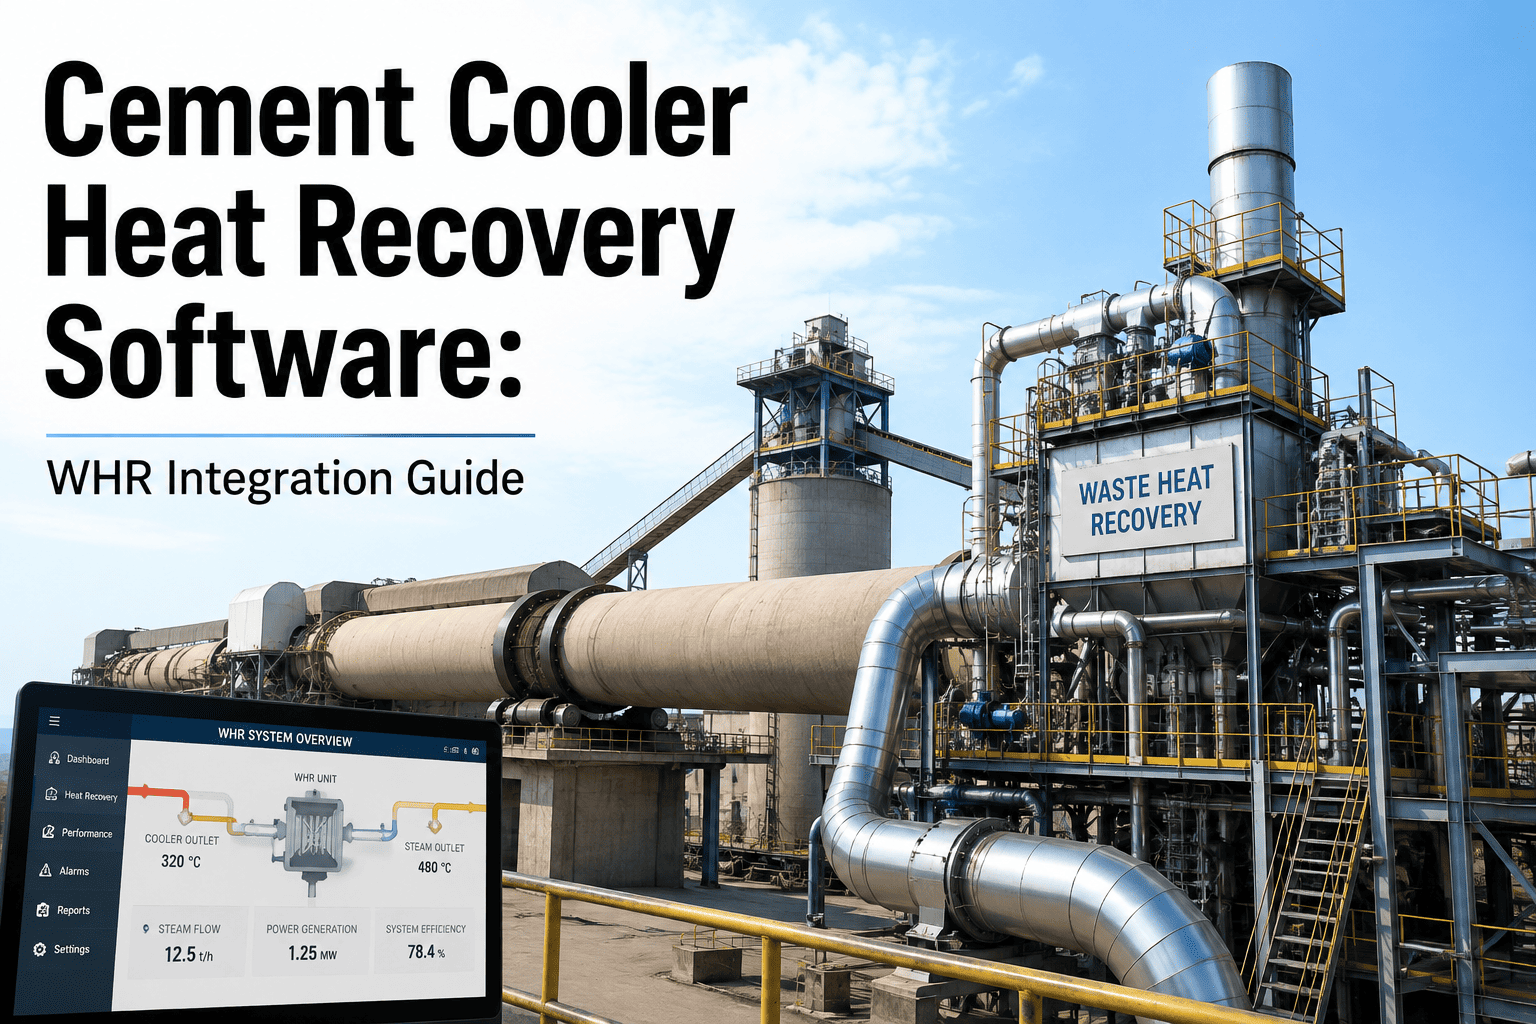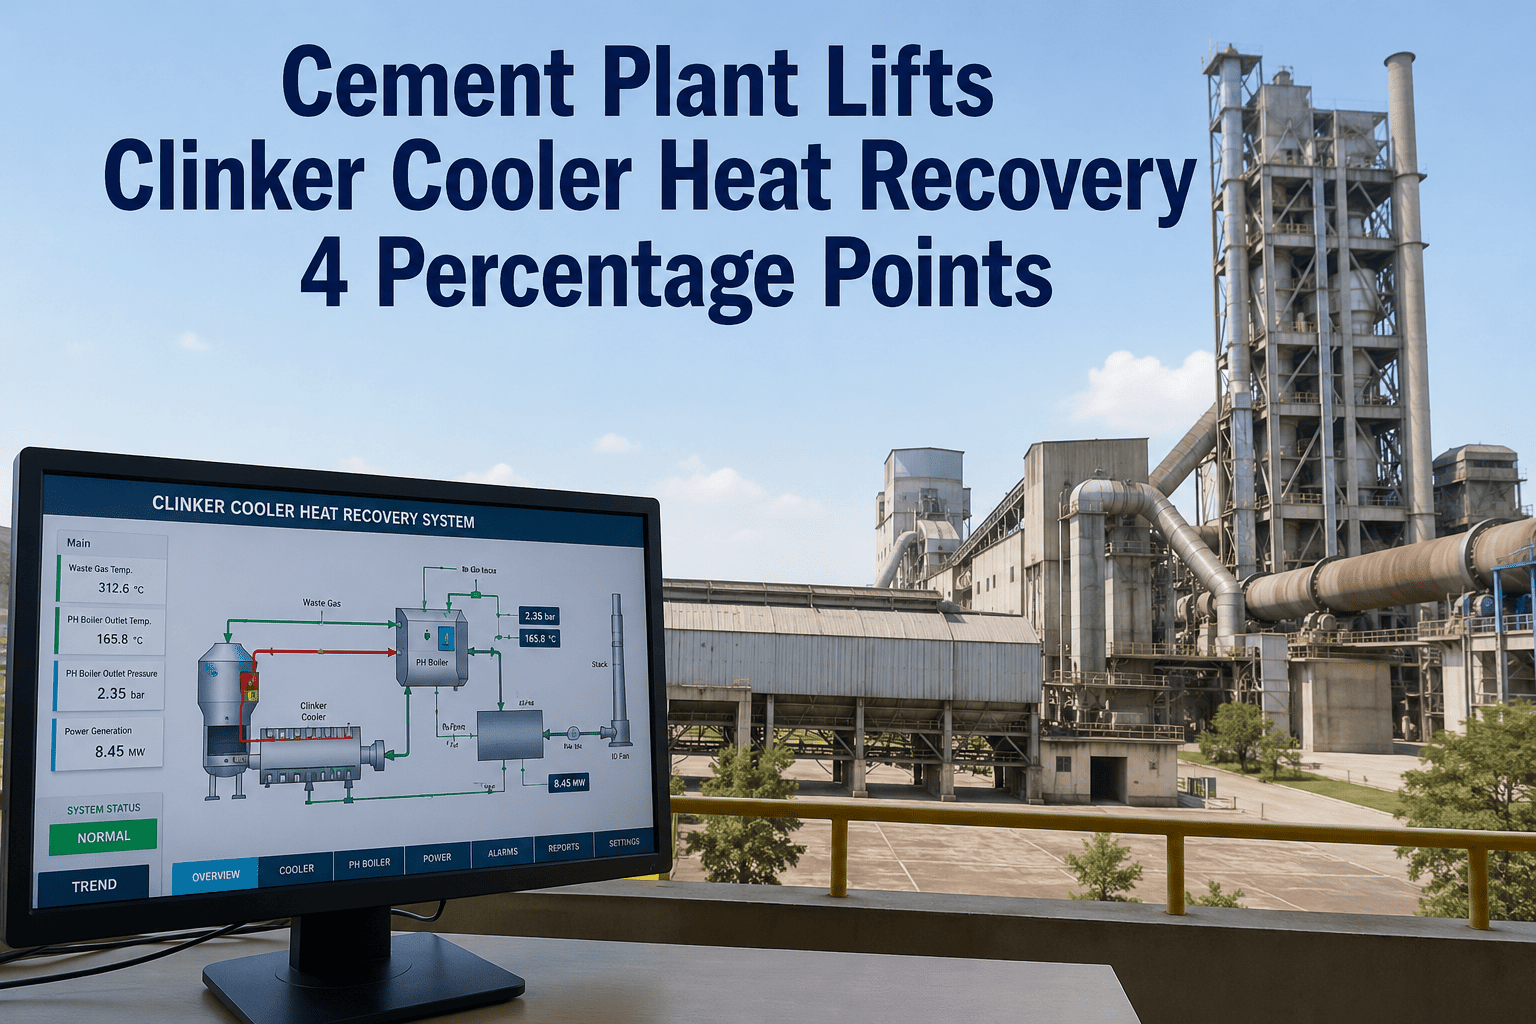
A waste heat recovery system turns kiln and cooler exhaust into electricity, and its rated output says little about what a plant actually recovers. Fouled boiler tubes, bypass events, turbine faults, and kiln stops all pull generation below the nameplate, often without a clear record of why. Good KPIs separate what the kiln delivered from what the recovery plant did with it, and link every shortfall to a maintenance cause. This guide defines a practical KPI set for cement WHR and shows how Oxmaint maintenance software connects those numbers to scheduled work.
Cement Waste Heat Recovery Performance and Maintenance KPIs
Measure recovered energy, availability, and the health of every asset in the chain, from the boilers to the grid connection. Then use the gap between design and actual to decide where maintenance effort pays back.
Why a rated capacity is not a performance measure
A WHR plant has a design capacity, but generation depends on the heat the kiln supplies and on the condition of every asset between that heat and the meter. Without KPIs, a loss from any of them looks like a normal day.
What a nameplate tells you
- The output the plant can reach under design conditions
- The size of the turbine and generator
- A target that every month is measured against
What KPIs add
- How much was actually recovered per tonne of clinker
- How much loss came from the kiln, the plant, or the grid side
- Which asset and which event caused each shortfall
- Whether maintenance actions raised recovery afterwards
The core performance KPIs
Define each one precisely and publish the formula. Disagreement over definitions causes more reporting arguments than disagreement over numbers.
| KPI | Definition | What it tells you |
|---|---|---|
| Gross generation | Energy at the generator terminals over a period | Total output before auxiliary use |
| Net generation | Gross kWh minus WHR auxiliary kWh | Energy actually delivered to the plant |
| Specific generation | Net kWh divided by tonnes of clinker produced | Recovery per tonne, comparable across periods and lines |
| Capacity factor | Net kWh divided by rated output times hours in period | Share of design capacity delivered over time |
| Grid offset | WHR net kWh divided by total plant kWh, as a percentage | Share of plant electricity replaced by recovered heat |
| Auxiliary load ratio | Auxiliary kWh divided by gross kWh | Cost of running the recovery plant itself |
Availability: separating WHR reliability from kiln downtime
A WHR plant cannot run when the kiln is stopped, so a simple availability figure blames the recovery plant for kiln events. Split the hours so each team sees what it controls.
Tie every lost kilowatt-hour to a cause
Log WHR downtime with cause codes, assets, and durations, then review availability and recovery next to maintenance work in one place.
Where recovered energy leaks away
A loss tree turns a vague shortfall into a list of causes with owners. Build one each month and rank the branches by lost kilowatt-hours.
Maintenance KPIs behind the recovery numbers
Output KPIs show the result. Maintenance KPIs show whether the plant is being looked after in a way that will keep the result stable.
Condition signals worth trending on each asset
These readings give early warning. Set baselines when equipment is clean and healthy, then track movement against them.
| Asset | Signal to trend | What a change may mean | Maintenance response |
|---|---|---|---|
| Heat recovery boilers | Gas inlet and outlet temperature, draft loss, steam output | Tube fouling, ash accumulation, or leaks | Cleaning, tube thickness checks, leak inspection |
| Steam turbine | Vibration, bearing temperature, inlet pressure and temperature | Wear, imbalance, lubrication problems | Vibration analysis, oil sampling, inspection |
| Generator | Winding and bearing temperature, electrical readings | Cooling issues or insulation degradation | Electrical tests and cooling checks |
| Condenser and cooling tower | Back pressure, cooling water temperature, approach | Fouling, fill degradation, or fan faults | Cleaning, fill inspection, fan maintenance |
| Bypass dampers | Number and duration of bypass events, position feedback | Sticking dampers or process-driven diversions | Actuator checks, logging cause for each event |
| Feed water and chemistry | Conductivity, pH, and treatment records | Scaling or corrosion risk inside boilers | Treatment adjustment and sampling schedule |
Normalising generation so comparisons are fair
Raw kilowatt-hours move with kiln output and weather. Normalise before comparing months, lines, or plants, and keep both the raw and normalised figures visible.
- Compare at similar kiln load bands, since boiler gas flow and temperature follow load.
- Note ambient temperature and cooling water temperature, which affect condenser back pressure.
- Separate periods when heat was diverted to raw material drying from periods when it was not.
- Record clinker type and fuel mix changes that alter exhaust gas conditions.
- Keep metering points and meter calibration records so the baseline can be defended.
Who reads which KPI
One dashboard rarely suits every audience. Give each group a small set of measures that match the decisions they make.
Plant leadership
- Grid offset and net generation per tonne
- Value of lost generation by cause
- Trend against budget and last year
Energy and operations
- Capacity factor and WHR availability
- Bypass events with cause and duration
- Heat transfer and back pressure trends
Maintenance
- PM compliance and overdue tasks
- Forced outage hours and repeat faults
- Mean time between trips and time to repair
Recording downtime so it can be analysed later
Free-text stop reasons make analysis almost impossible. A short, fixed set of fields makes every event countable.
From a falling KPI to a maintenance action
The fastest improvement comes from a known response to each pattern. Use this lookup as a starting point and refine it with your own findings.
| KPI movement | Likely area | First check |
|---|---|---|
| Specific generation falling slowly over weeks | Boiler fouling or condenser performance | Heat transfer against baseline, back pressure, cleaning history |
| Sudden drop in gross output at steady kiln load | Boiler leak, turbine derate, or bypass | Alarm log, bypass position, steam parameters |
| Auxiliary load ratio rising | Fan or pump inefficiency, or fouled flow paths | Motor current, fan curves, filter and strainer condition |
| Availability falling with frequent short trips | Protection settings, instruments, or valve faults | Trip log, instrument calibration, valve response |
| Many bypass events with unclear cause | Damper actuators or process coordination | Actuator checks and a rule for logging each event |
| Generation low only in warm months | Cooling system capacity | Cooling tower fill, fan operation, water treatment |
Questions that expose weak WHR reporting
Ask these in your next review. If the room cannot answer quickly, the KPI set or the records behind it need work.
- How many hours did the kiln run, and how many did WHR run?Without both numbers, availability cannot be separated from kiln downtime.
- What was the biggest single loss last month, and who owns it?A loss without an owner will repeat. Assign a name and a due date.
- Which maintenance tasks were overdue when generation dropped?This links record keeping to results and shows which schedules matter most.
- Did the last cleaning or repair raise recovery, and by how much?Without a before and after comparison, maintenance value stays invisible.
Starting a WHR KPI program in four steps
Begin with what you already measure. A basic, trusted set beats an ambitious dashboard that nobody believes.
A monthly WHR review that drives action
A fixed review keeps the KPIs from sitting on a dashboard. Walk the same steps each month with operations, maintenance, and energy teams.
- Confirm the numbersCheck meter data, clinker tonnage, and hours so everyone trusts the baseline.
- Rank the lossesOrder loss causes by lost kilowatt-hours and pick the top two or three.
- Check the maintenance recordCompare each loss with overdue tasks, repeat faults, and recent repairs.
- Agree actionsAssign owners and dates, such as added cleaning or a damper inspection.
- Verify last month's fixesCheck whether earlier actions improved recovery or heat transfer.
Reporting pitfalls that mislead decisions
Most WHR reporting problems come from how numbers are defined and combined, not from the meters themselves.
Maintenance rhythm that protects recovery
Use this as a starting point. Set final intervals from supplier guidance, boiler regulations that apply at your site, and your own failure history.
Daily and weekly
- Log gas temperatures, steam parameters, and turbine readings
- Review bypass events and their causes
- Check ash discharge and hopper operation
- Inspect leaks, noise, and vibration on rounds
Monthly and quarterly
- Compare heat transfer with the clean baseline
- Test safety devices and protection trips
- Sample oil and review vibration trends
- Inspect condenser and cooling system performance
Planned outage
- Clean boiler tubes and measure thickness at erosion points
- Inspect turbine internals and generator condition
- Overhaul dampers and actuators
- Complete statutory inspections and record results
How Oxmaint supports WHR maintenance and KPIs
Oxmaint is maintenance management software. It does not replace your plant historian or metering, but it holds the asset history, schedules, and work orders that explain why the numbers move.
WHR performance and maintenance KPI FAQs
Which KPI should a plant start with?
Start with net generation per tonne of clinker and WHR availability measured against kiln running hours. They separate recovery performance from kiln events.
Why does specific generation vary from month to month?
Kiln load, ambient temperature, boiler fouling, and bypass events all move it. Log each so that changes can be explained and acted on.
Can a CMMS calculate generation KPIs?
Metering and historian systems measure energy. A CMMS records the maintenance behind it, and Oxmaint links both views in reviews.
How often should boilers be cleaned?
It depends on dust load and design. Trend heat transfer against a clean baseline and clean when recovery falls past an agreed threshold.
What is a sensible first step?
Build the asset list and log downtime causes for a quarter. Book a demo to plan schedules and reports.
Recover more of the heat your kiln already makes
Give energy, operations, and maintenance teams one record of WHR availability, losses, and corrective work, so output stays close to design.