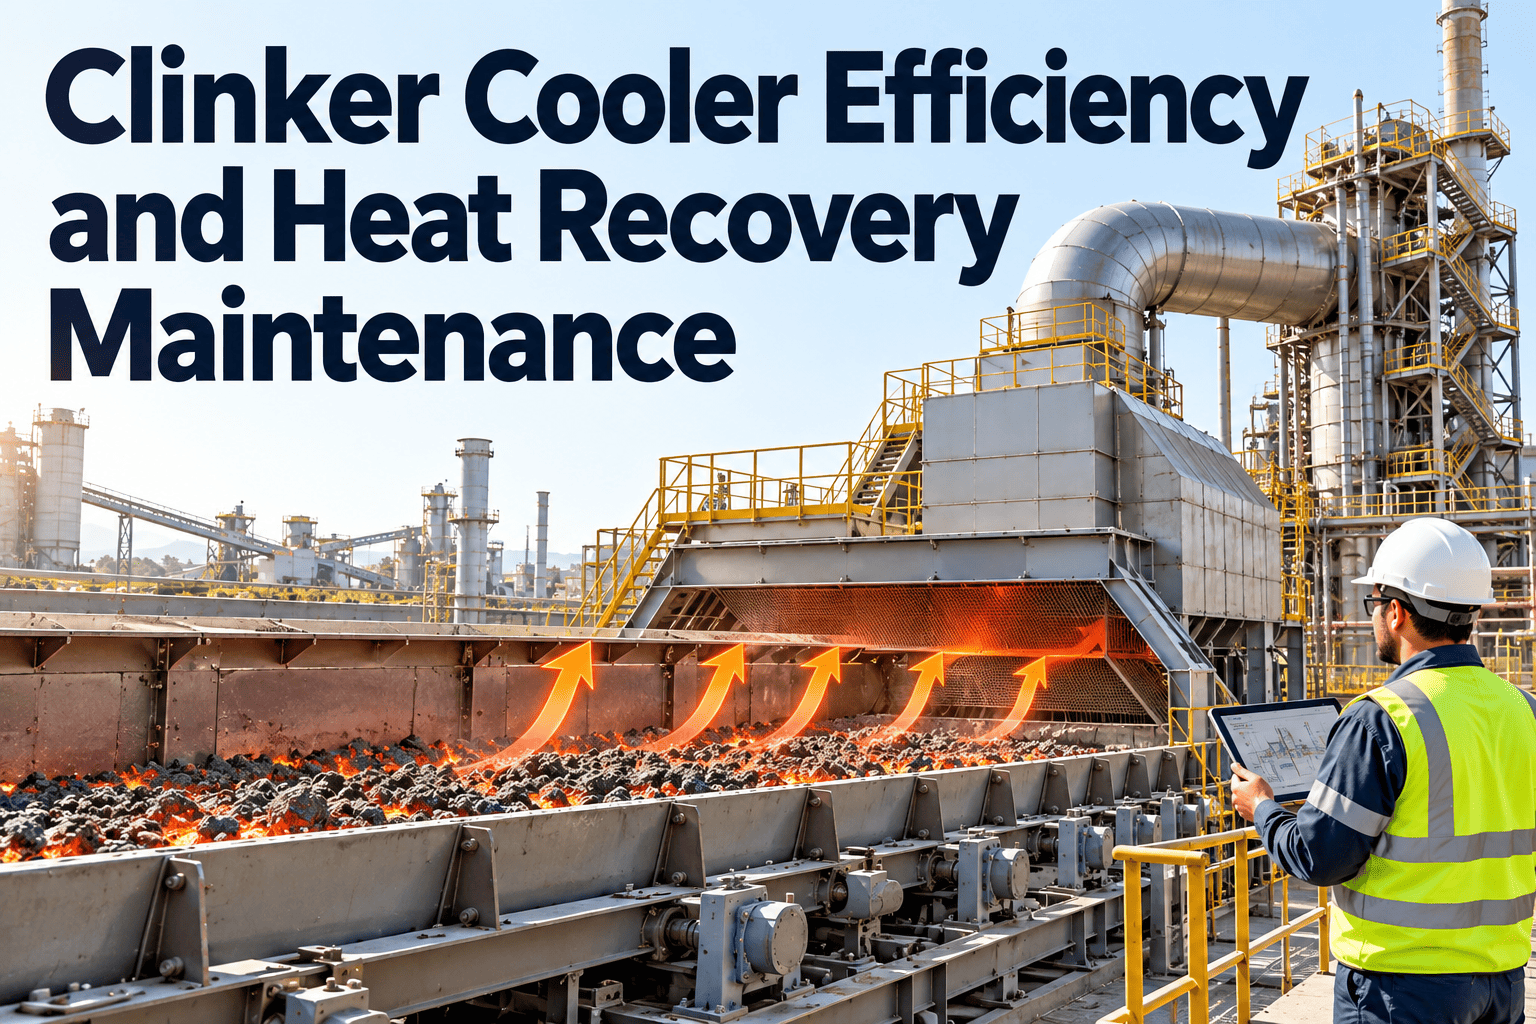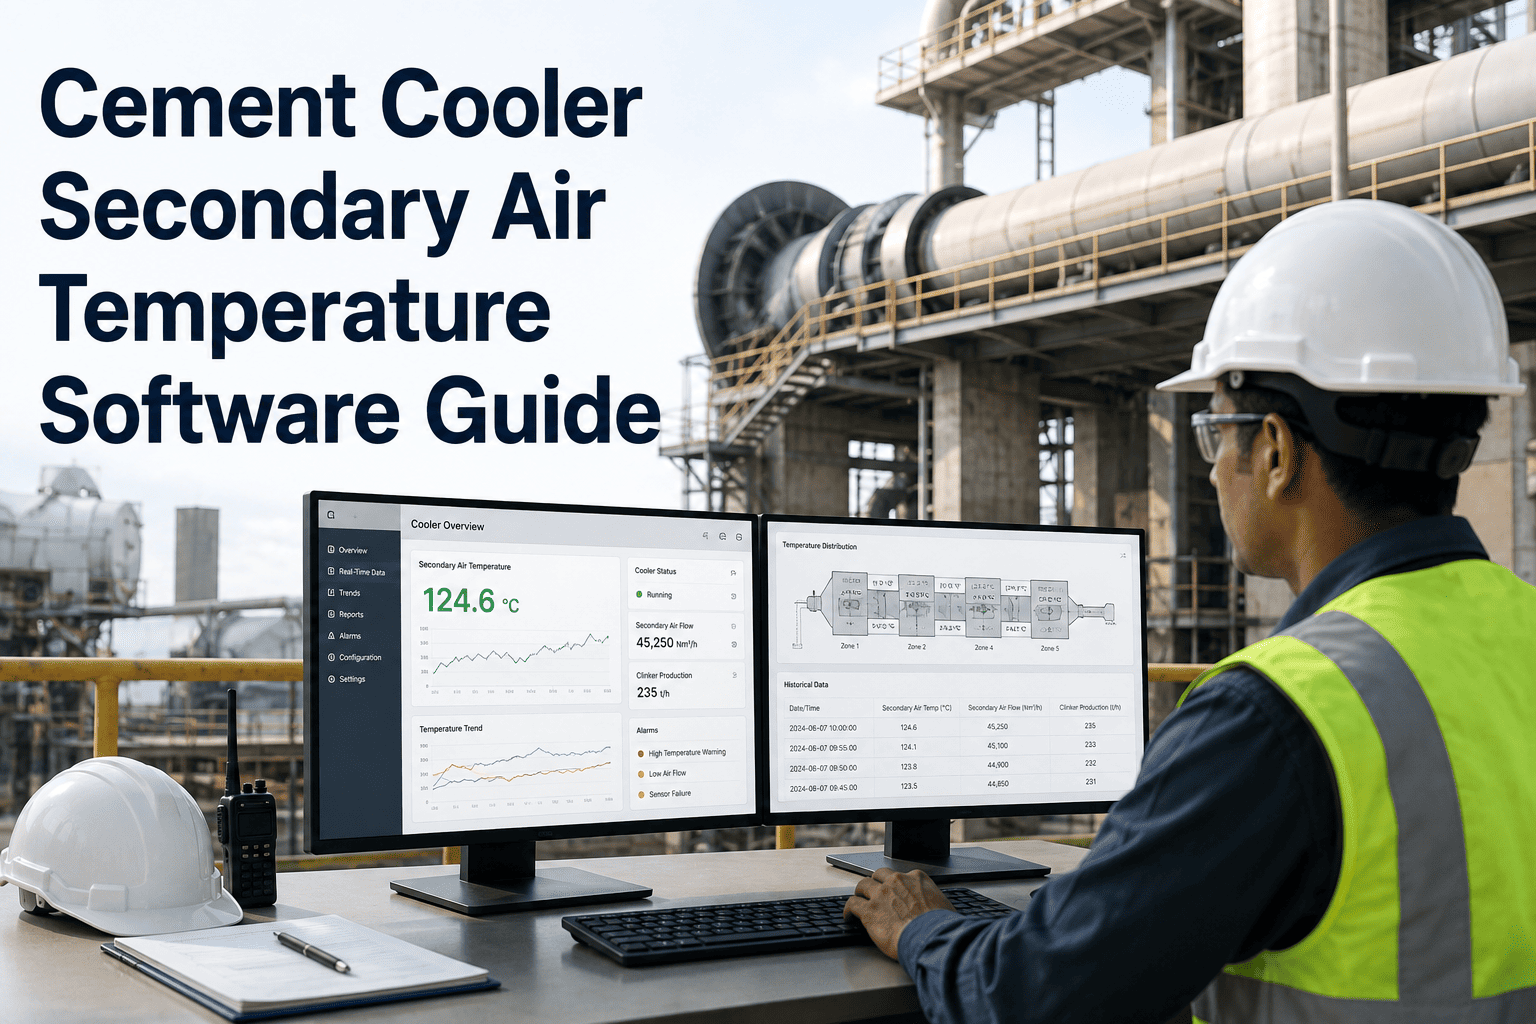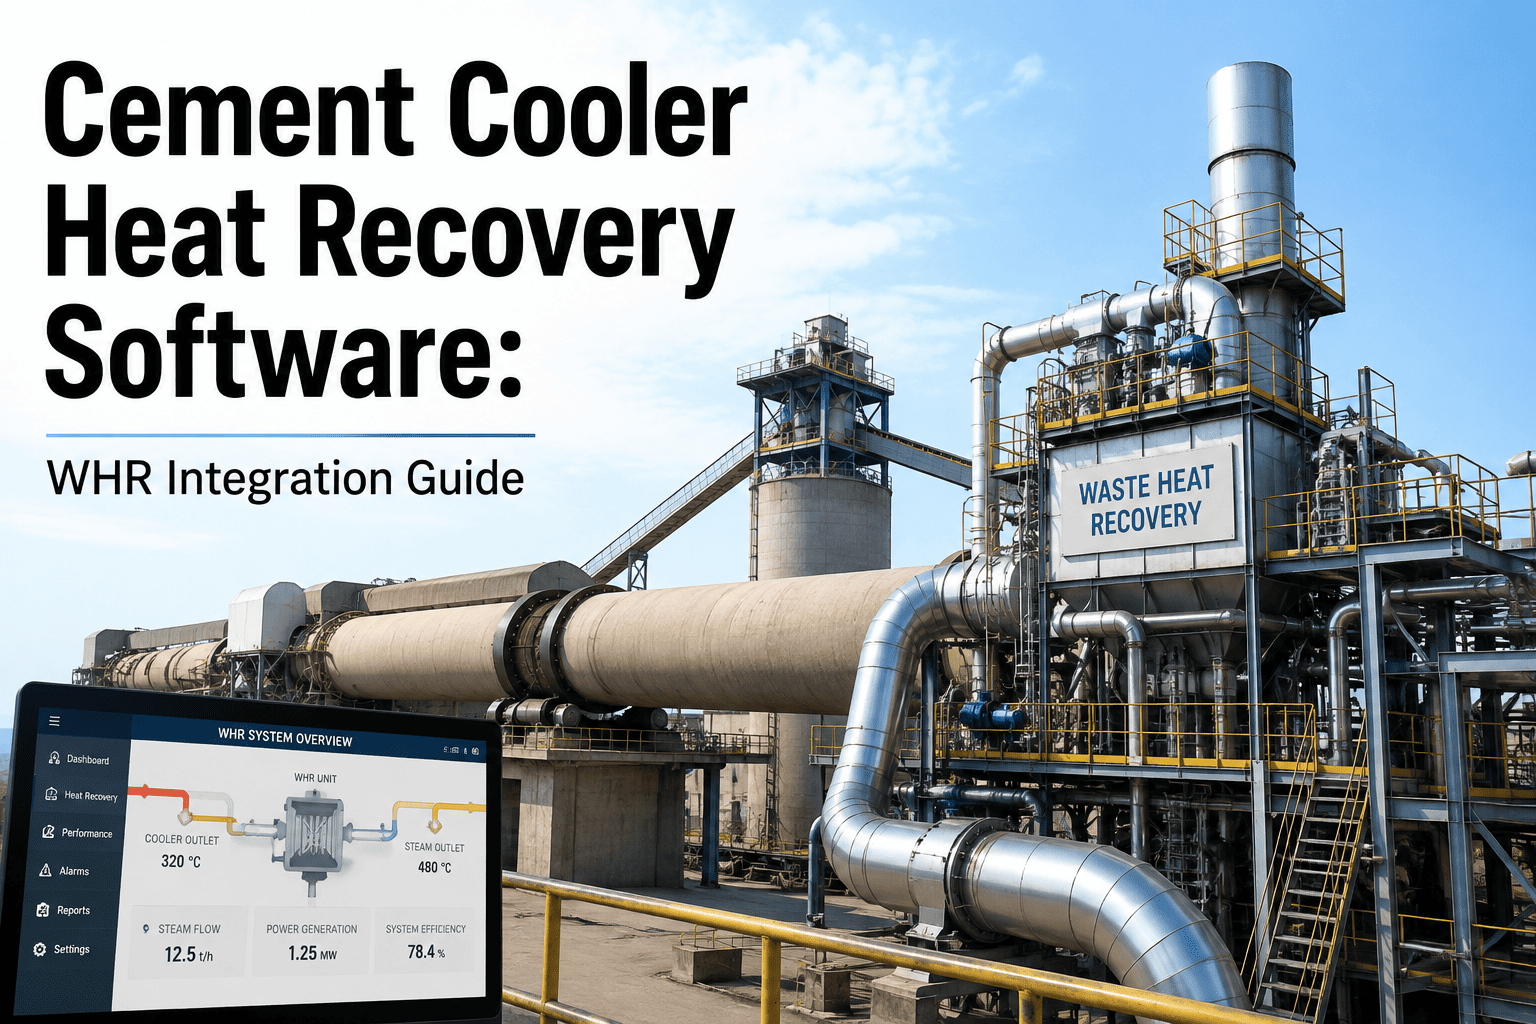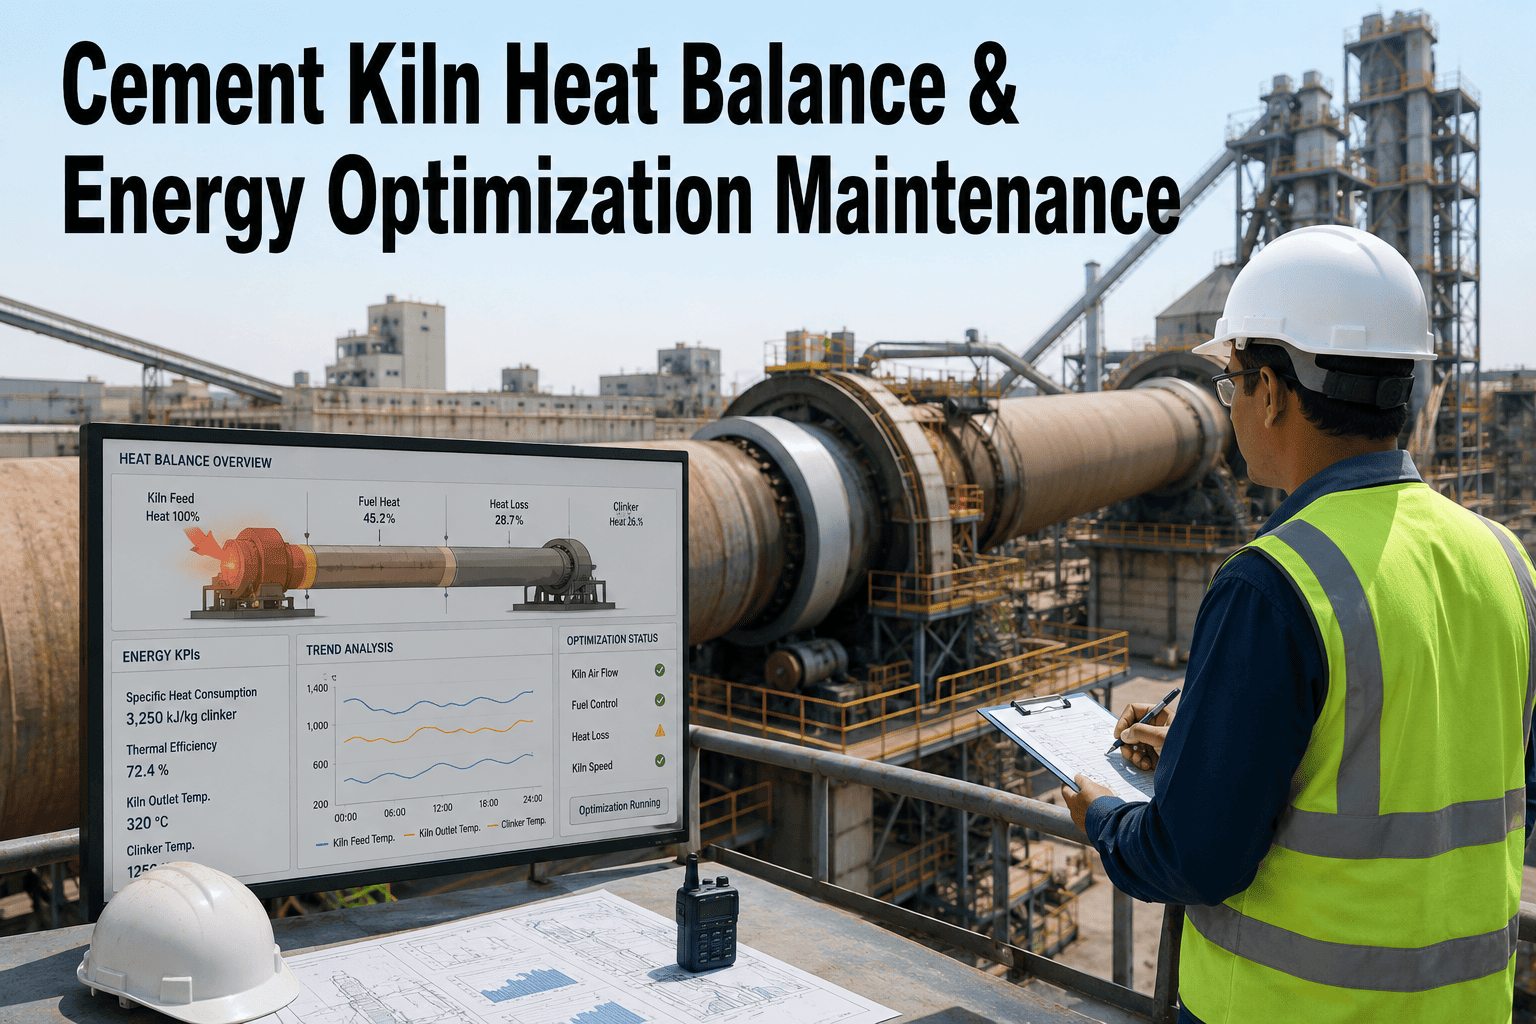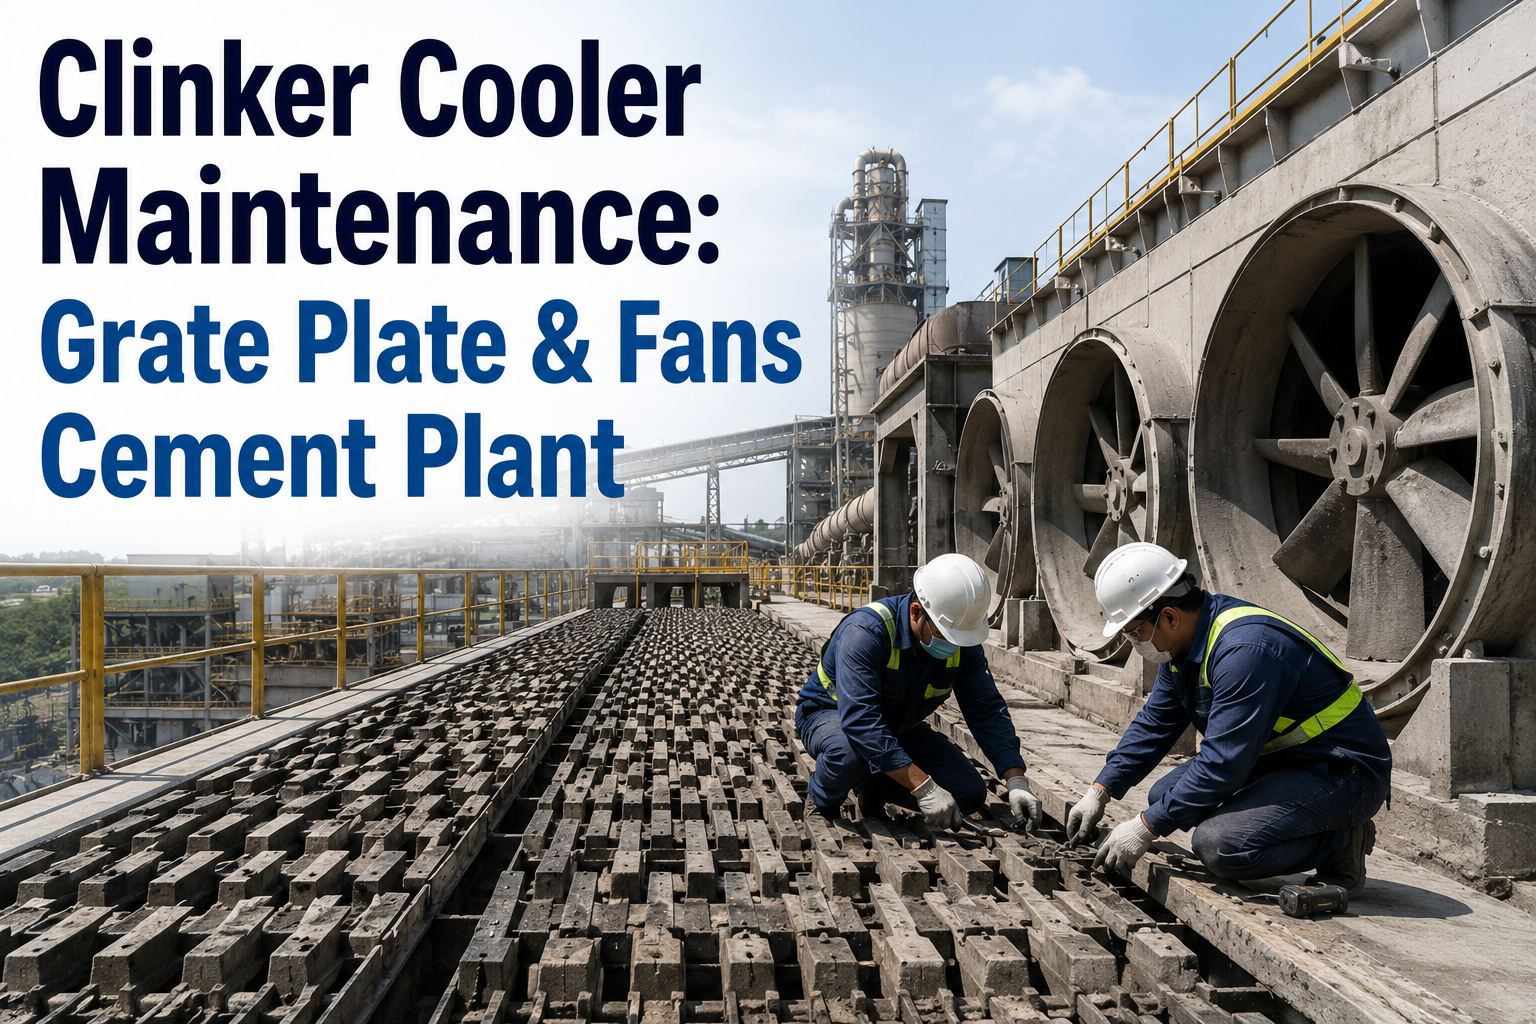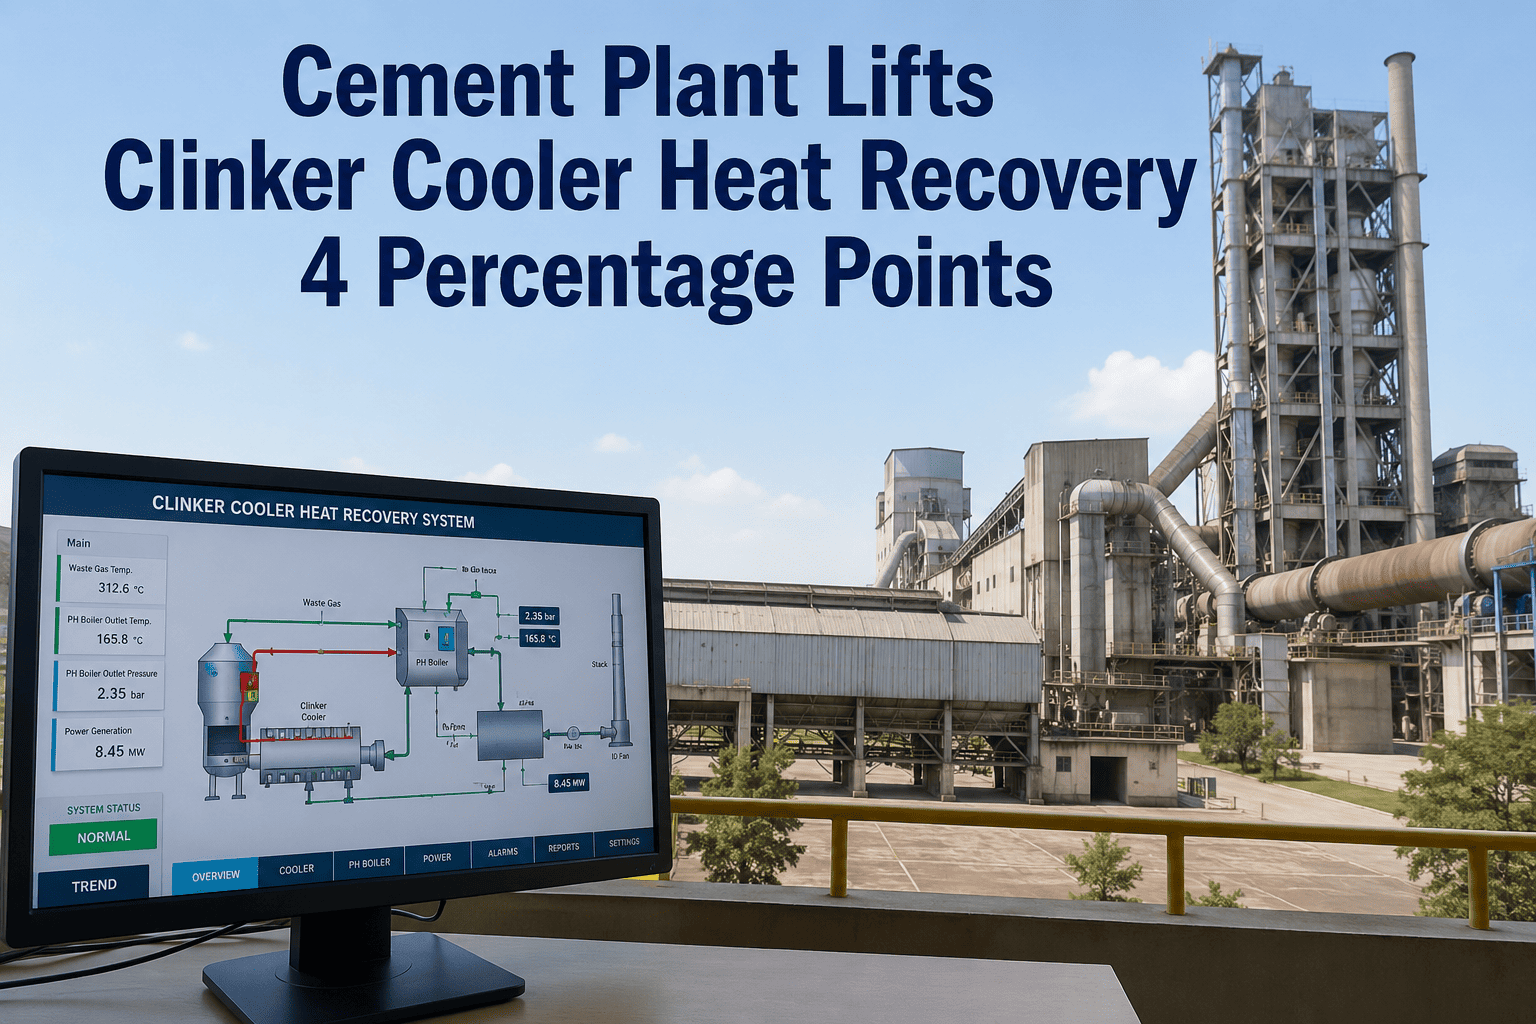
Clinker cooler efficiency is the single largest controllable lever for kiln thermal performance in a cement plant — every percentage point of cooler efficiency lost translates directly into additional fuel burned in the kiln and reduced secondary air temperature feeding the burner. Modern grate coolers recover 60–75% of clinker sensible heat as secondary and tertiary air, and even a 2% drop in recovery rate can add six figures of annual fuel cost at a 5,000 TPD operation. This guide covers the maintenance program — grate plate inspection, false air control, fan automation, WHR integration, and CMMS-driven PM scheduling — that keeps cooler efficiency high and heat recovery continuously available. Ready to stop bleeding heat? Start Free Trial with Oxmaint and build your cooler reliability program today.
Is your clinker cooler quietly burning $200K+ in wasted fuel every year?
A 2% drop in cooler efficiency at a 5,000 TPD plant raises kiln fuel consumption by roughly 18 kcal/kg clinker — and most teams never see it until the monthly energy bill arrives. The leak points hide in grate seals, fan curves, and false-air paths. Here is how to find and fix them.
Why one point of cooler efficiency equals a five-figure fuel swing
A modern grate cooler on a 5,000 TPD kiln recovers roughly 180–220 kcal per kg of clinker as preheated combustion air. When recovery falls, the kiln burner compensates with more fuel, the tertiary air to the calciner drops in temperature, and the WHR boiler sees a cooler gas stream. The loss compounds across three systems at once.
Fuel penalty of a 2% cooler efficiency drift
The five leak paths that quietly drain cooler recovery
Heat recovery loss is rarely one catastrophic failure — it is the sum of five small drifts that a CMMS-based PM program catches early. Below: each failure mode, its signature, and the maintenance response.
Grate plate wear and hole enlargement
Worn grate slots let clinker fines fall through and redirect under-grate pressure. A 5 mm slot wear on a travelling grate can drop secondary air temperature by 40–60°C and increase under-grate power draw. Inspect plates every 8–12 weeks using a borescope through the sidewall access ports; replace at 30% slot enlargement.
False air ingress at seals and expansion joints
The kiln hood seal, cooler inlet seal, and tertiary air duct expansion joints are the three largest false-air paths. A 5% false-air rate at the hood drops secondary air temperature by 80–120°C. Perform quarterly O2 tracer or pressure-decay testing; rebuild mechanical seals on a 6-month PM cycle, not wait-to-failure.
Fan curve drift and damper misalignment
Cooler fan efficiency degrades as impellers erode and dampers drift out of calibration. A 10% airflow error on the secondary air fan alone shifts the stoichiometric balance and raises fuel by 1.5–2%. Trend fan motor current vs. damper position monthly; recalibrate actuators and verify curves with a portable anemometer every 6 months.
Clinker bed permeability collapse
Fines accumulation, snowman formation, and red river flow short-circuit the air bed and leave hot clinker in the discharge. Monitor bed pressure differential across each grate compartment; a 15% drop signals channeling. Schedule bed-condition camera inspections every 2 weeks and air-blast cleaning as a condition-triggered work order.
WHR evaporator fouling at the cooler take-off
The AQC (air quenching cooler) boiler downstream of the cooler takes mid-temperature gas. Dust buildup on evaporator tubes can cut heat transfer by 8–12% within weeks. Integrate soot-blow and on-load cleaning into the cooler CMMS route; tie cleaning frequency to gas-side pressure drop trend, not a fixed calendar.
The clinker cooler PM schedule that holds efficiency flat
Best-in-class plants hold cooler efficiency within ±1% of design across a 12-month campaign using a tiered PM program. Below is the schedule Oxmaint deploys as condition- and time-based work orders in a single CMMS environment.
| Cadence | Task | Target metric | Typical downtime |
|---|---|---|---|
| Daily | Bed pressure, fan current, secondary air temp trend review | SAT ± 15°C of baseline | 0 (inline) |
| Weekly | Clinker bed camera inspection, snowman check, red-river scan | Bed ΔP within 10% | 30 min |
| Monthly | Fan damper position calibration, motor current vs. curve | Airflow error < 5% | 2 h |
| Quarterly | Hood + tertiary duct seal O2 / pressure-decay test | False air < 4% | 4 h |
| 8–12 weeks | Grate plate borescope inspection, slot wear log | Slot wear < 30% | 6 h |
| 6 months | Mechanical seal rebuild, fan impeller erosion NDT | Seal gap < 2 mm | 24 h |
| Annual | Full grate segment replacement, WHR evaporator hydro-clean | Recovery within 2% of design | 72–96 h |
A 6-month path from drifting efficiency to a stable recovery curve
A plant with a 5,000 TPD line, secondary air temperature drifting from 1,050°C down to 970°C over 14 months, and WHR output down 7% ran this sequence through Oxmaint's CMMS. Result by month six: secondary air back to 1,045°C, cooler efficiency up 3.2 points, WHR power restored.
Install or recalibrate secondary air thermocouples, under-grate pressure transmitters, and fan flow meters. Establish the efficiency baseline: recovery %, false-air %, specific cooler power. Every reading logged automatically in the CMMS asset register.
Run an O2 tracer test on the hood seal, cooler inlet, and tertiary duct. Rebuild two of three failed seals. False-air rate drops from 6.8% to 3.9%. Secondary air temperature rises 35°C in the first two weeks after the rebuild.
Calibrate all cooler fan dampers, verify impeller condition with NDT, and tune the secondary air fan curve. Move fan control from manual to cascade mode tied to kiln hood draft. Specific cooler power drops 0.4 kWh/t clinker.
Borescope-grade 12 grate compartments, replace 4 plates showing >30% slot wear, and install a condition-triggered air-blast work order for snowman risk. Bed pressure differential stabilizes; red-river incidents drop to zero.
Re-tie AQC boiler soot-blow frequency to gas-side pressure drop trend. Evaporator heat transfer recovers 9%. WHR gross power output returns to within 2% of design — the recovery that had been quietly lost for 14 months.
Cooler efficiency holds at 71.8% (up from 68.6%). All PM routes, condition triggers, and KPIs now live in Oxmaint with mobile execution and auto-escalation. Maintenance cost per ton of clinker drops 14%; fuel per kg drops 11 kcal.
What a tuned cooler program returns to the bottom line
A 180-asset cement plant in South-East Asia ran the full Oxmaint cooler PM and WHR integration program for 12 months. Below: the before/after on the metrics that hit the P&L. The payback on CMMS, labor, and spares combined was under five months.
Drifting cooler, manual PM
- 68.6% cooler heat recovery
- 970°C secondary air temperature
- 6.8% false-air ingress
- 880 kcal/kg clinker (kiln fuel)
- 7.4 kWh/t cooler specific power
- −7% WHR power vs. design
CMMS-driven PM + WHR tuning
- 71.8% cooler heat recovery
- 1,045°C secondary air temperature
- 3.9% false-air ingress
- 869 kcal/kg clinker (kiln fuel)
- 7.0 kWh/t cooler specific power
- −2% WHR power vs. design
"We had been chasing kiln fuel cost for two years without realizing the cooler was the leak. Within six months on Oxmaint we recovered 3.2 points of efficiency and brought secondary air back to 1,045°C. The CMMS payback was under five months."
How this program maps to ISO 55000 and TPM
The cooler PM architecture described here is not a custom invention — it is the maintenance expression of ISO 55000 asset management and Total Productive Maintenance principles applied to thermal recovery assets. Each CMMS work order carries an asset criticality rating, a failure mode tag, and a KPI linkage so audit trails are clean.
ISO 55000 alignment
Each cooler asset (grate, fan, seal, WHR evaporator) carries a documented criticality, failure mode, and KPI in the asset register. Maintenance plans are reviewed against asset performance quarterly — the closed loop the standard requires.
TPM autonomous maintenance
Daily bed-pressure and secondary-air-temperature reviews sit with kiln operators as autonomous checks, pushed to their mobile devices. Maintenance owns the deeper weekly and quarterly routes. This split matches the TPM model and cuts reactive work orders by 35%.
OEE for thermal assets
Cooler efficiency, secondary air temperature stability, and WHR availability are tracked as an OEE-style composite for the thermal recovery train. Target: availability 95%, efficiency 70%+, quality (gas temperature stability) 98% — reviewed monthly in the CMMS dashboard.
Every week of drift is $4,600 in fuel you will never recover.
Deploy Oxmaint's clinker cooler PM and heat recovery program in days, not months. Mobile work orders, condition triggers, and ISO 55000 audit trails — built for cement.
Answers cement maintenance leaders ask before deploying
What is a healthy secondary air temperature for a modern grate cooler?
For a 5,000 TPD travelling-grate cooler firing conventional fuel, secondary air temperature should sit between 1,050°C and 1,150°C. Anything below 1,000°C sustained typically indicates false-air ingress, grate plate wear, or fan drift. The exact target depends on kiln size and fuel mix, but the variance band — not the absolute — is what a CMMS trend catches first.
How much false air is acceptable at the kiln hood and cooler inlet?
Industry benchmark is under 4% false-air ingress measured at the hood seal and cooler inlet combined. Plants above 6% are almost always paying a measurable fuel penalty — typically 10–18 kcal/kg clinker. A quarterly O2 tracer or pressure-decay test, scheduled in the CMMS, is the cheapest insurance against this drift. You can set this up in minutes when you Start Free Trial.
How does cooler maintenance affect Waste Heat Recovery (WHR) output?
The AQC boiler downstream of the cooler takes mid-temperature gas (typically 280–360°C). If cooler efficiency drops, less heat goes into secondary air but the gas temperature to the AQC can either spike (overloading tubes) or collapse (starving the boiler) depending on the failure mode. Either way WHR power output drops 5–9%. Cleaning evaporator fouling and stabilizing cooler gas temperature are WHR-critical PM tasks.
Can cooler fan automation actually reduce specific power consumption?
Yes. Moving cooler fans from manual damper control to cascade control tied to kiln hood draft and bed pressure typically saves 0.3–0.6 kWh per ton of clinker. At 5,000 TPD that is roughly $70–90K per year. The prerequisite is that dampers are calibrated, impellers are sound, and fan curves are verified — all PM tasks the CMMS schedules and tracks.
How long does it take to deploy Oxmaint for a clinker cooler PM program?
Most plants are live in 2–4 weeks. The asset register, PM routes, condition triggers, and KPI dashboard are configured from a cement-specific template, then validated against your existing P&ID and historian. To see the exact deployment plan for your line, Book a Demo and we will walk through your cooler, WHR, and kiln integration points.
Recover the 3 points of efficiency your cooler is losing this quarter.
Build the PM program, the condition triggers, and the WHR integration that holds clinker cooler efficiency flat — month after month, campaign after campaign.
Free 14-day trial · No credit card