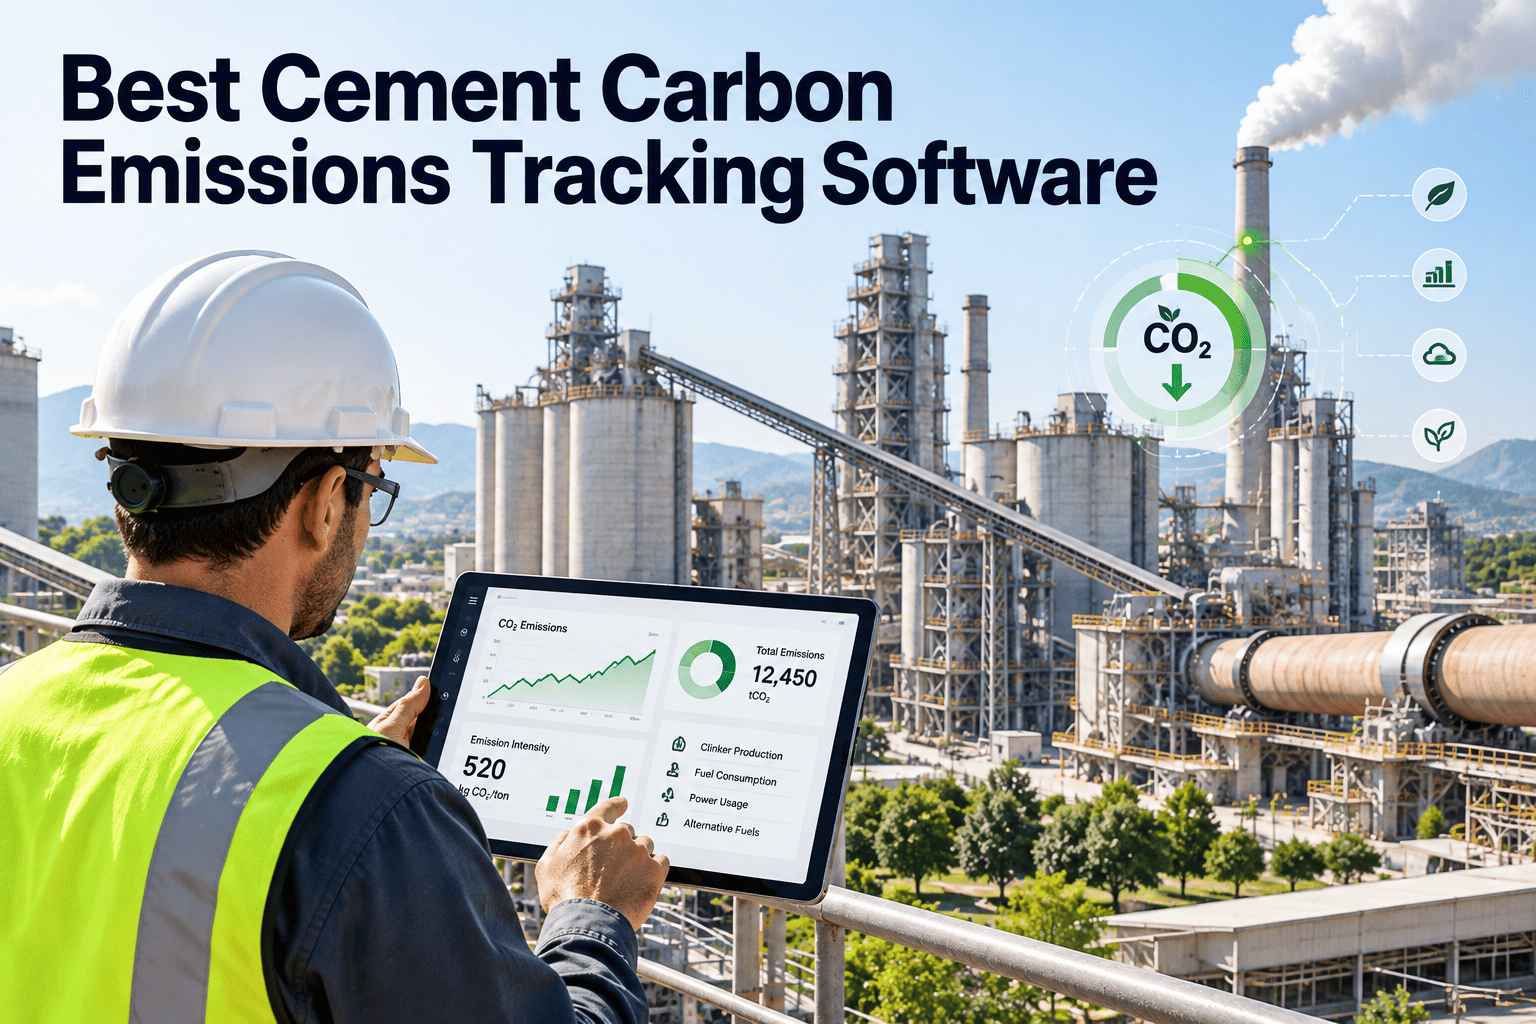
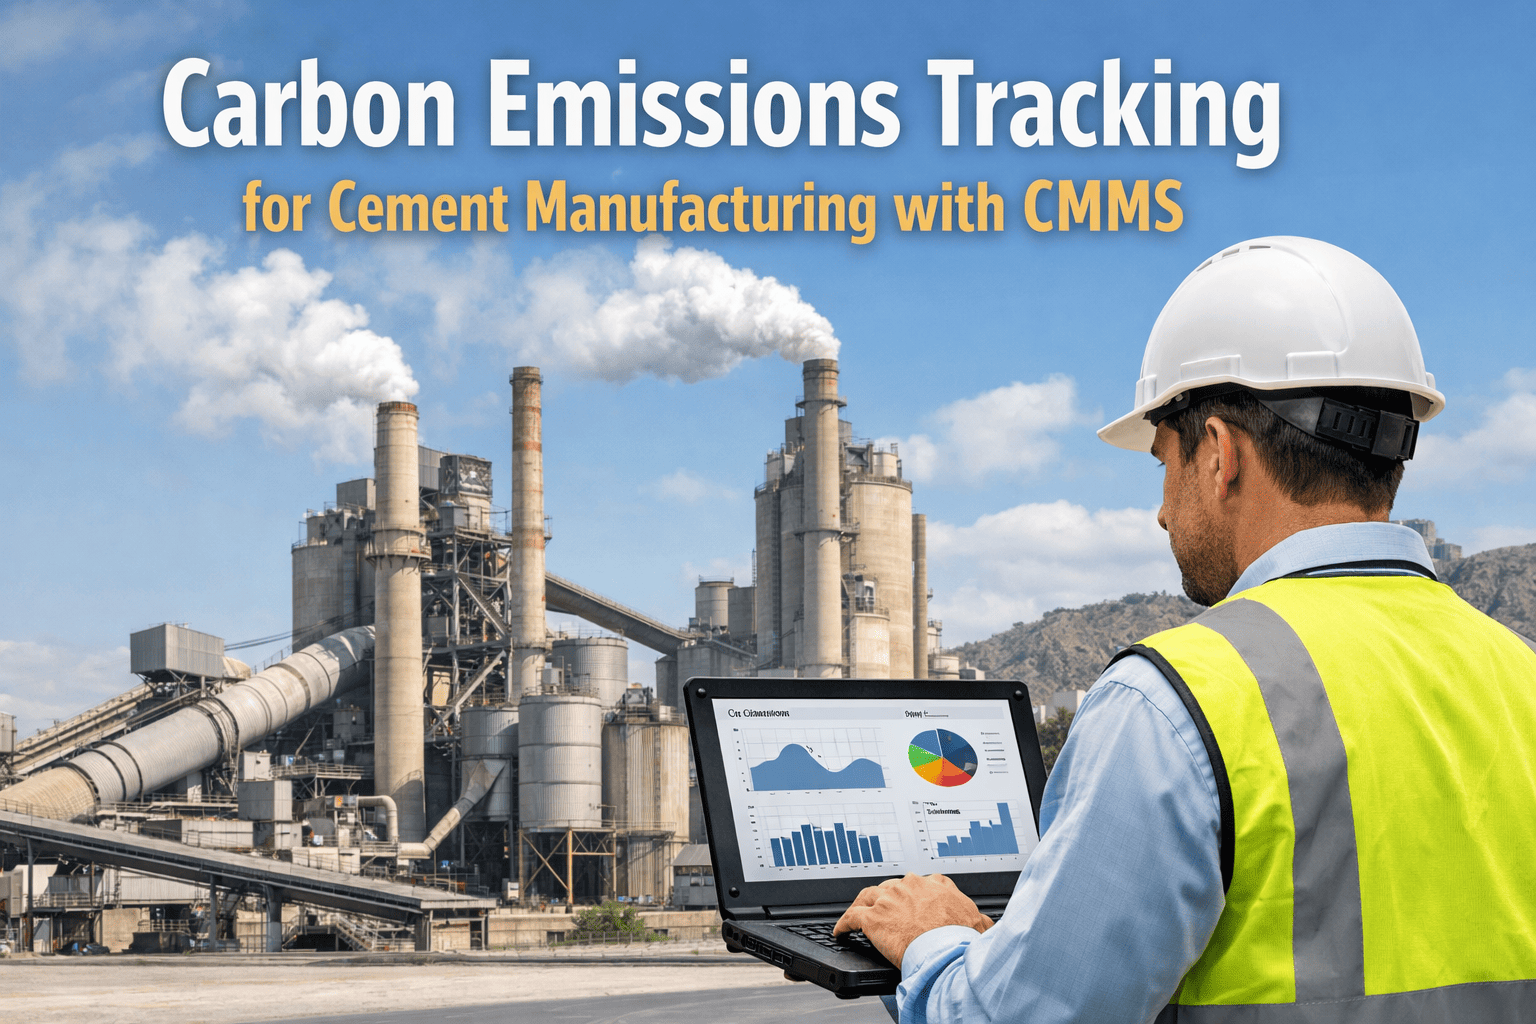
The cement industry accounts for approximately 8% of global CO₂ emissions, making it one of the most carbon-intensive sectors under regulatory scrutiny. With the EU Emissions Trading System (ETS) entering Phase 4 and the Carbon Border Adjustment Mechanism (CBAM) phasing in from 2026, cement manufacturers face a seismic shift in compliance costs and competitive dynamics.
This executive guide breaks down what cement producers need to know — from shrinking free allowances to CBAM reporting obligations — and how digital emissions tracking can turn regulatory burden into operational advantage. Start your compliance tracking pilot today.
REGULATORY COMPLIANCE GUIDE
EU ETS and CBAM Compliance for Cement Manufacturers
From free carbon allowances to full carbon pricing: a strategic roadmap for cement producers navigating Europe's evolving emissions regulations
EU ETS Phase 4
CBAM 2026
Carbon Pricing
MRV Reporting
The Regulatory Landscape: What's Changing
The EU's "Fit for 55" package is fundamentally reshaping how cement manufacturers account for and pay for carbon emissions. Two mechanisms are converging simultaneously — tighter ETS caps and the introduction of CBAM — creating the most significant cost pressure the industry has faced. Get a compliance readiness assessment.
EU ETS — Phase 4 (2021–2030)
-4.3%
Annual Cap Reduction (Linear Reduction Factor increased to 4.3% from 2024)
What it means for cement: The total number of EU Allowances (EUAs) shrinks every year. Free allocation to the cement sector — currently shielding ~90% of benchmark emissions — will decline progressively and reach zero by 2034. Every ton of CO₂ above benchmark costs real money at market price.
2024
Free allocation begins declining. Revised benchmarks tightened by 2.5%.
2026
CBAM starts — free allowances reduced by 2.5% as CBAM phases in.
2030
Free allocation at ~50% of current levels. EUA prices projected €130-180/ton.
2034
Zero free allocation. Full carbon cost exposure for all cement production.
CBAM — Carbon Border Adjustment
2026
Financial obligations begin (transitional reporting since Oct 2023)
What it means for cement: CBAM requires importers of cement (and clinker) into the EU to purchase CBAM certificates matching the embedded carbon emissions. This levels the playing field between EU producers paying ETS costs and imports from regions with weaker carbon pricing — but it also means EU exporters lose the shield of free allowances.
2023-25
Transitional phase: quarterly reporting of embedded emissions, no financial cost.
2026
Definitive phase: CBAM certificates must be purchased. Price mirrors EU ETS.
2026-34
CBAM phases in as free ETS allowances phase out — a 1:1 mirror reduction.
2034+
Full CBAM. All cement imports pay full embedded carbon price at EU ETS rate.
Carbon Cost Impact: The Numbers That Matter
For a typical integrated cement plant producing 1.5 million tons per year, the financial impact of shrinking free allowances is measured in tens of millions. Plant directors and CFOs need to understand these numbers now to plan capital investments in decarbonization. Request a carbon cost projection for your plant.
⚠️
0.6 – 0.9 t CO₂
Emissions per Ton of Cement
Direct (Scope 1) emissions from calcination (~60%) and fuel combustion (~40%). Blended cements at the lower end; OPC/CEM I at the higher end.
?
€80 – €180/ton
EUA Price Range (2025–2030)
Carbon allowance prices have risen from €25 in 2020 to €65-80 in 2024-25. Analysts project €130-180 by 2030 as caps tighten and demand increases.
?
€15 – €45M/yr
Additional Carbon Cost (1.5 MT Plant)
As free allowances decline from ~90% to 0% coverage by 2034, a mid-size plant faces €15-45M in annual carbon costs — depending on efficiency and EUA prices.
?
€30 – €50/ton
Added Cost per Ton of Cement
Full carbon cost exposure translates to €30-50 added to each ton of cement. This fundamentally changes pricing strategies, product mix decisions, and investment calculus.
⚡ Critical Financial Insight
Every 0.01 reduction in clinker factor saves approximately 8 kg CO₂ per ton of cement. At projected 2030 EUA prices of €150/ton, that's €1.20 saved per ton — or €1.8M annually for a 1.5 MT plant. Clinker substitution isn't just an environmental choice; it's the single largest lever for carbon cost management.
Compliance Requirements: MRV Framework
Both EU ETS and CBAM mandate rigorous Monitoring, Reporting, and Verification (MRV) protocols. Non-compliance carries severe penalties — €100 per ton of unreported CO₂ under ETS, plus the obligation to surrender allowances. Digital tracking eliminates the manual burden and audit risk. Automate your MRV workflow.
M
Monitoring
✓
Fuel consumption tracking: Coal, petcoke, alternative fuels — mass flow, calorific value, emission factors per batch
✓
Raw material calcination: CaCO₃ content in limestone/marl, MgCO₃ content, calcination rates through kiln
✓
Process emissions: Bypass dust, CKD (Cement Kiln Dust), organic carbon in raw materials
✓
Continuous Emission Monitoring (CEMS): Required for installations above thresholds; calibration and QA/QC records
R
Reporting
✓
Annual Emissions Report (AER): Submitted by March 31 each year to national competent authority
✓
CBAM Quarterly Reports: Embedded emissions per product type, production methodology, source of electricity used
✓
Activity Level Reports: Annual production data for free allocation adjustment (cross-sectoral correction factor)
✓
Benchmark Data: Specific emissions per ton of clinker/cement vs. EU benchmark for allocation calculations
V
Verification
✓
Third-party audit: Accredited verifier reviews monitoring plan, data sources, calculations, and control systems annually
✓
Materiality threshold: Reported emissions must be accurate within 5% (2% for largest installations)
✓
Digital audit trail: Verifiers require traceable data chain from meter reading to reported figure — manual spreadsheets increasingly rejected
✓
Improvement reports: Verifier recommendations must be addressed; repeated non-conformities trigger enforcement
Manual MRV tracking is a ticking audit risk. Digitize your emissions monitoring, automate report generation, and maintain a verifier-ready audit trail with OxMaint's compliance module.
Digital Emissions Tracking: From Burden to Advantage
The complexity of ETS and CBAM reporting is growing exponentially. Plants must track emissions by product type, fuel source, and production line — then reconcile with free allocation formulas that change annually. Manual spreadsheets can't keep up. Digital tracking transforms compliance from a back-office burden into a strategic tool for carbon cost optimization. See the digital tracking platform.
Fuel meters: Direct integration with weighbridges, flow meters, and belt scales — no manual logging of coal, petcoke, or AF tonnages
Lab data: Auto-pull calorific values, emission factors, and CaCO₃ content from LIMS — eliminating transcription errors
CEMS integration: Continuous stack emission data fed directly into compliance calculations
Production volumes: Real-time clinker and cement tonnages by product type for per-product emission intensity
Live emissions counter: Running total of CO₂ emissions vs. free allocation balance — know your exposure at any moment
Per-product intensity: Track kg CO₂ per ton of each cement type (CEM I, CEM II, CEM III) to optimize product mix
Allowance management: Track EUA holdings, surrendered allowances, and forecast year-end surplus/deficit
Cost projection: Multiply emission gap × current EUA market price = real-time carbon cost exposure in euros
AER pre-fill: Annual Emissions Report auto-generated from verified data — review and submit, don't build from scratch
CBAM reports: Quarterly embedded emissions reports with product-level granularity ready for EU CBAM registry
Audit packages: One-click export of complete data trail, calculation methodologies, and supporting evidence for verifiers
Benchmark comparison: Automatic comparison of plant-specific emissions against EU clinker and cement benchmarks
Reactive Compliance vs. Strategic Carbon Management
There are two approaches to carbon regulation: treat it as a compliance checkbox, or use it as a lens for operational optimization. The financial gap between the two widens every year as carbon prices rise. Request a carbon cost optimization review.
Reactive Compliance (Minimum Effort)
Strategic Carbon Management (OxMaint)
Emissions Tracking
Annual spreadsheet exercise. Data gathered from multiple departments weeks before deadline. Errors discovered during verification.
Emissions Tracking
Continuous automated tracking. Real-time dashboard shows emissions vs. allowance balance daily. Zero surprises at year-end.
Allowance Strategy
Buy allowances at year-end to cover deficit. No hedging. Exposed to spot price spikes. No optimization of purchase timing.
Allowance Strategy
Forecast-based procurement. System predicts year-end position monthly and recommends optimal purchase/banking strategy.
Product Mix
Product mix driven by sales demand alone. No visibility into carbon cost per product. CEM I produced regardless of carbon premium.
Product Mix
Carbon cost per product visible in real time. Enables carbon-adjusted pricing, incentivizes lower-carbon blends, and informs sales strategy.
Carbon Cost Impact:
Maximum exposure
Penalties + spot price risk + audit failures
→
Carbon Cost Impact:
20-35% lower carbon costs
Optimized operations + smart procurement + product mix
Implementation Roadmap
Getting compliance-ready doesn't require a multi-year program. A phased approach delivers quick wins while building toward full strategic carbon management. Get your compliance roadmap.
Phase 1
Compliance Foundation
Weeks 1–4
Digitize & Connect: Map all emission sources (fuel, raw material, process). Integrate meter and lab data feeds. Establish monitoring plan in system. Import historical EUA allocation and surrender records.
Deliverable: Digital monitoring plan + automated data capture
Success Metric: 100% emission sources tracked digitally
Phase 2
Dashboard & Reporting
Weeks 5–8
Visualize & Report: Deploy real-time carbon dashboard. Configure allowance balance tracking. Set up automated AER and CBAM report generation. Train compliance team on audit-ready exports.
Deliverable: Live carbon dashboard + automated reports
Success Metric: First CBAM quarterly report generated automatically
Phase 3
Strategic Optimization
Weeks 9–16
Optimize & Forecast: Activate carbon cost per product analytics. Enable allowance procurement forecasting. Integrate with production planning for carbon-optimized scheduling. Model decarbonization scenarios (AF substitution, clinker reduction, CCS readiness).
Deliverable: Strategic carbon management platform
Success Metric: Measurable reduction in carbon cost per ton.
Start your journey
Case Study: European Cement Group — 3 Plant Portfolio
3 Integrated Plants | 4.2 MT Annual Capacity | €12M Annual ETS Exposure
EXECUTIVE CHALLENGE
Group was managing ETS compliance via plant-level spreadsheets with no consolidated view. Verification audits took 6 weeks of staff time annually. No visibility into per-product carbon intensity meant pricing didn't reflect true carbon costs. Allowance purchases were made reactively at year-end, often at peak prices. CBAM transitional reporting added a new quarterly burden with no system support.
SOLUTION IMPLEMENTED
Deployed OxMaint compliance platform across all 3 plants • Integrated SCADA fuel data + lab LIMS + CEMS stack monitoring • Activated real-time carbon dashboards with group-level consolidation • Automated AER generation and CBAM quarterly reports • Enabled per-product carbon costing linked to sales/pricing system
RESULTS (12 MONTHS)
Audit Time
6 Weeks → 3 Days
Verifier-ready audit package auto-generated
Carbon Cost Savings
€3.8M/yr
Optimized allowance purchasing + product mix shift
Clinker Factor
0.80 → 0.72
Carbon-cost visibility drove blended cement push
CBAM Reports
100% On-Time
Quarterly reports generated in <1 hour
"Before, carbon compliance was a fire drill every March. Now, I check our emissions position every morning like a CFO checks the bank balance. The per-product carbon costing changed how our entire sales team thinks about margins. We're not just compliant — we're competitive." — Group Sustainability Director
FAQS
Frequently Asked Questions
What is the EU ETS and how does it affect cement manufacturers?
The EU Emissions Trading System is a cap-and-trade mechanism that puts a price on CO₂ emissions. Cement manufacturers must hold European Union Allowances (EUAs) for every ton of CO₂ they emit. Currently, the industry receives a portion of allowances for free based on production benchmarks, but these free allocations are declining annually and will reach zero by 2034. The gap between free allowances and actual emissions must be covered by purchasing EUAs on the market — at current prices of €65-80/ton and projected prices of €130-180/ton by 2030, this represents a massive and growing cost for cement producers.
What is CBAM and when does it take full effect for cement?
The Carbon Border Adjustment Mechanism (CBAM) is the EU's tool to prevent "carbon leakage" — where production shifts to countries with weaker climate policies. For cement and clinker, CBAM requires importers into the EU to purchase certificates matching the embedded CO₂ emissions of their products at EU ETS prices. The transitional phase (reporting only, no cost) began in October 2023. Financial obligations start in 2026, with CBAM phasing in gradually as free ETS allowances phase out, reaching full implementation by 2034. Cement is one of the first sectors covered because of its high carbon intensity and trade exposure.
How much will carbon compliance cost my cement plant by 2030?
The cost depends on three variables: your plant's specific emissions intensity (t CO₂/t clinker), your production volume, and the EUA market price. For a typical integrated plant producing 1.5 million tons of cement per year with current-average emissions intensity, the carbon cost exposure rises from approximately €5-8M today (with ~90% free allocation) to €15-25M by 2030 (with ~50% free allocation at projected €130-150/ton EUA prices), reaching €30-45M by 2034 at full exposure. Plants with lower clinker factors and higher alternative fuel substitution rates will be at the lower end of this range — making decarbonization investments directly financially justified.
What are the key reporting obligations under EU ETS for cement?
Cement installations must comply with MRV (Monitoring, Reporting, Verification) requirements. This includes maintaining an approved monitoring plan, submitting an Annual Emissions Report (AER) by March 31 each year, and having the report verified by an accredited third-party verifier. Additionally, Activity Level Reports must track production volumes for free allocation adjustments. Under CBAM, quarterly reports on embedded emissions per product type are required from 2024 onward. Non-compliance penalties are €100 per ton of unreported CO₂ plus mandatory allowance surrender — significantly more expensive than simply getting the reporting right.
How does digital tracking help reduce carbon compliance costs?
Digital tracking reduces costs in three ways. First, it eliminates reporting errors and audit failures that result in penalties (€100/ton). Second, real-time emissions visibility enables operational optimization — adjusting clinker factor, fuel mix, and product mix to minimize emissions while maintaining quality. Third, it enables strategic allowance management — forecasting year-end positions months ahead so procurement can be timed to avoid peak prices. Plants using digital carbon management typically achieve 20-35% lower total carbon costs compared to those using manual compliance approaches, through a combination of operational efficiency, smarter procurement, and avoided penalties.
What is the clinker benchmark under EU ETS Phase 4?
The EU ETS clinker benchmark is the emission intensity value used to calculate free allocation. Under Phase 4, the grey clinker benchmark has been tightened to approximately 0.766 t CO₂/t clinker (the exact value is updated periodically based on the top 10% most efficient installations). Plants operating above this benchmark receive fewer free allowances relative to their actual emissions, creating a direct financial incentive to reduce specific emissions. The benchmark is further tightened by annual reduction rates of 0.3-1.6%. Plants that achieve emissions below the benchmark can bank or sell surplus allowances, creating a competitive advantage.
How does CBAM affect cement exports from the EU?
This is a critical concern for EU cement exporters. As free ETS allowances are replaced by CBAM, EU producers face full carbon costs on all production — including volumes exported to non-EU markets where competitors don't face equivalent carbon pricing. The EU has discussed export rebates but has not implemented them. This means EU producers exporting cement or clinker could face a competitive disadvantage in non-EU markets. Strategic responses include focusing on EU and CBAM-covered markets, investing in decarbonization to lower absolute costs, and building a "green cement" brand premium for markets willing to pay for low-carbon products.
Can OxMaint integrate with our existing SCADA and lab systems for emissions tracking?
Yes. OxMaint's compliance module connects to existing plant infrastructure via standard industrial protocols (OPC-UA, Modbus TCP, direct database connections) and supports major SCADA/DCS platforms from Siemens, ABB, Honeywell, and Yokogawa. Lab LIMS integration pulls calorific values, emission factors, and raw material composition data automatically. CEMS (Continuous Emission Monitoring Systems) data feeds directly into compliance calculations. The system layers on top of existing infrastructure — no changes to control logic or operational systems are needed. Implementation typically takes 4-8 weeks from kickoff to live dashboard.
What penalties apply for EU ETS or CBAM non-compliance?
Under EU ETS, failure to surrender sufficient allowances by the April 30 deadline results in a penalty of €100 per ton of CO₂ (adjusted for inflation), and the obligation to surrender the missing allowances is not waived — you still owe them. Reporting failures, late submissions, or materially inaccurate reports can trigger enforcement actions including fines and potential suspension of free allocation. Under CBAM, importers who fail to submit quarterly reports face penalties proportional to the number of CBAM certificates not surrendered, with rates aligned to EU ETS penalties. Repeat non-compliance can result in prohibition from importing covered goods. Digital tracking with automated reporting is the most reliable way to eliminate compliance risk.
What ROI can we expect from implementing digital carbon management?
ROI comes from four sources: avoided penalties (€100/ton for reporting errors), operational carbon reduction (clinker factor and fuel optimization typically save 5-10% of emissions, worth €2-8M/yr depending on plant size), strategic allowance management (timing purchases saves 5-15% on allowance costs), and reduced compliance labor (80%+ reduction in staff time for reporting and audit preparation). For a mid-size cement plant, total annual benefits typically range from €2-5M, with system payback achieved in 3-6 months. As carbon prices rise toward 2030 projections, the ROI only increases.
Request a customized ROI projection for your specific situation.
Prepare Your Plant for the Carbon-Priced Future
EU ETS and CBAM are not temporary regulations — they are the permanent framework for how cement manufacturing will be priced for decades. The plants that act now to digitize emissions tracking, optimize their carbon footprint, and build strategic carbon management capability will have a structural cost advantage over those that treat compliance as an annual paperwork exercise.
Don't wait until free allocations hit zero to discover your true carbon exposure. Take control today with real-time visibility, automated reporting, and AI-powered optimization. Schedule your compliance strategy briefing or start your digital carbon tracking pilot.
Digital Carbon Compliance for Cement
OxMaint integrates with your SCADA, lab, and CEMS systems to deliver automated MRV reporting, real-time carbon dashboards, and strategic allowance management — from a single platform.
Zero
Compliance Penalties
For Plant & Sustainability Directors: Free carbon cost exposure assessment + compliance gap analysis included with briefing