Cement Plant Unified Data: CMMS, Energy, Production and Environment

By Corin Hale on October 12, 2026

cement-plant-unified-data-cmms-energy-production-and-environment

Most cement plants still run data systems built decades apart: a historian for the control room, a CMMS for maintenance, a laboratory system, energy meters feeding a spreadsheet and separate environmental monitoring. Each tells the truth about its own corner, so a mill that draws more power or a filter that loads up is rarely linked to equipment condition in time. This guide shows how to join the four around the asset record. It also covers how Oxmaint ties plant data to maintenance work, and you can book a demo for your systems.

Cement Plant Data Integration

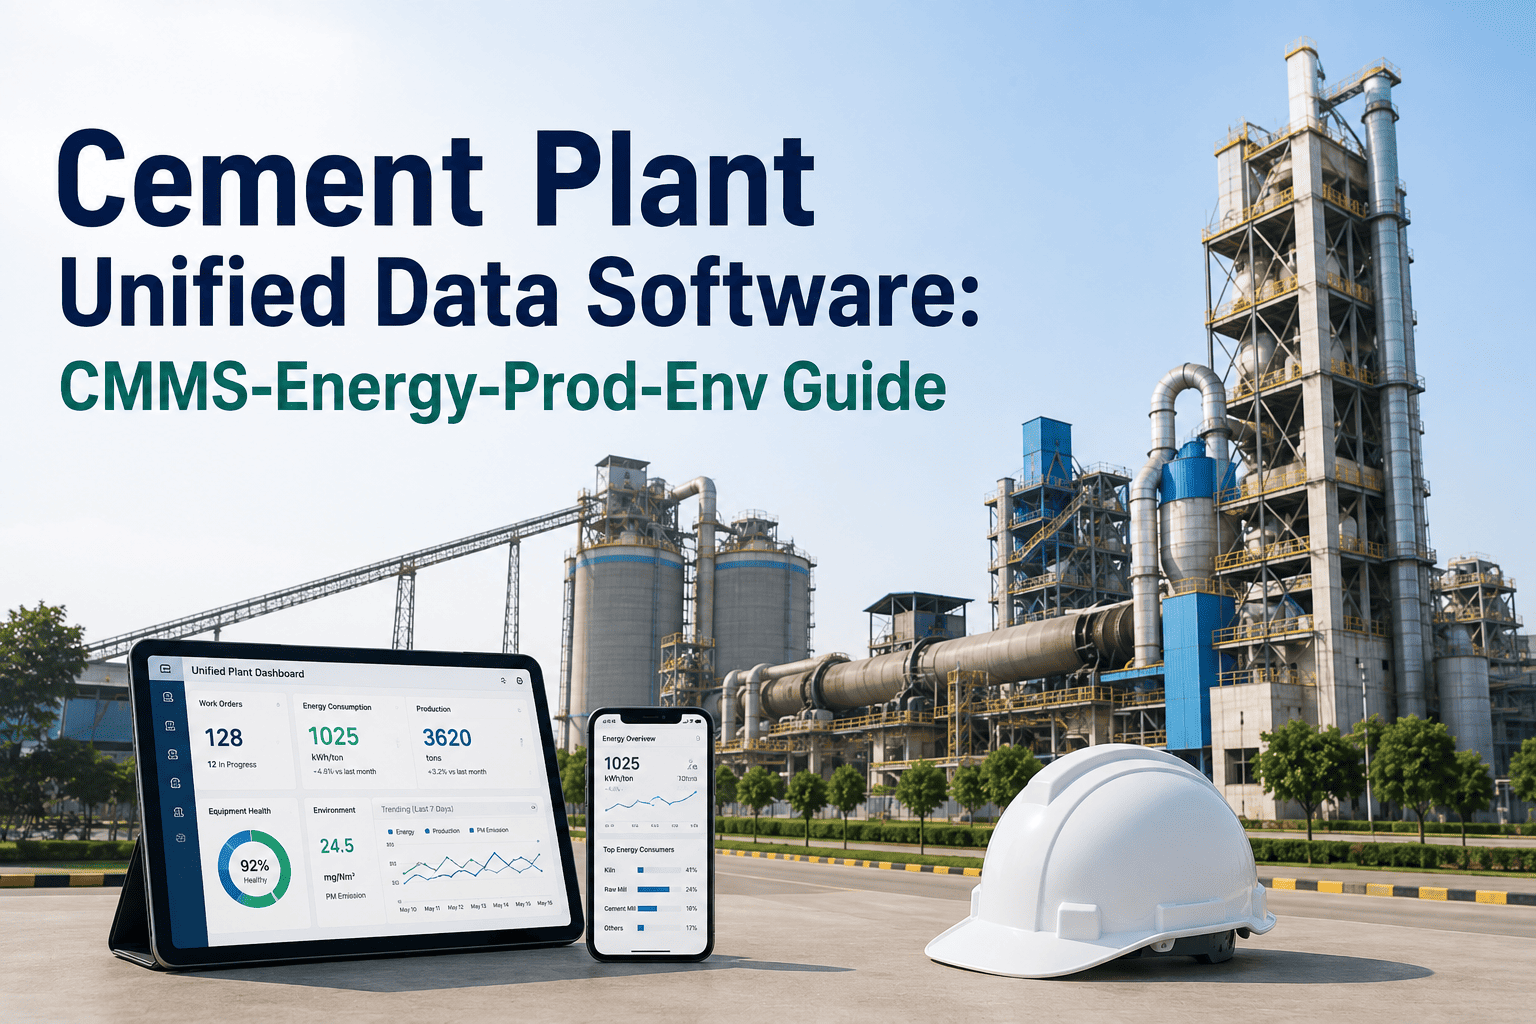
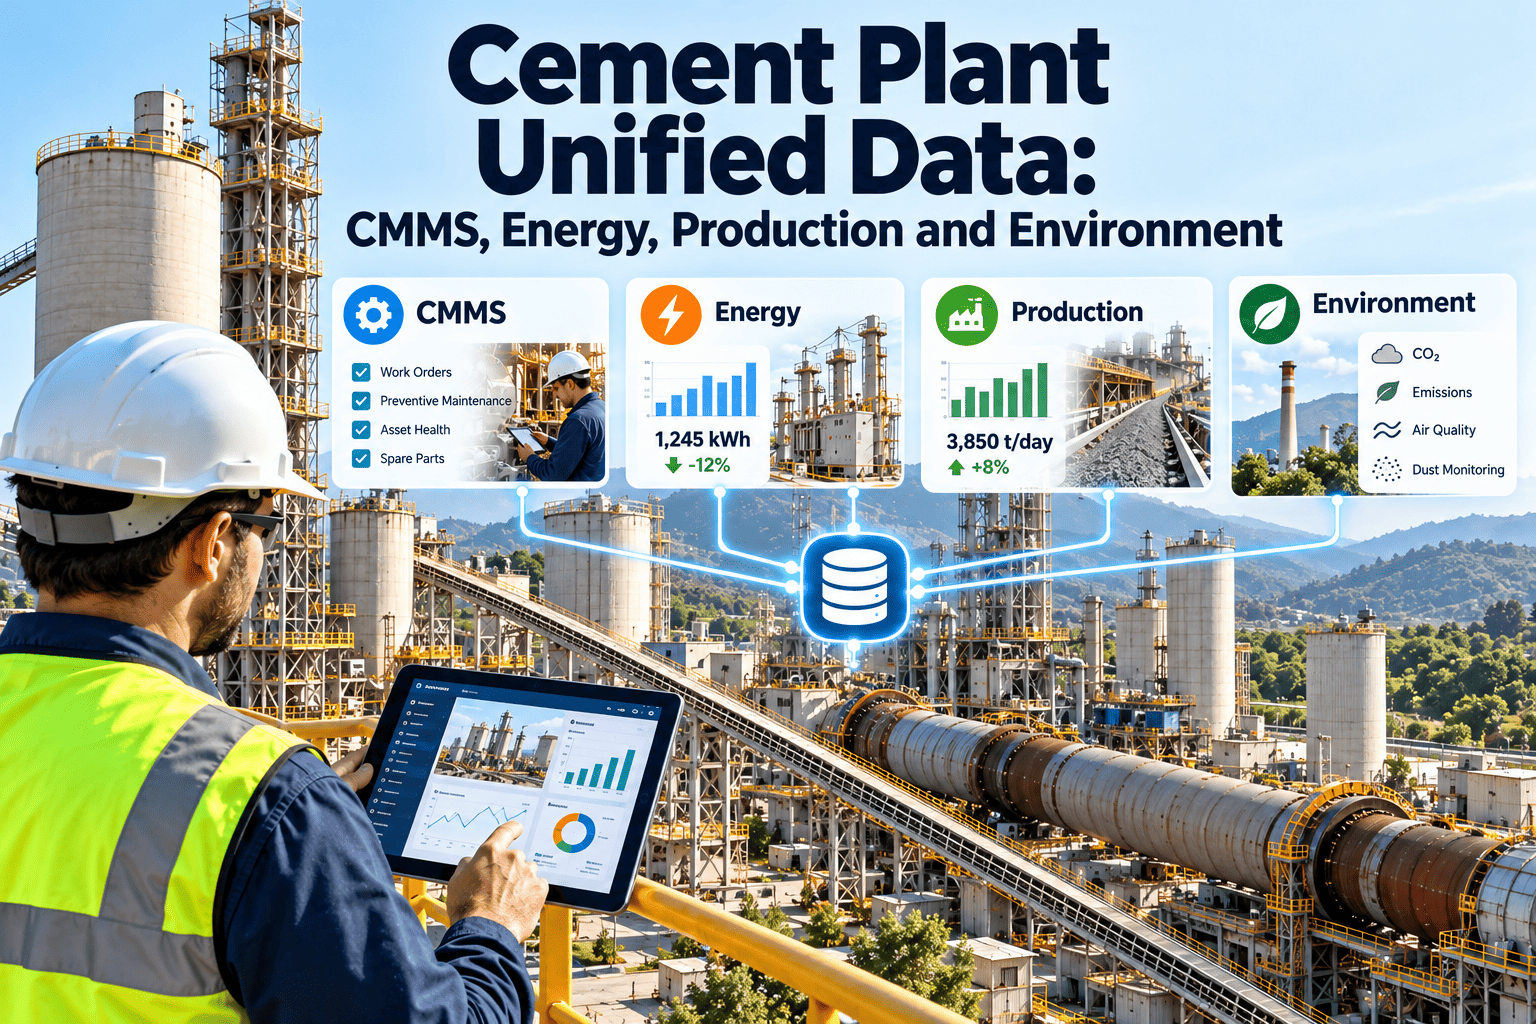
Cement Plant Unified Data: CMMS, Energy, Production and Environment

Stop reconciling four systems by hand. Attach maintenance, energy, production and environmental readings to the same asset record, so one event tells its whole story while there is still time to act.

MaintenanceWork orders, history, PM
EnergykWh per tonne, peak demand
ProductionThroughput, downtime, quality
EnvironmentEmissions, dust, filter pressure
One asset recordTimestamped, correlated, actionable

Why Joined Data Changes Maintenance Decisions

Maintenance teams usually prioritise by breakdown history and gut feel. With energy, production and environmental context on the asset, priority follows measurable consequence instead.

Cost becomes visible

A worn asset that raises energy use or forces slower output has a running cost. Joined data puts that cost beside the repair estimate.

Quality becomes traceable

Drift in fineness or consistency can be checked against equipment condition before anyone blames raw materials or settings.

Compliance becomes preventive

Rising filter pressure or fan load can trigger inspection before an emission limit is threatened.

Four Systems, Four Versions of the Truth

Disconnected systems are not a technology problem alone. They are an ownership problem, and each team optimises what it can see.

SystemUsually owned byWhat it knows wellWhat it cannot see
DCS, SCADA and historianOperations and automationProcess values, alarms, trendsRepair history, parts, who is assigned
CMMSMaintenanceWork orders, PM, spares, failure historyLive energy and process behaviour
Energy meteringEnergy or utilities teamkWh per circuit, peak demandWhich equipment condition drives the change
Quality and production reportingQuality and productionFineness, strength, tonnes producedEquipment health behind a drift
Environmental monitoringEnvironmental or complianceEmission readings, dust, permitsThe maintenance state of the filter, fan or kiln behind a reading

One Event, Four Views

The scenario below is hypothetical. It shows how a slow equipment problem looks to each system separately, and why none of them raises the alarm alone.

Energy view
Specific power on a cement mill circuit creeps up over several weeks. It is treated as normal variation or a power price issue.
Production view
Throughput holds, but fineness variability rises and operators adjust separator settings to compensate.
Maintenance view
Vibration remains under the alarm limit, so no work order is raised. The liners were last inspected months ago.
Environmental view
Dust collection works harder as finer material and more recirculation load the circuit. Filter pressure drifts upward.
Joined view
On one asset record, rising kWh per tonne, fineness drift and filter pressure align with liner age. An inspection is scheduled before the drift becomes a stop.

The Asset Record as the Common Key

Time stamps alone do not join systems. A shared asset identity does. Every reading must resolve to the same equipment and component that maintenance already manages.

Layer 1: SourcesHistorian or DCS through OPC UA, vibration and temperature through IoT gateways, energy meters through Modbus or similar, laboratory results and ERP cost data through interfaces
Layer 2: Asset mappingEach tag mapped to an asset and component in the hierarchy, with units and operating state
Layer 3: CorrelationTrends, baselines and event detection across maintenance, energy, production and environmental signals
Layer 4: ActionWork orders, inspections, dashboards and reports with owners, priorities and closure records

Tag Mapping: The Unglamorous Step That Decides Success

Agree the asset hierarchy first, because it is the join key for everything else
List the critical tags for kiln, cooler, raw mill, cement mill, fans and filters
Record units, scaling and sampling interval for every tag
Tag operating state so running, idle and start-up data are separated
Filter raw alarms so only maintenance-relevant events become actions
Name a data owner for each source who answers when a feed breaks

See One Event Tell Its Whole Story

Connect your maintenance records to energy, production and environmental readings in Oxmaint, and let one asset record show what each separate system misses.
Asset-level correlationExisting systems stay in placeAlerts that raise work orders

Typical Integration Routes

The plant does not need to replace its control, energy or environmental systems. Standard industrial interfaces usually let the maintenance system read from them.

SourceCommon access methodTypical cadence
DCS, SCADA or historianOPC UA or a historian interfaceSeconds to minutes, summarised for maintenance use
Vibration and temperature sensorsIoT gateway or condition monitoring systemMinutes to hours, depending on the asset
Energy metersModbus or an energy management exportMinutes to hourly
Laboratory and qualityInterface or scheduled file transferPer sample or per shift
Environmental monitoringSystem export or interfaceContinuous values, daily summaries
ERP and financeScheduled integrationDaily or monthly

Correlations Worth Building First

Start with pairs that connect a maintenance condition to a cost, quality or compliance consequence. These are the ones that win budget for the next phase.

Specific power per tonne
paired with
Mill vibration and liner age
Reveals wear that raises grinding energy before an alarm trips
Fineness variability
paired with
Separator and fan condition
Shows whether quality drift is a process issue or an equipment issue
Filter differential pressure
paired with
Bag condition and cleaning system records
Links emission risk to maintenance history of the dust collector
Kiln fuel per tonne of clinker
paired with
Cooler and fan condition
Connects heat recovery losses to grate, fan and hydraulic issues
Production rate dips
paired with
Work order and downtime codes
Separates mechanical causes from process causes in downtime reports

Environmental Records Belong Next to Maintenance

Emission and dust performance depend on filters, fans, seals and kiln operation. When compliance evidence sits apart from maintenance records, answering an auditor or a regulator takes days.

Evidence to keep with the asset

Inspection and calibration records for monitoring equipment
Bag replacement and cleaning system work orders
Fan and damper service history for dust collection
Corrective actions after an exceedance or near miss

Questions it helps answer

What changed on this equipment before the reading moved
When was the filter last inspected and by whom
Which corrective action closed the issue
Is the same asset repeating the same problem

KPIs That Only Exist When Data Is Joined

Energy per tonne by asset conditionWhich worn assets cost power
Maintenance cost per tonneSpend divided by output, by area
Downtime hours by causeMechanical, process and external
Environmental events by assetExceedances traced to equipment
Planned work shareScheduled versus reactive effort
Data coverageCritical assets with live signals

Before and After Unification

Separate systems

Weekly meeting spent reconciling spreadsheets
Energy spikes explained after the month closes
Environmental events investigated from scratch
Downtime causes argued between teams

One asset record

Meetings start from a shared dashboard
Energy drift linked to asset condition early
Environmental events traced to equipment history
Downtime causes coded and trusted

Where kWh per Tonne Hides Maintenance Problems

Electrical energy per tonne of cement is commonly cited at roughly 90 to 110 kWh for modern dry-process plants, with grinding and large fans taking a major share. Small mechanical losses therefore carry real cost.

Asset conditionEnergy effectMaintenance signal to join
Worn mill liners or ball charge out of balanceMore power per tonne groundMill vibration, liner age, inspection findings
Fouled or eroded fan impellersHigher current for the same airflowFan current, vibration, cleaning records
Misaligned or poorly lubricated drivesExtra friction losses and heatBearing temperature, alignment checks, lubrication tasks
Compressed air and false air leaksCompressor load or fan load risesLeak survey work orders, damper and seal records
Degraded cooler efficiencyMore kiln fuel for the same outputSecondary air temperature, grate and fan condition

Production Data: Downtime Codes That Hold Up

Production reports are only useful for maintenance when downtime reasons are coded consistently. A short list of causes, used by every shift, beats a long list nobody follows.

Keep codes simple

Mechanical, electrical, instrumentation, process and external
Planned stop versus unplanned stop
Equipment and component linked to the event
Work order number attached to every repair

Use them for decisions

Rank assets by hours lost, not by complaints
Separate process stops from mechanical ones
Test whether PM changes reduce repeat stops
Report cost per tonne by area with confidence

Dashboards by Audience

AudienceNeeds to seeDecision it supports
OperatorOpen alerts and work orders on the equipment they runWhether to adjust the process or call maintenance
Maintenance supervisorToday's work, overdue PMs and critical asset flagsCrew assignment and daily priorities
Reliability engineerTrends, repeat failures and correlationsCondition rules and root cause actions
Plant managerMaintenance cost per tonne, planned share, energy and downtimeBudget, shutdown scope and investment
Environmental officerMonitoring status, filter condition and open corrective actionsCompliance readiness and follow-up

Pitfalls That Undermine Integration Projects

Common mistakes

Importing thousands of tags that map to no asset
Building dashboards before agreeing who acts on them
Forwarding every raw alarm into the CMMS
Treating integration as a one-off IT task

Better habits

Map a short critical tag list to real assets first
Name an owner and response for each alert type
Filter events and require corroborating signals
Review feeds and mappings every quarter

A Phased Path That Avoids a Big-Bang Project

Phase 1
Foundation. Clean the asset hierarchy, criticality and failure codes in the CMMS, and list the tags that matter.
Phase 2
Process and energy. Connect historian and energy feeds for kiln, mills and fans, and baseline normal behaviour.
Phase 3
Quality and environment. Add laboratory and environmental data, and build the first correlation dashboards.
Phase 4
Action. Turn the strongest correlations into alerts and condition-based work orders with named owners.

What Good Looks Like After Six Months

A joined-up plant does not need every signal connected. It needs the right signals trusted and acted on, with visible ownership.

Critical assets mappedKiln, cooler, mills, large fans and main filters carry live signals
Alerts with ownersEvery alert type has a responder and closure code
Shared weekly reviewMaintenance, operations, energy and environment use one dashboard
Downtime causes trustedCodes are used consistently across shifts
Audit retrieval in minutesInspection and corrective action history is on the asset
Expansion list agreedNext assets and data sources are chosen by value

Questions to Ask Before Choosing a Platform

Does it read from our existing historian, meters and monitoring systems?
Can every reading attach to the same asset record maintenance uses?
Can alerts create work orders with context, owner and priority?
Are role-based views available for operators, planners and managers?
Can contractors see only the assets and jobs in their scope?
Can we start with one area and expand without rework?

Who Owns the Joined Data

RoleResponsibility
Reliability managerAsset hierarchy, criticality, failure codes and correlation rules
Automation or OT leadSource connections, tag lists and feed health
Energy managerMeter mapping, specific energy targets and review
Quality managerLaboratory data mapping and quality drift thresholds
Environmental officerMonitoring records, permit evidence and exceedance follow-up
Plant managerGovernance, priorities and cross-team accountability

Access, Security and Governance

Connecting operational and maintenance data raises fair questions about control and exposure. Good governance answers them before go-live.


Read-only by default

Start with read access from control and monitoring systems so maintenance sees data without any ability to change process values.

Role-based visibility

Operators, planners, contractors and managers see what their job needs, and contractors are limited to their assigned scope.

Change control

Tag mappings, thresholds and alert rules are changed by named owners and logged, so reviews can see why a rule exists.

Data Quality Rules for Joined Systems

One asset ID across every system, never two names for one machine
Shared time base so events line up across feeds
Missing data flagged visibly instead of silently filled
Baselines reset after planned repairs and recorded
Access rights set by role, so contractors see only their scope
Quarterly review of unmapped tags and stale feeds

Frequently Asked Questions

Do we need to replace our SCADA or energy meters?
No. Existing systems stay in place, and the CMMS reads from them through standard interfaces.
Where should a plant start?
With a clean asset hierarchy and a short list of critical tags. Start free and build from there.
Which correlation pays back first?
Specific power per tonne against mill and fan condition is often the clearest early link.
Can environmental data live in the CMMS?
Monitoring evidence and corrective actions can be linked to assets. Book a demo to see how.
How do we avoid alert overload?
Filter raw alarms, require corroborating signals and give every alert an owner and a closure code.

Bring Your Plant Data Under One Asset Record

Start with the kiln line and the mills, connect the signals that matter, and let maintenance see energy, production and environmental context on every asset.
Phased integrationCross-team dashboardsAudit-ready records

Share This Story, Choose Your Platform!