A cement plant's grinding circuit is where raw material cost, energy consumption, and product quality converge — and where maintenance decisions have the most direct impact on operating economics. Yet in most plants, the data needed to connect maintenance activity to production outcomes lives in separate systems: downtime events in one spreadsheet, energy readings from the DCS historian, quality results in the lab LIMS, and maintenance records in a paper-based PM system. OxMaint's maintenance analytics module connects mill, separator, and conveyor maintenance data to downtime, energy, and throughput KPIs — giving maintenance and production teams a single shared view of how equipment health drives plant performance. Start a free trial or book a demo to see the analytics dashboard live.
Analytics & Reporting — Cement Mill Maintenance
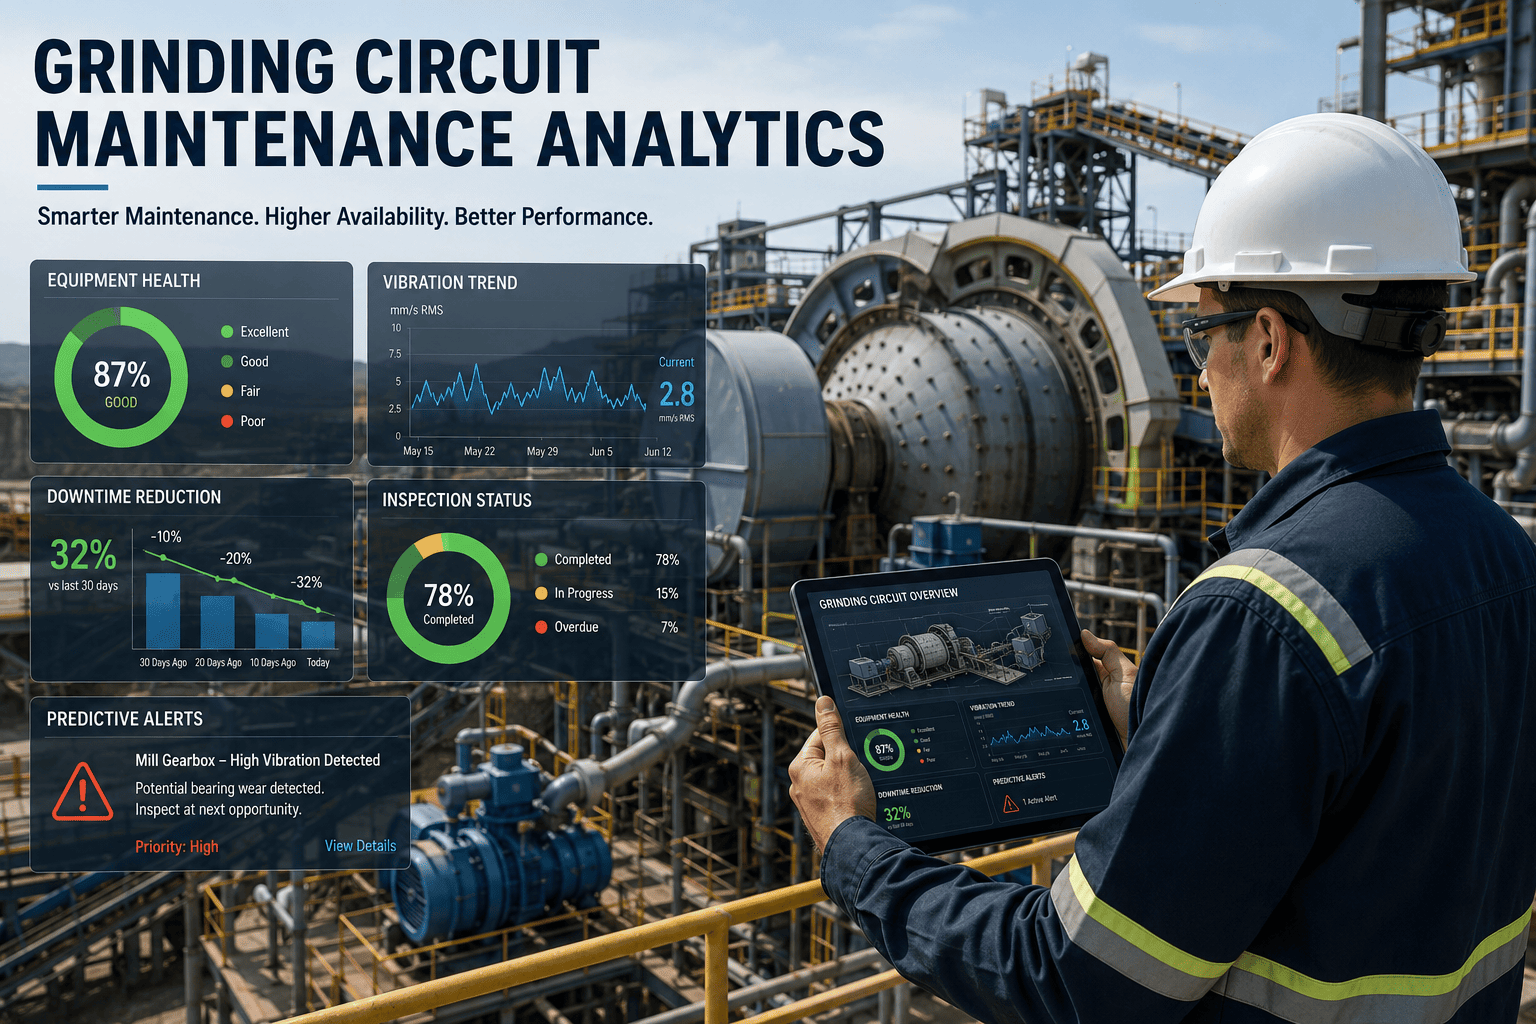
Grinding Circuit Maintenance Analytics
Connect mill, separator, and conveyor maintenance events to downtime, energy, and throughput data. Turn your maintenance records into production insights with OxMaint.
OEE
Overall Equipment Effectiveness, tracked per mill
kWh/t
Specific energy consumption, linked to maintenance events
MTBF
Mean time between failures, trended monthly
t/hr
Throughput per hour, correlated to equipment condition
The Analytics Gap in Grinding Circuit Maintenance
Maintenance teams in cement plants collect a significant amount of data — work order histories, inspection records, spare parts usage logs — but rarely convert that data into operational insight. Production teams track energy and throughput but rarely connect drops in performance to specific maintenance events. The result is a persistent gap: the same failure modes recur, the same assets are worked around rather than fixed, and management decisions about capital investment are based on anecdote rather than evidence. OxMaint closes this gap by bringing maintenance and production data into a shared analytics layer.
What Gets Lost Between Maintenance Data and Production Insight
Maintenance Data (Collected but unused)
Work order history per asset
Downtime event logs with cause codes
Inspection findings and condition scores
Spare parts consumption per component
Vibration and temperature readings
Production Data (Tracked but disconnected)
Mill throughput (t/hr) from DCS
Specific energy consumption (kWh/t)
Cement Blaine and residue from lab
Circuit availability percentage
OEE by shift and month
OxMaint analytics connects both sides — so every maintenance event is visible against its production context.
Analytics Capabilities in OxMaint
OxMaint analytics are built for maintenance engineers and plant managers who need decisions, not dashboards. Every report in OxMaint answers a real question that recurs in every cement plant planning meeting.
01
Downtime Analysis by Asset and Cause
Total unplanned downtime per grinding circuit asset — mill, separator, classifier, bucket elevator — broken down by failure cause, component, and shift. Identifies the 20% of failure modes causing 80% of production losses.
02
Energy Consumption vs. Maintenance Correlation
Tracks specific energy consumption (kWh/t) trends against mill liner wear, separator efficiency, and gearbox condition history. Reveals the energy cost of deferred maintenance — a number that usually surprises management.
03
PM Compliance and Completion Rate
Tracks the percentage of scheduled preventive maintenance tasks completed on time, by area, by team, and by asset type. The single most leading indicator of future unplanned downtime available in any CMMS.
04
MTBF and MTTR Trending
Rolling 12-month mean time between failures and mean time to repair per critical grinding circuit asset. Month-on-month MTBF improvement is the clearest measure of whether a maintenance program is working.
05
Spare Parts Spend and Consumption Analysis
Links spare parts cost to specific assets and failure events. Shows which components are consuming the most maintenance budget and whether that spend is on planned replacements or emergency repairs.
06
OEE Dashboard per Mill
Overall Equipment Effectiveness broken down into availability, performance, and quality rates per mill. Availability losses are mapped directly to maintenance work order history — making the root cause of OEE gaps immediately visible.
Turn Maintenance Records into Production Decisions
OxMaint analytics give cement plant maintenance and production teams the shared data layer they need to make evidence-based decisions — about maintenance intervals, capital investment, and production planning.
Frequently Asked Questions
Does OxMaint integrate with DCS or process historians for production data?
OxMaint integrates with plant process historians via OPC-UA and REST API, enabling maintenance event data to be viewed alongside DCS production readings. The OxMaint team supports integration scoping.
Book a demo to discuss your plant's data landscape.
What analytics reports are available out of the box?
OxMaint includes standard reports for downtime analysis, PM compliance, MTBF/MTTR trending, spare parts spend, and work order cycle time. Custom reports can be built using OxMaint's reporting builder with filter and grouping controls.
Can OxMaint analytics be accessed by production managers, not just maintenance teams?
Yes. OxMaint supports role-based access with read-only dashboards for production, engineering, and management stakeholders. Teams see the data relevant to their role without access to maintenance work order management functions.
How much historical data does OxMaint retain for trend analysis?
OxMaint retains all work order, inspection, and asset history indefinitely. Trend analysis reports can be configured for any date range — from 30-day sprint reviews to multi-year reliability benchmarking.
Start your free trial to explore the reporting tools.
Your Grinding Circuit Data Deserves Better Than a Spreadsheet
OxMaint connects cement mill maintenance records to the production and energy KPIs that drive plant economics. Stop managing in the dark. Build a maintenance analytics program that gives every decision a data foundation.