IoT Data Analytics Dashboard for Cement Plant Operations
By John Snow on February 20, 2026
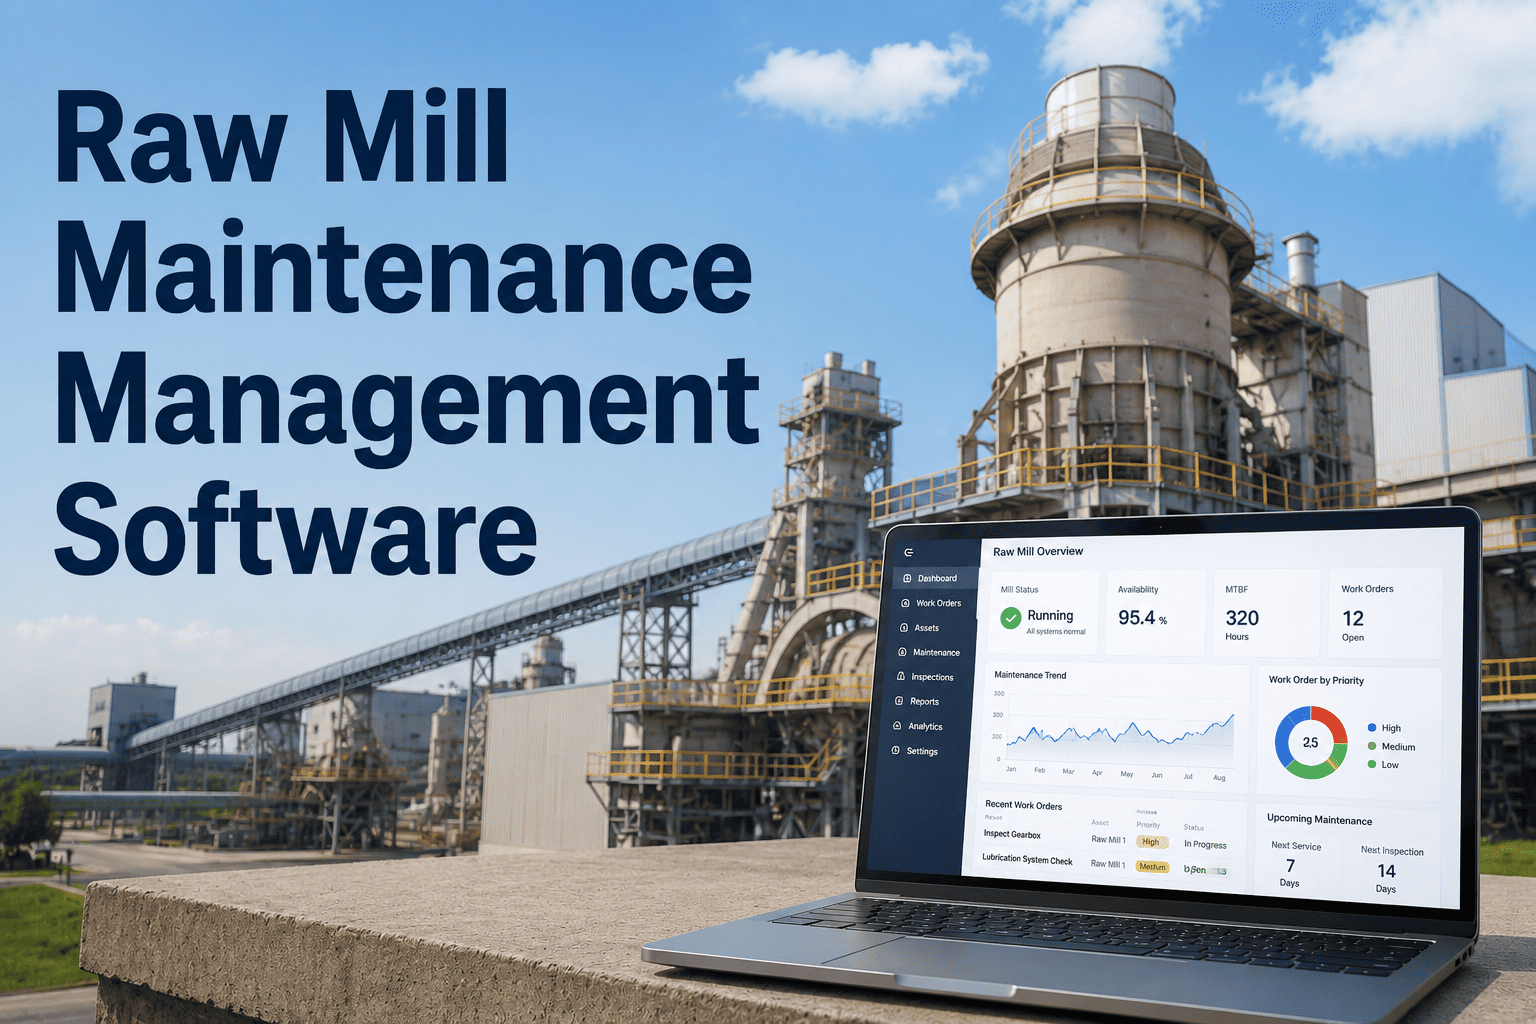
A cement plant in Vietnam reduced unplanned downtime by 34% after implementing IoT analytics dashboards that transformed 2.3 million daily sensor readings into actionable maintenance insights. Before the dashboard deployment, operators navigated between 14 different monitoring screens to assess plant health—now they access a unified view showing equipment status, trend anomalies, and predictive alerts on a single screen. Raw sensor data alone doesn't prevent failures; the value emerges when analytics convert millions of data points into decisions about what needs attention today, what's trending toward problems next week, and which equipment can safely run until the next scheduled outage. Sign up for Oxmaint to deploy analytics dashboards that transform your IoT data into maintenance intelligence.
Plant Operations Dashboard
Real-time KPIs from integrated IoT sensor networks
94.7%
Overall Equipment Effectiveness
+2.3%
847
Active Sensors Online
99.8% uptime
12
Active Alerts Today
-8 vs yesterday
4,280
TPD Clinker Production
+3.1%
23
Days to Next Outage
On schedule
Visualization Types for Cement Plant Data
Different data types require different visualization approaches. Oxmaint dashboards include purpose-built chart types optimized for cement plant monitoring scenarios.
Trend Line Charts
Track parameter changes over time with historical comparison overlays. Identify gradual degradation patterns invisible in point-in-time readings.
Temperature TrendsVibration History
Bar & Column Charts
Compare values across equipment, shifts, or time periods. Identify outliers and performance variations at a glance.
Equipment ComparisonShift Analysis
Gauge & Dial Displays
Show current values against operating ranges with instant visual status. Color-coded zones indicate normal, warning, and critical states.
Real-Time ValuesThreshold Status
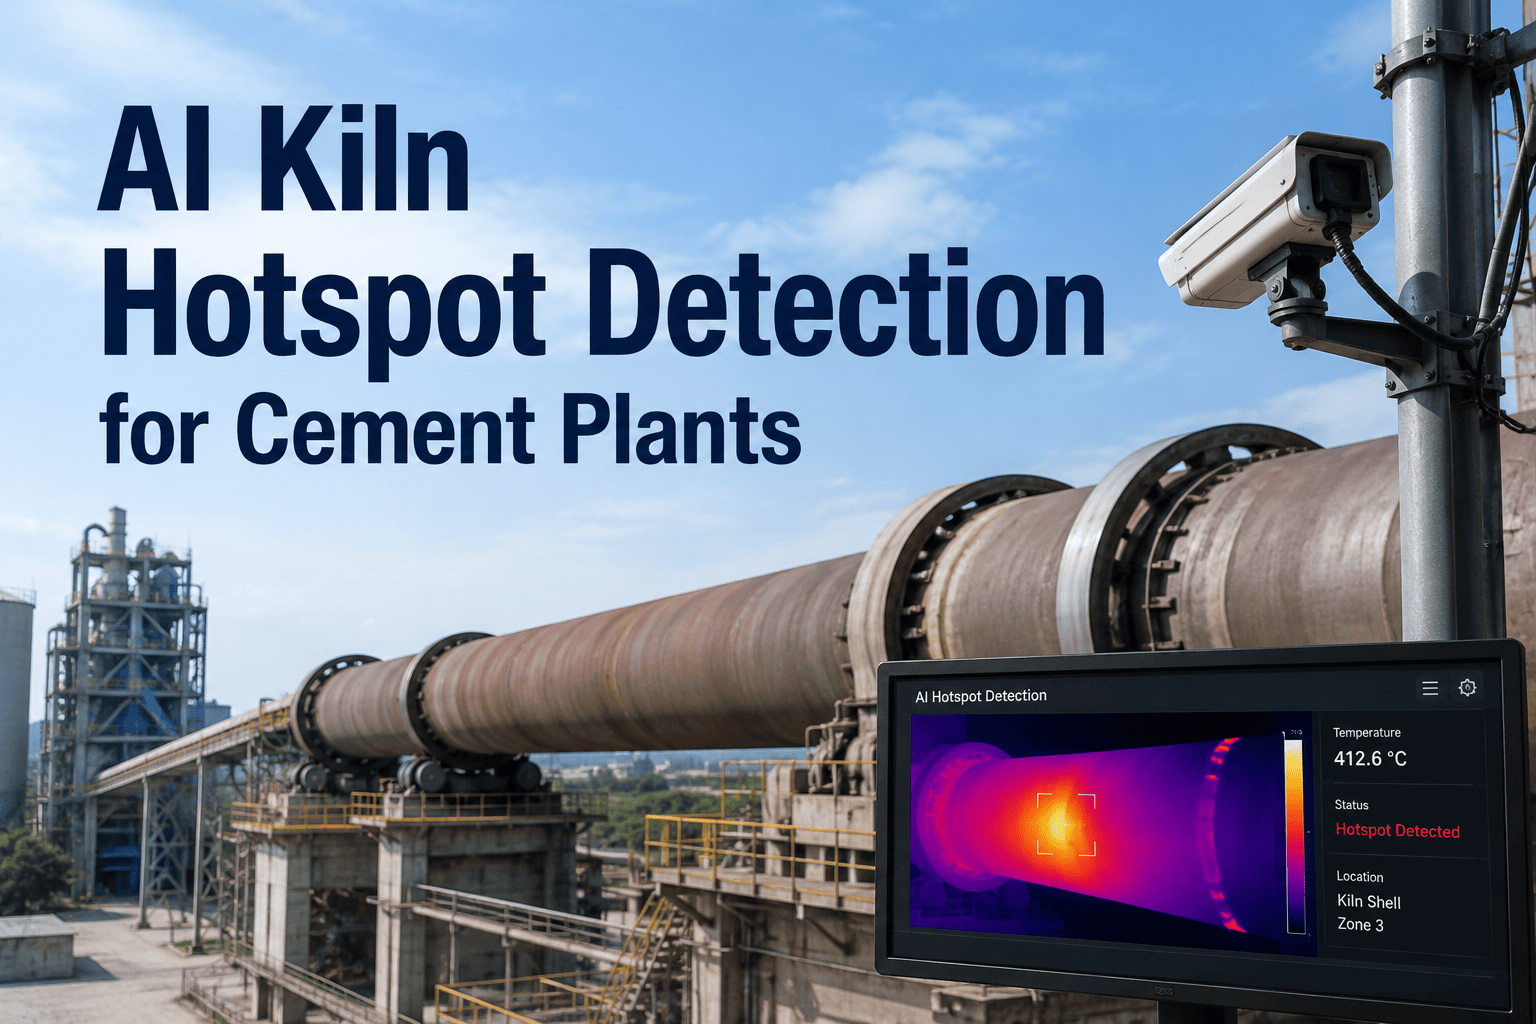
Heat Maps
Visualize multi-dimensional data across equipment zones or time periods. Quickly identify hot spots and problem areas.
Kiln Shell TempsAlert Frequency
Scatter Plots
Correlate multiple parameters to identify relationships between variables. Discover hidden patterns affecting equipment performance.
Correlation AnalysisAnomaly Detection
Progress Bars
Track completion status, capacity utilization, and remaining life indicators. Visualize progress toward targets and thresholds.
Wear IndicatorsCapacity Usage
Real-Time Equipment Monitoring
Live Data Feed
Kiln Shell Zone 3
287°C
Shell Temperature
Min: 265°CMax: 310°C
Raw Mill Bearing
4.2 mm/s
Vibration Velocity
Baseline: 2.8Alert: 4.5
Clinker Cooler
1,180°C
Inlet Temperature
Target: 1,200°C±50°C
Cement Mill
142 kWh/t
Specific Energy
Target: 140Best: 135
Transform sensor data into visual intelligence. Oxmaint dashboards consolidate data from hundreds of sensors into intuitive displays that highlight what needs attention—reducing the time from data to decision.
Oxmaint dashboards aggregate data from all plant monitoring systems into unified views. Book a demo to discuss integration with your existing sensor infrastructure.
Temperature Sensors
Shell scanners, pyrometers, RTDs, and thermocouples monitoring kiln, preheater, cooler, and mill temperatures.
Shell TempsGas TempsBearing Temps
Vibration Sensors
Accelerometers and velocity sensors on rotating equipment including mills, fans, gearboxes, and motor bearings.
VelocityAccelerationFFT Spectra
Process Sensors
Flow meters, pressure transmitters, level sensors, and analyzers monitoring production parameters throughout the plant.
Flow RatesPressuresLevels
DCS/SCADA Systems
Integration with existing control systems to capture process variables, setpoints, and operator actions for context.
Control LoopsSetpointsAlarms
Power Monitoring
Electrical meters and analyzers tracking energy consumption, power factor, and motor performance across equipment.
kWh UsageCurrent DrawPower Factor
Environmental Sensors
Emissions monitors, dust sensors, and ambient condition sensors for compliance and operational context.
EmissionsDust LevelsAmbient Temp
Predictive Insights from Analytics
Anomaly Detection
AI identifies deviations from normal patterns before they trigger threshold alerts
Trend Forecasting
Predict when parameters will reach warning thresholds based on degradation rates
Health Scoring
Composite equipment health scores combining multiple sensor inputs into single indicators
Maintenance Planning
Recommended maintenance windows based on predicted failure timelines and production schedules
Reporting and Export Features
Dashboards deliver real-time visibility; reports document performance for stakeholders and compliance. Sign up for Oxmaint to access automated reporting capabilities.
Scheduled Reports
Automated daily, weekly, and monthly reports delivered via email with KPI summaries, alert histories, and trend analysis.
PDF ExportEmail DeliveryCustom Schedules
Ad-Hoc Analysis
On-demand data exports with custom date ranges, equipment selections, and parameter filtering for detailed analysis.
Excel ExportCSV DownloadAPI Access
Performance Benchmarking
Compare equipment performance across lines, shifts, and time periods to identify improvement opportunities.
Equipment ComparisonPeriod Analysis
Compliance Documentation
Audit-ready reports documenting monitoring activities, alert responses, and maintenance actions for regulatory compliance.
Audit TrailCompliance Logs
Frequently Asked Questions
How quickly does data appear on dashboards after sensors collect it?
Real-time dashboards update within 1-5 seconds of sensor data collection, depending on communication infrastructure. For most cement plant applications, this near-real-time visibility is sufficient for operational decisions. Historical trending and analytics update on configurable intervals, typically every minute for detailed analysis.
Can we customize dashboard layouts for different user roles?
Yes. Oxmaint supports role-based dashboard configurations. Operators see real-time equipment status and alerts. Maintenance teams see work order queues and equipment health trends. Management sees KPIs and performance summaries. Each user role can have customized views showing the information most relevant to their responsibilities. Book a demo to see role-based dashboard examples.
How much historical data is available for trend analysis?
Oxmaint retains full-resolution sensor data for 90 days and aggregated data (hourly and daily averages) indefinitely. This allows detailed analysis of recent events while maintaining long-term trending for seasonal patterns, campaign comparisons, and year-over-year performance tracking.
What predictive analytics capabilities are included?
Oxmaint includes anomaly detection algorithms that identify deviations from normal operating patterns, trend forecasting that predicts when parameters will reach warning thresholds, and equipment health scoring that combines multiple sensor inputs into composite indicators. Sign up for Oxmaint to explore predictive analytics features.
See Your Plant Data Like Never Before
Transform millions of sensor readings into visual intelligence that drives better maintenance decisions. Oxmaint dashboards give operators, maintenance teams, and management the insights they need—when they need them.