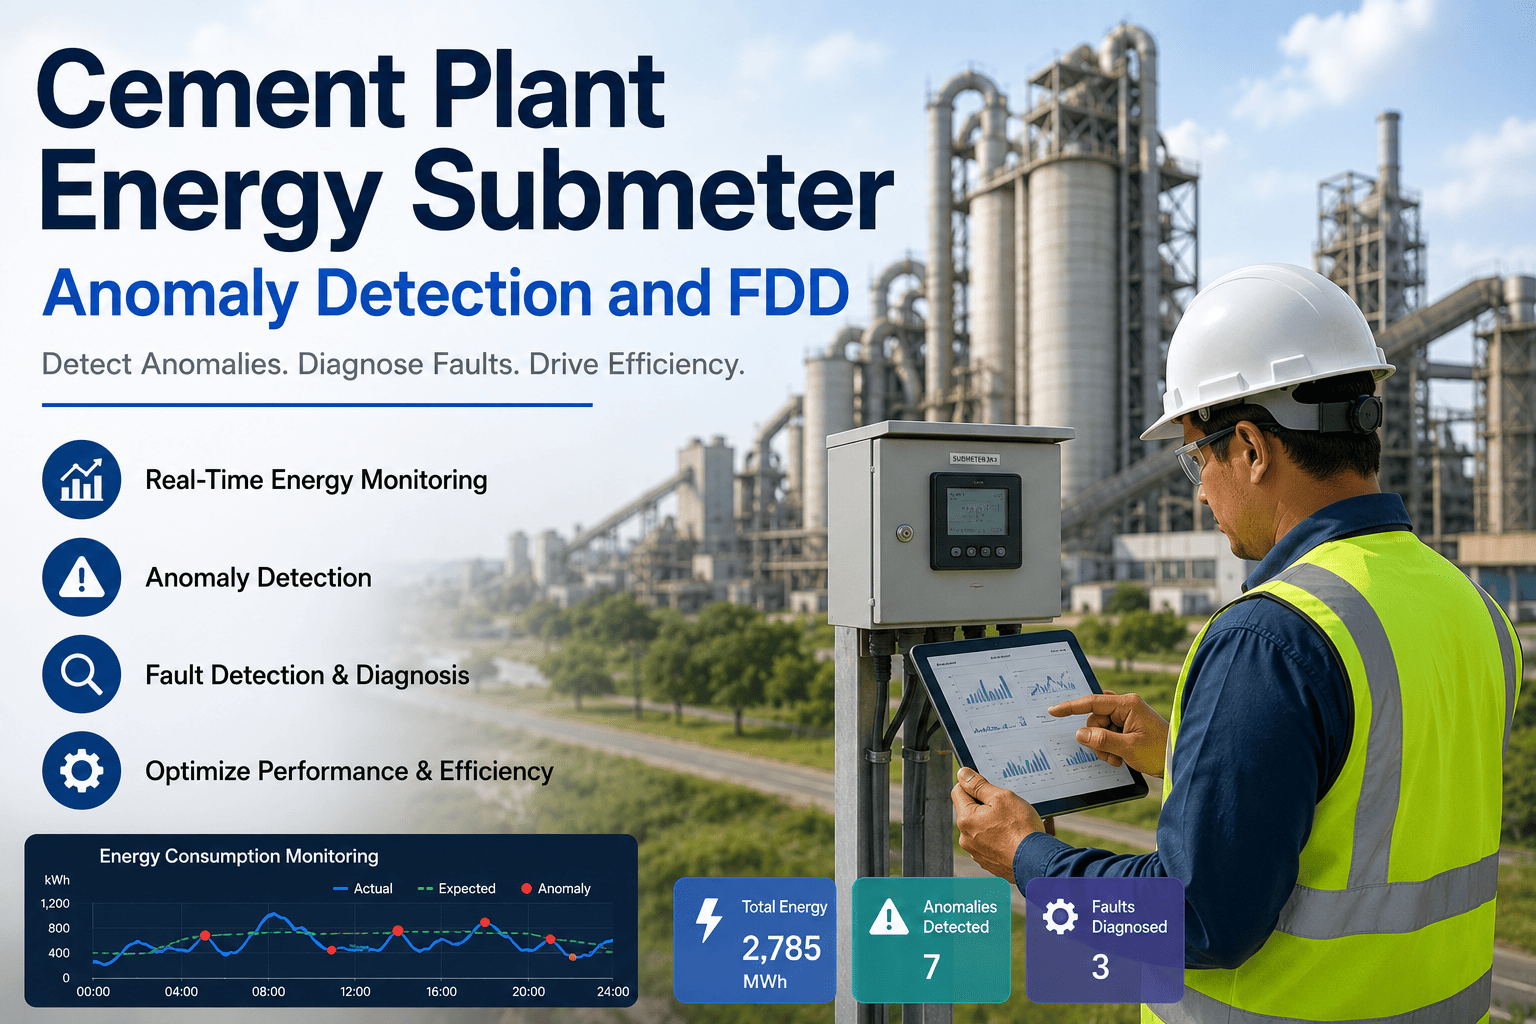
A cement plant that consumes 90 to 130 kWh per tonne of clinker will typically have three to five hidden energy anomalies running at any given moment — none of which appear on a monthly utility bill until thousands of kilowatt-hours have been wasted. Submetering, combined with baseline drift detection and fault detection and diagnostics, changes that dynamic entirely. When energy consumption at the circuit level is measured continuously, deviations from baseline are visible within hours rather than weeks. A kiln drive running 8 percent above its normal kWh-per-tonne profile, a raw mill separator consuming current outside its load band, or a compressed air compressor whose specific power has crept upward by 12 percent — all of these are detectable anomalies that translate directly to corrective work orders in a CMMS before they become equipment failures. Oxmaint integrates with energy submeters to route anomaly alerts to maintenance teams automatically, closing the gap between energy data and maintenance action. Connect your submeters to Oxmaint for free and start detecting baseline drift from day one.
14%
Average energy waste reduction with continuous submeter anomaly detection
43%
Of industrial circuits operate sub-optimally due to undetected faults
Hours
Time to detect an anomaly with continuous monitoring vs weeks with manual review
3–5
Active energy anomalies running in a typical cement plant at any given time
Why Submetering Changes the Energy Management Game
Monthly electricity bills tell a plant whether total consumption went up or down — they do not tell maintenance teams where, why, or which specific asset caused it. A plant operating with only utility-level metering is navigating without instruments. Submeters installed at the circuit, department, or asset level break total consumption into actionable segments. When kiln line 1 consumes more energy per tonne than kiln line 2 running identical clinker chemistry, something is wrong on line 1 — and submeter data identifies which circuit it is. Fault Detection and Diagnostics builds on that foundation by applying rule-based and statistical analysis to detect when readings diverge from their expected range.
Energy increases discovered on monthly invoice — 4 weeks after the fault started
No way to isolate which circuit, machine, or department caused the increase
Baseline drift from equipment wear goes undetected for months
Maintenance team investigates after complaints, not on data signals
ROI on maintenance actions cannot be measured in energy terms
Anomaly detected within hours of deviation from baseline — automatic CMMS alert triggered
Fault isolated to specific circuit, drive, or pump — technician dispatched with context
Baseline drift tracked by trend — gradual equipment wear visible before failure
Maintenance team acts on data, not complaints — planned repairs instead of emergency callouts
Energy savings from each repair quantified in kWh — ROI visible and reportable
Built for Energy-Intensive Plants
Route Energy Anomalies Directly to Your Maintenance Team
Oxmaint connects submeter data to CMMS work orders — so when a kWh anomaly is detected, a corrective action is automatically assigned to the right technician with asset context, not just a number on a dashboard.
Key Circuits to Submeter in a Cement Plant
Not every circuit justifies a submeter. The highest-value installations target circuits with the greatest energy consumption variability, the highest failure consequence, or the clearest correlation between kWh drift and equipment condition. The table below identifies the priority circuits and the FDD trigger logic appropriate to each.
| Circuit |
Why Submeter It |
FDD Trigger Threshold |
Typical Anomaly Cause |
CMMS Action |
| Kiln Main Drive |
Single largest consumer — 18 to 22% of total plant kWh |
Greater than 5% drift from kWh-per-tonne baseline over 48 hours |
Tyre and roller wear, kiln misalignment, shell ovality |
Geometric inspection work order auto-created |
| Raw Mill Main Motor |
Second largest consumer — sensitive to grinding media wear |
kWh per tonne of raw meal above upper control limit for shift |
Media wear, table liner wear, dam ring height |
Mill internals inspection scheduled on next planned stop |
| Cement Mill Drive |
Fineness vs energy ratio shifts with wear — detectable early |
Blaine-normalised kWh above baseline by 8% |
Ball charge depletion, diaphragm blockage, liner wear |
Ball charge and liner inspection work order created |
| Compressed Air Compressors |
Specific power (kW/CFM) rises with valve wear and leaks |
Specific power above 5% of commissioning baseline |
Valve wear, increased leakage rate, inter-cooler fouling |
Compressor valve inspection and leak audit triggered |
| Clinker Cooler Fans |
Fan amp draw increases with blade fouling or airflow restriction |
Amp draw above 7% of normal at same throughput |
Blade buildup, inlet restriction, cooler grate blockage |
Fan blade and grate inspection work order raised |
| Bag Filter Fan Motors |
Static pressure rise from blinded bags visible in fan power |
Motor amps above pressure-corrected baseline by 10% |
Bag blinding, pulse jet solenoid failure, casing leaks |
Bag inspection and pulse jet check scheduled |
Building the FDD Baseline: The Right Way
A fault detection system is only as good as its baseline. A poorly constructed baseline generates constant false alarms that maintenance teams learn to ignore — which is worse than having no system at all. Building a reliable baseline requires a minimum of 30 to 60 days of clean operating data, normalised for production rate and raw material variability. The baseline should then be reviewed quarterly to account for planned equipment changes such as mill relining or media top-up, which legitimately shift the energy signature.
1
Data Collection Phase — 30 to 60 Days
Record kWh per unit of production (tonne of clinker, tonne of raw meal, tonne of cement) at each submetered circuit during normal, stable operation. Exclude data from start-ups, stoppages, and known abnormal events.
2
Normalisation and Segmentation
Split the baseline by production rate band — most circuits have different energy signatures at 80 percent load versus 100 percent. A single flat baseline across all load conditions generates false positives at every load shift.
3
Control Limit Setting
Set upper and lower control limits at two to three standard deviations from the mean for each load band. Breaching the upper limit triggers an anomaly alert. Sustained readings above the midpoint — drift — trigger a trend review, not an immediate alert.
4
CMMS Integration — Alert to Work Order
Configure anomaly alerts to auto-create CMMS work orders with asset reference, alert timestamp, and energy deviation value. Technicians receive an actionable work order — not a raw number — with context about what the deviation suggests.
5
Quarterly Baseline Review and Savings Measurement
After each maintenance intervention, measure post-repair kWh consumption and compare to pre-fault baseline. Document the kWh savings in the CMMS work order. This produces the energy ROI evidence required for management reporting and ISO 50001 compliance.
What Anomaly Detection Saves — By the Numbers
Kiln Drive Anomaly
8% drift
On a 2,000 kW kiln drive running 8,000 hours per year, an 8% anomaly represents 1,280,000 kWh annually — over ₹80 lakh at ₹6.50/kWh. Detecting it within 48 hours limits waste to under 100,000 kWh.
Compressor Specific Power
12% drift
A compressor fleet consuming 1.5 MW with 12% specific power drift wastes 180 kW continuously. At full runtime, that is ₹91 lakh per year from valve wear and leakage that a weekly submeter review would catch in days.
Bag Filter Fan
10% amp rise
A 200 kW bag filter fan running 10% above baseline for 60 days before discovery wastes 28,800 kWh — and the root cause is typically blinded bags that, if detected early, require a 4-hour clean rather than a bag replacement shutdown.
Cement Mill Drive
Ball charge depletion
A 3,500 kW mill running 8% above its Blaine-normalised baseline due to media depletion wastes 280 kW — and produces coarser cement simultaneously. Submeter FDD catches this before a quality non-conformance is raised.
Frequently Asked Questions
How many submeters does a typical cement plant need for effective FDD?
Priority submetering targets the kiln drive, raw mill, cement mill, compressor room busbar, and clinker cooler fan group — typically 8 to 15 meters covering 70 percent of total plant consumption. A full circuit-level installation with 40 to 60 meters provides near-complete visibility. Start with high-consumption circuits and expand from there.
Oxmaint works with any meter brand — connect your existing meters first.
What is the difference between an anomaly alert and baseline drift in FDD?
An anomaly alert fires when a reading crosses a defined threshold in a single measurement window — a sudden step-change indicating a discrete fault. Baseline drift is a gradual upward creep over days or weeks, below the alert threshold, that indicates progressive equipment wear. Both require action, but drift is the harder pattern to catch without trend monitoring.
Book a demo to see how Oxmaint handles both alert types.
Does our CMMS need to integrate with our energy meters for this to work?
Integration is what makes FDD operationally useful. Without a link between submeter data and the CMMS, anomalies appear on an energy dashboard that no maintenance technician is monitoring. Oxmaint accepts data from Modbus, BACnet, MQTT, and API-connected meters, routing alerts directly to work orders assigned to the correct asset and technician — closing the loop between detection and repair.
How do we prove energy savings to management after a maintenance intervention?
The CMMS work order is your evidence document. When Oxmaint raises a work order from an anomaly alert, it records the pre-fault kWh baseline and the alert timestamp. After the repair, the system measures post-repair consumption for the same circuit under the same production conditions. The difference — documented in the work order — is the verified energy saving attributable to that specific maintenance action.
Is energy submeter FDD relevant for ISO 50001 compliance in cement plants?
Yes — ISO 50001 requires that significant energy users (SEUs) be identified, baselined, and monitored for deviation. Continuous submeter monitoring with documented anomaly detection and corrective action directly satisfies the standard's monitoring, measurement, and analysis requirements. Oxmaint's audit trail provides the evidence records that ISO 50001 auditors require.
Start building your compliance record in Oxmaint today.
Oxmaint Energy and Maintenance
Your Meters Are Detecting Anomalies. Is Your CMMS Acting on Them?
Oxmaint connects energy submeter data to maintenance work orders automatically — so every kWh anomaly becomes a scheduled repair, every repair becomes a documented energy saving, and your plant gets measurably more efficient with every cycle.