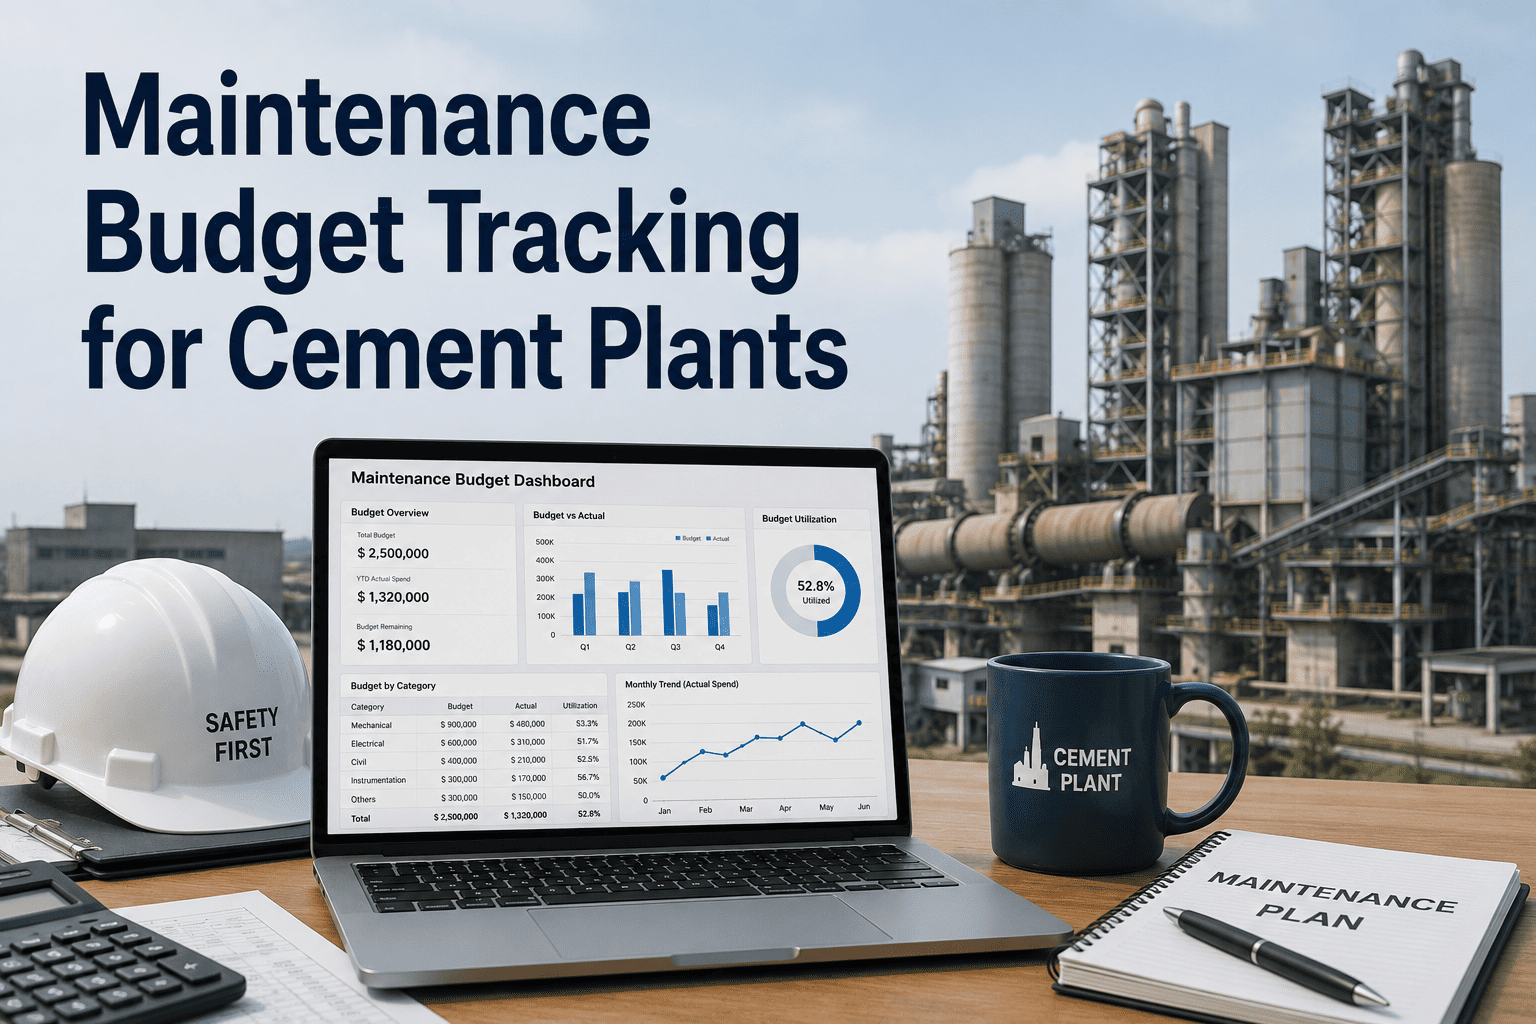
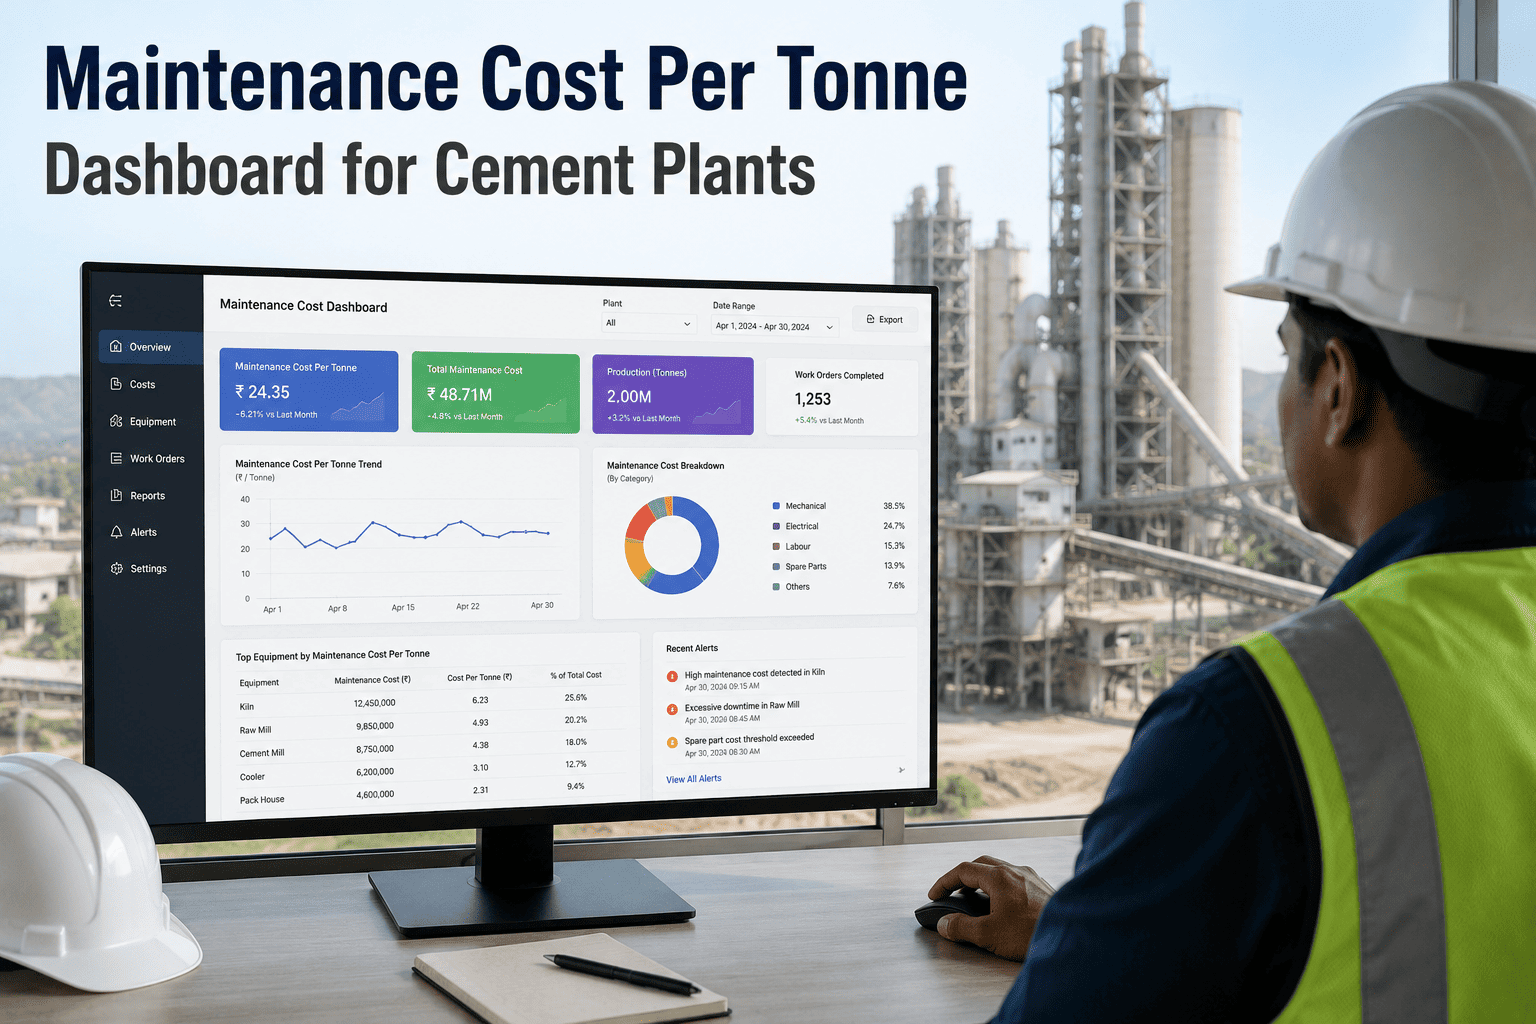
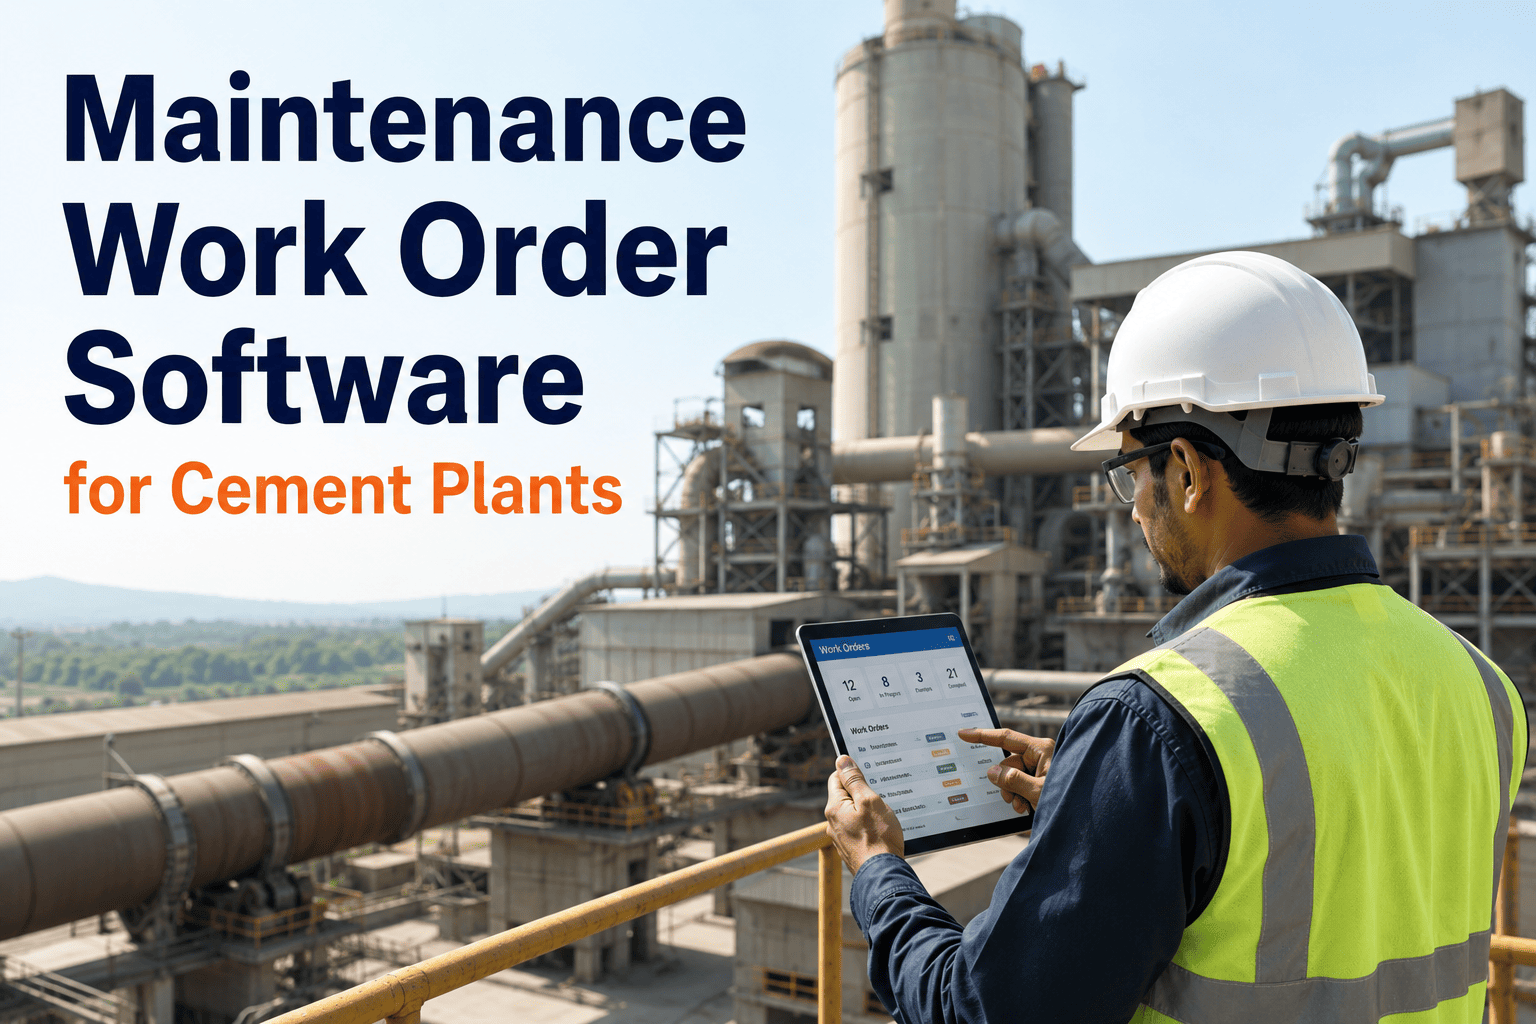
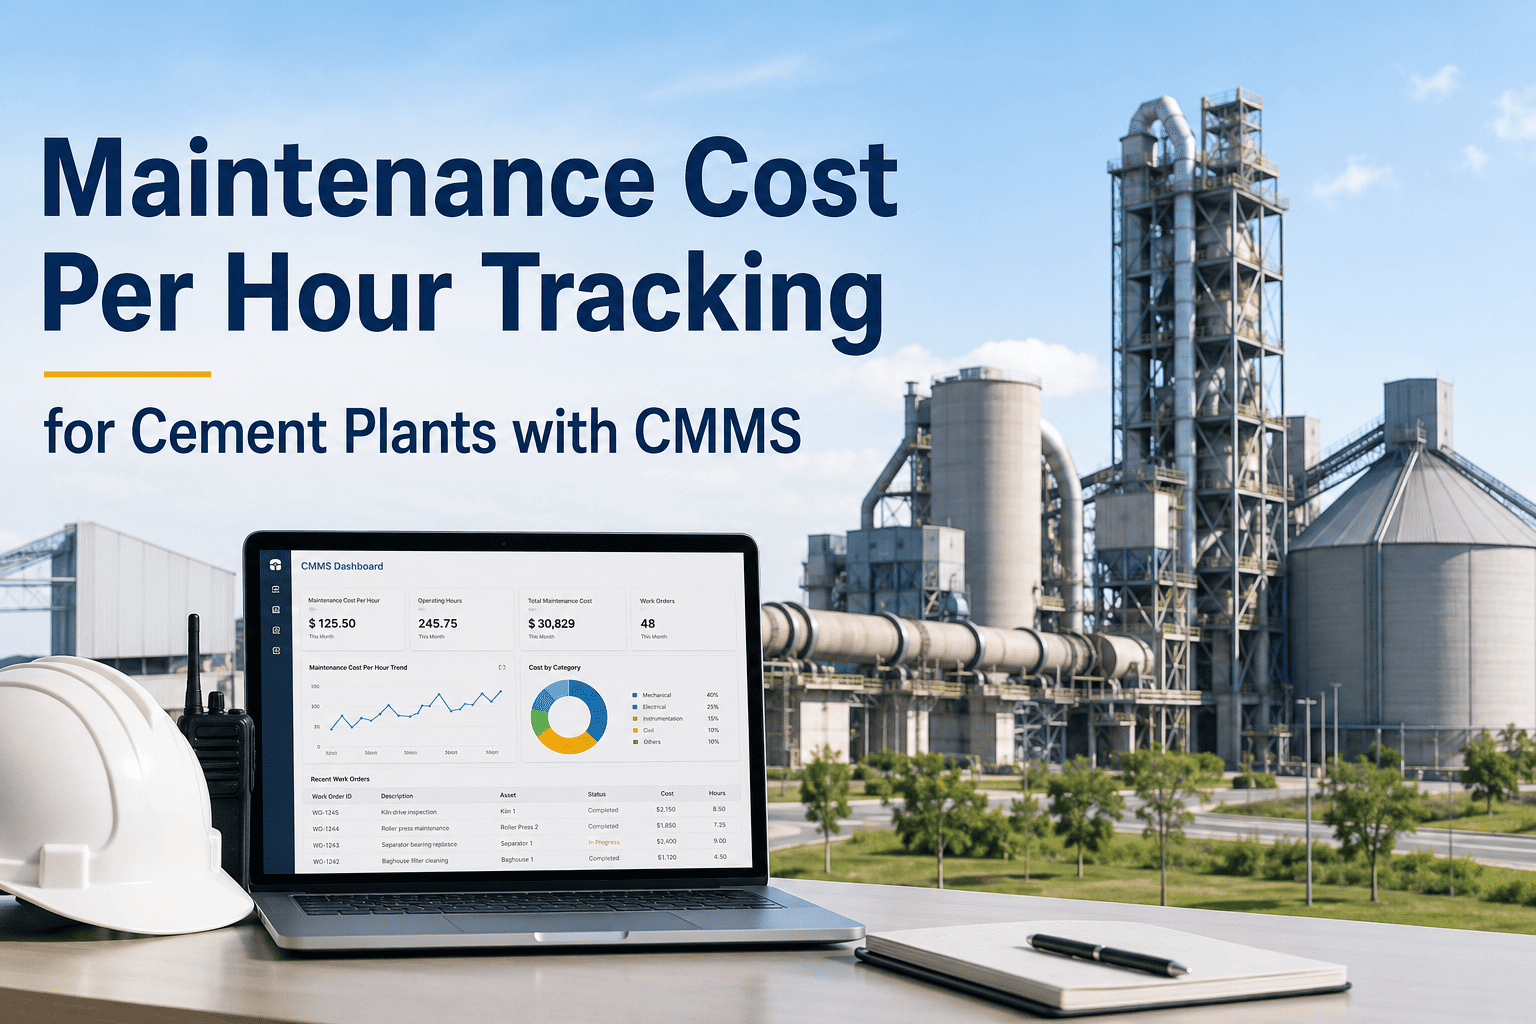
Maintenance and operating expenses consume 15 to 25 percent of total cement production costs — and in most plants, 55 percent of that budget drains into emergency reactive repairs that cost four to six times more per event than a planned intervention. The problem is not that plant managers spend too much. It is that they cannot see where it is going until the invoice arrives. Work order costs are tracked in paper books or spreadsheets. Labour hours are estimated, not measured. Parts spend is visible only after the month-end journal entry. By the time the budget variance shows up, the overspend is already three weeks old. OxMaint Maintenance Cost Dashboards give cement plant managers real-time visibility into every cost driver — work order spend by asset area, parts consumed vs budgeted, labour hours by crew, and variance from plan — so decisions are made on current numbers, not last month's report. Start a free trial and see your maintenance spend in a live dashboard today.
ANALYTICS — CEMENT PLANT BUDGETS
See Every Dollar of Maintenance Spend Before the Month Closes
OxMaint tracks work order costs, parts spend, labour, and variance by asset area in real time — giving cement plant managers the visibility to control budgets, reduce reactive spend, and justify every line item at the next board review.
Where Cement Plant Maintenance Budgets Leak
55%
Reactive Emergency Spend
The average cement plant spends over half its maintenance budget on unplanned reactive repairs — at 4–6x the cost of an equivalent planned intervention. Best-in-class plants target this below 25%.
3.2×
Emergency Parts Premium
Parts sourced under emergency procurement cost on average 3.2 times the standard purchase price, plus air freight. This is the most directly controllable line item in maintenance cost — and the most overlooked.
40%
Invisible Labour Overspend
Labour hours on reactive jobs are rarely captured accurately. Overtime, contractor call-outs, and multi-crew mobilisations inflate reactive labour cost by 40% above estimate — and most CMMS systems never capture this.
$2M+
Dead Stock Carrying Cost
The average cement plant carries between $2M and $18M in spare parts inventory. 20–30% of that is slow-moving or obsolete stock — capital tied up in parts that will never be used, discovered only in annual stocktakes.
What OxMaint Cost Dashboards Track — In Real Time
Work Order Cost by Asset Area
Kiln System
82% of budget
Ball Mill Circuit
107% — over
VRM / Raw Mill
64% of budget
Crusher and Conveyor
91% of budget
Utilities and Aux
45% of budget
Live view — updated on every work order closure. Ball mill circuit flagged for manager review.
Planned vs Reactive Ratio
68 : 32
Target 75:25 — track weekly
Maintenance Cost per Tonne
$2.84
Benchmark $2.40 — identify gap assets
Emergency Parts Spend MTD
$47,200
Up 22% vs same period prior month
REAL-TIME SPEND VISIBILITY — EVERY ASSET AREA
Stop Managing the Maintenance Budget From Last Month's Report
OxMaint gives cement plant managers live cost dashboards — work order spend, parts consumed, labour hours, and variance — so overruns are caught in week one, not discovered after month-end close.
Budget Tracking Across the Full Maintenance Cost Stack
Parts and Materials
Every part consumed on a work order posts to the asset's cost record. Monthly parts spend is visible by asset, by equipment category, and by work type — with drill-down to individual part SKUs and supplier invoices.
Direct Labour Hours
Technician time recorded on OxMaint work orders captures actual vs estimated labour hours per job. Overtime and contractor hours are tagged separately — giving a true picture of labour efficiency and reactive call-out cost.
Contractor and External Work
Specialist contractor invoices are attached to the work orders that drove them. Budget vs actual is tracked by contractor type — making it straightforward to challenge a contractor quote with historical cost data from the same job last year.
Budget vs Actual Variance
Every asset area carries a budget allocation in OxMaint. As work orders close, cumulative spend tracks against the allocation in real time. Variance alerts fire when an area exceeds a defined threshold — flagging overruns before they compound.
Frequently Asked Questions
How does OxMaint capture maintenance costs — do technicians need to enter data?
Parts costs post automatically from inventory consumption on work orders. Labour hours are recorded by technicians when closing each job — a two-tap action on mobile. Contractor costs are attached by the planner or supervisor when approving external work. Most cost data enters the system as a natural part of the work order workflow, not as a separate data entry task.
Start a free trial to see the mobile work order cost capture flow.
Can OxMaint export cost data to finance systems or SAP CO?
Yes. Work order costs post to SAP CO cost centres automatically through OxMaint's SAP integration. For finance teams using other ERP systems, OxMaint supports scheduled cost exports in CSV and standard integration formats. Finance gets accurate maintenance cost data in their system without re-keying from CMMS reports.
Book a demo to see the cost export and SAP CO integration.
How does OxMaint support the annual maintenance budget planning cycle?
OxMaint generates asset-level cost histories — two to three years of work order spend by asset, work type, and cost category. Budget planning teams use these histories for zero-based budgeting, replacing percentage-increase guesses with data from actual maintenance execution. This typically improves first-pass budget accuracy significantly and reduces mid-year variances.
Can we see maintenance cost per tonne of clinker — not just total spend?
Yes. OxMaint can be configured to calculate maintenance cost per unit of production output using production data inputs. Maintenance cost per tonne is one of the most meaningful KPIs for cement plant leadership — it normalises spend for production volume changes and enables year-over-year benchmarking that total spend numbers cannot provide.
How quickly can we get the cost dashboard live after starting OxMaint?
Basic cost tracking — parts, labour, and contractor costs against work orders — is live from day one of OxMaint deployment. Asset-level budget allocations and variance alerts are configured during onboarding and typically active within the first two weeks. Historical cost data can be imported from prior CMMS or spreadsheet records to enable trend analysis immediately.
Start your free trial to begin cost tracking today.
OXMAINT — CEMENT PLANT COST DASHBOARDS
Track Every Maintenance Dollar. Cut the 55% That Shouldn't Be There.
OxMaint maintenance cost dashboards show work order spend, parts consumed, labour hours, and budget variance by asset area — in real time, not at month-end. Give your plant manager and finance team the visibility to act before overruns become overspend.