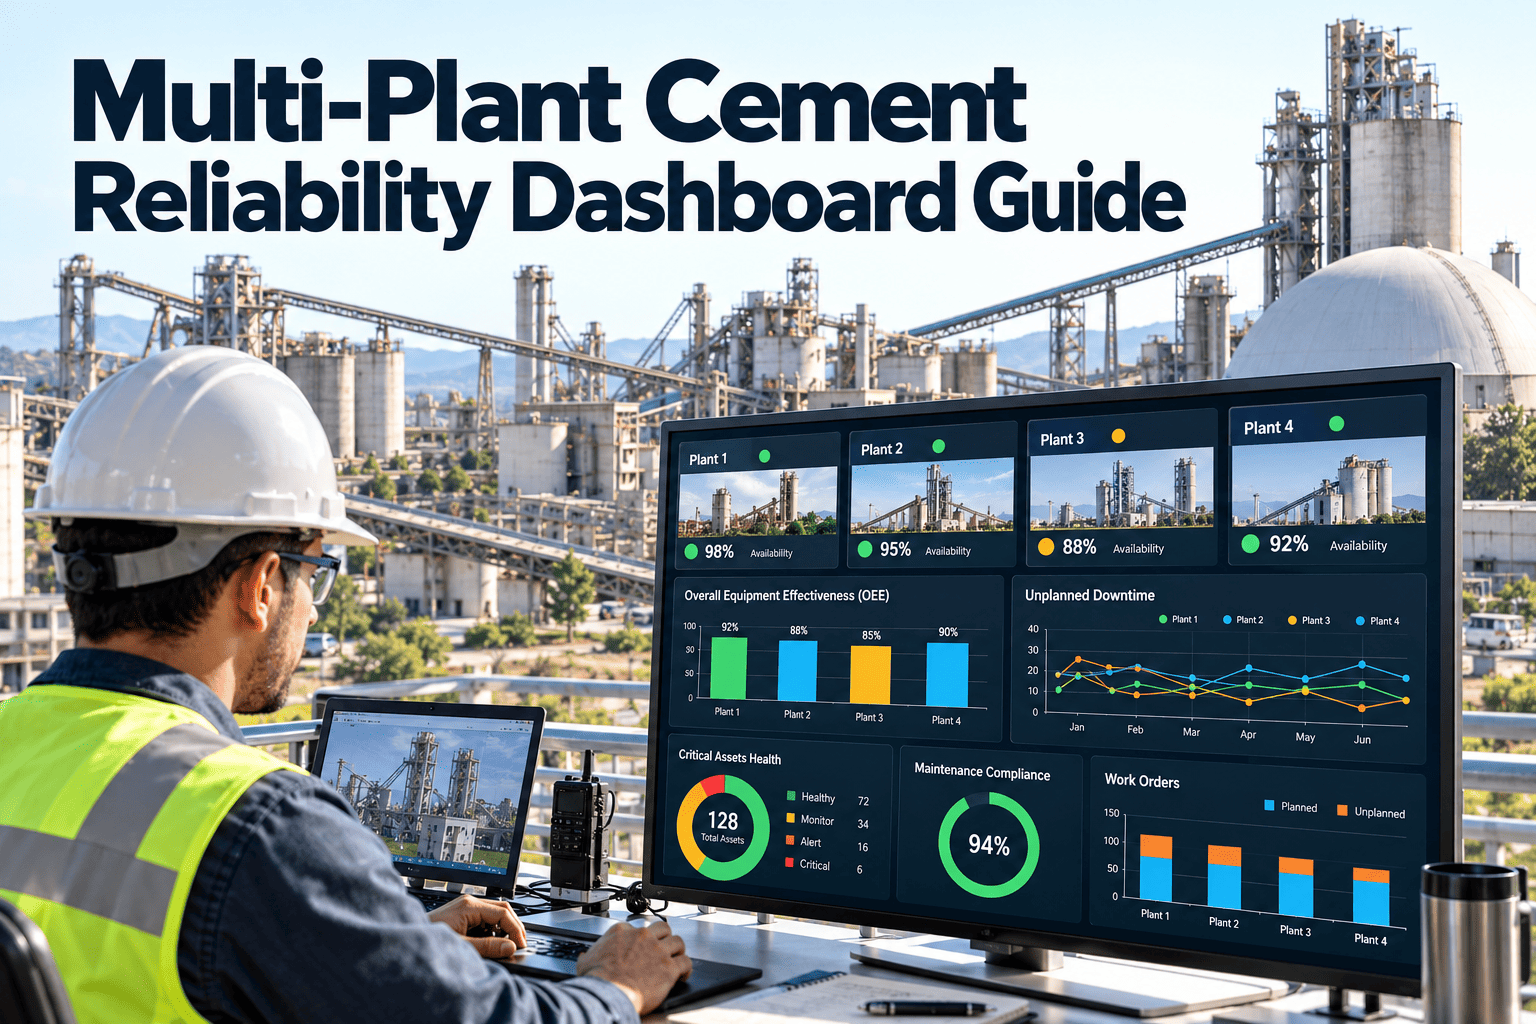
Cement groups often run several plants with different kilns, mills, ages, and maintenance habits, yet corporate teams still compare them through monthly spreadsheets that nobody fully trusts. Each site names assets differently, counts downtime differently, and closes work orders differently, so a group-level reliability number rarely means the same thing twice. This guide shows how to design a multi-plant cement reliability dashboard that is built on shared definitions, clean data, and clear actions. It also explains how Oxmaint maintenance management software can supply the standard records those dashboards depend on.
Multi-Plant Cement Reliability Dashboard Guide
Replace plant-by-plant spreadsheets with one reliability view. Standardize definitions first, then compare kilns, mills, and utilities across sites with confidence.
Kiln, raw mill, cement mill Plant B
Kiln, coal mill, packing Plant C
Grinding unit Plant D
Kiln, WHR, utilities
Why multi-site cement data stays siloed
Silos rarely come from missing software. They come from sites solving the same problem independently over many years.
What the group sees today
- The same kiln fan is named three different ways across plants
- Downtime is logged by operations at one site and maintenance at another
- PM compliance is calculated with different rules per plant
- Monthly reports arrive late and cannot be traced to source records
- Spare parts are held at every site with no group visibility
- Plant managers argue about the numbers instead of the causes
What the group needs
- One naming and hierarchy standard for common equipment
- One definition of planned, unplanned, and external downtime
- One PM compliance formula applied everywhere
- Dashboards that drill down to the original work order
- Shared visibility of critical spares and slow-moving stock
- Reviews that focus on repeat failures and actions
Standardize before you visualize
A dashboard only displays the quality of the data behind it. These four standards decide whether site numbers can be compared fairly.
| Standard | What to define | Typical problem without it |
|---|---|---|
| Asset hierarchy | Plant, area, system, equipment, and component levels with consistent codes | Kiln drive failures cannot be grouped across plants |
| Failure coding | Short lists for failure mode, cause, and equipment condition | Free-text causes make repeat failures invisible |
| Downtime categories | Planned stop, unplanned stop, process stop, external stop, and idle time | Plants report availability on different bases |
| Priority and work type | Emergency, urgent, planned, preventive, inspection, and project work | Backlog and planned work percentage lose meaning |
| KPI formulas | Numerator, denominator, time basis, and excluded events | Two sites with the same score are measured differently |
Four layers of a useful reliability dashboard
Different people ask different questions. Design one layer for each audience and let each layer drill into the next.
Core KPIs and how to define them
Choose a short list and write each formula down. Avoid adding indicators that no one acts on.
| KPI | Definition | Use at group level | Watch out for |
|---|---|---|---|
| Equipment availability | Time equipment is able to run ÷ calendar time in scope | Rank critical lines such as kilns and cement mills | Process stops mixed with breakdowns |
| MTBF | Operating time ÷ number of failures | Find chronic failure assets across sites | Poor failure coding distorts the count |
| MTTR | Total repair time ÷ number of repairs | Compare response and parts readiness | Waiting time must be tracked separately |
| PM compliance | Preventive tasks completed on time ÷ tasks due | Check execution discipline | Different grace periods per site |
| Planned work percentage | Planned labour hours ÷ total labour hours | Shows reactive versus controlled maintenance | Emergency work booked as planned |
| Backlog in weeks | Estimated hours of open work ÷ weekly crew hours | Reveal capacity gaps | Stale or duplicate work orders |
| Repeat failure rate | Same failure mode on the same asset type within a set period | Select root cause analysis targets | Inconsistent asset coding |
Comparing plants fairly
A league table without context can punish the plant with the hardest equipment. Normalize before ranking.
Where dashboard data goes wrong
Most dashboard failures are data quality failures. Audit these points before presenting numbers to leadership.
Build one reliability record for every plant
Start with a shared asset structure, common work order rules, and dashboards that open the original maintenance record.
What group leaders should ask the dashboard
Good dashboards answer decisions, not curiosity. Frame views around these questions.
- Which kiln, mill, and utility assets cause the most lost production across the group?Ranked by downtime hours and repeat failures
- Are preventive tasks on critical equipment actually being completed?PM compliance by plant and asset class
- Do any sites carry more reactive work than their peers?Planned versus emergency labour
- Which critical spares are held twice, or not at all?Inventory by part and location
- Where can a practice from one plant be copied elsewhere?Plants with low repeat failure for the same equipment
A phased rollout across plants
Do not launch every site and every KPI together. Prove the model at one plant, then scale it.
- Phase 1: Agree the standardForm a small group with maintenance, operations, and IT. Agree hierarchy, failure codes, downtime categories, and KPI formulas.
- Phase 2: Pilot one plantLoad critical assets, configure work order rules, train planners, and run the dashboard in parallel with the old reports.
- Phase 3: Clean and validateCheck missing assets, late closures, and duplicate records. Fix the process, not just the data.
- Phase 4: Add plants in wavesRepeat the same template and training. Allow only local additions that do not change group definitions.
- Phase 5: Review and improveHold a monthly group review on actions, not just charts. Retire indicators that nobody uses.
Governance: who owns what
Without owners, standards drift within a year. Assign clear roles.
Group reliability lead
Owns KPI definitions, failure code lists, and the review calendar.Plant maintenance head
Owns data discipline, work order closure, and actions from reviews.Planners and schedulers
Keep backlog, PM schedules, and asset records accurate.Operations and process teams
Record process stops separately and confirm downtime causes.Stores and procurement
Maintain spare records and critical stock rules across sites.How Oxmaint supports multi-plant reliability reporting
Oxmaint is a maintenance management platform. It provides the structured records and reporting that a reliability dashboard needs, while your standards define how they are used.
Asset management
Hold kilns, mills, fans, conveyors, and utilities in a consistent hierarchy with full history.Work orders
Raise, assign, and close preventive and corrective work with required fields and priorities.Preventive maintenance
Schedule recurring tasks by interval so compliance can be measured the same way at each site.Mobile inspections
Technicians record readings, observations, and photos at the equipment during rounds.Inventory
Track spare parts and consumption so slow-moving and critical stock is easier to review.Reports and dashboards
Review backlog, compliance, and failure history, and drill down to the underlying records.Review cadence that turns charts into action
A dashboard without a meeting rhythm becomes wallpaper. Tie each view to a forum, an owner, and an output.
| Forum | Who attends | Questions asked | Output |
|---|---|---|---|
| Daily plant meeting | Maintenance, operations, planners | What stopped, why, and what is overdue on critical equipment? | Priorities for the day and assigned owners |
| Weekly planning review | Planners, section engineers, stores | Is the schedule realistic and are parts available? | Frozen weekly schedule and parts requests |
| Monthly plant review | Plant head, maintenance head, process lead | Which assets repeat failures and where is backlog growing? | Root cause actions and budget decisions |
| Monthly group review | Group reliability lead and plant maintenance heads | Which practices and risks should be shared across plants? | Group action list and standard updates |
| Quarterly strategy review | Group operations and finance | Are spares, shutdown plans, and capital needs aligned? | Shutdown scope and investment priorities |
From a dashboard alert to a corrective work order
The value of a reliability dashboard shows when a signal becomes a job with an owner and a due date.
- Spot the signalA kiln fan drive shows rising repeat failures, or a plant's overdue critical inspections increase month on month.
- Drill to the recordsOpen the underlying work orders and read the failure codes, readings, photos, and parts used.
- Confirm the causeInvolve operations and the section engineer to decide whether the cause is design, operation, lubrication, or workmanship.
- Assign the actionRaise a corrective or improvement work order with an owner, priority, and due date.
- Check the resultReview the same indicator in later periods and close the action only when the failure pattern changes.
Critical equipment classes to track at group level
Start with equipment where a failure stops production or creates safety, quality, or environmental risk. Do not try to trend every asset on day one.
| Area | Typical critical assets | What to compare across plants |
|---|---|---|
| Pyroprocessing | Kiln drive, support rollers, tyres, ID fan, cooler drives | Unplanned stops, repeat failures, inspection compliance |
| Raw and coal grinding | Vertical roller mills, ball mills, classifiers, mill fans | Wear part life, vibration events, downtime causes |
| Cement grinding | Mill drives, gearboxes, separators, bearings | Gearbox failures, lubrication tasks, MTTR |
| Material handling | Crushers, belt conveyors, bucket elevators, stackers | Backlog, spare readiness, planned work percentage |
| Packing and dispatch | Packers, loaders, bag handling systems | Downtime categories and response time |
| Utilities and power | Compressors, transformers, WHR systems, DG sets | Inspection compliance and failure trends |
Data sources a reliability dashboard can combine
Maintenance records are the foundation. Other systems add context when they are linked by the same asset codes.
- CMMS recordsWork orders, inspections, failure codes, labour hours, and spare consumption form the base layer.
- Production and stoppage logsControl room records separate process stops, external stops, and equipment breakdowns.
- Condition monitoring dataVibration, temperature, and oil analysis results can trigger inspections and corrective work.
- Stores and purchasingPart availability and lead times explain long repair times and should be visible beside MTTR.
- Cost dataMaintenance spend by asset class helps justify replacement or redesign for chronic problem equipment.
Design rules for cement reliability dashboards people actually use
Plant teams stop opening dashboards that are slow, cluttered, or impossible to trust, so usability is a reliability issue too. Keep these rules in the design brief.
Avoid
- More than a handful of headline indicators on the first screen
- Scores with no link to the records behind them
- Colour coding with thresholds nobody has agreed
- Monthly snapshots that hide weekly deterioration
- Rankings that mix kilns with packing machines or utilities, which hides real differences
- Dashboards that only corporate staff can open and understand
Prefer
- A short list of indicators with written definitions
- Drill-down from group to plant to asset to work order
- Thresholds agreed by maintenance and operations together
- Trend lines with weekly and monthly views
- Comparisons only between similar equipment types
- Views that plant supervisors also use during daily meetings
Multi-plant reliability dashboard FAQs
What should a cement reliability dashboard show first?
Start with availability, PM compliance, backlog, and repeat failures for critical lines. Add more only when teams act on them.
How do I compare plants with different equipment?
Group by equipment type and separate process stops from breakdowns. Use trends and outliers, not one ranking.
Do all plants need the same CMMS setup?
Core definitions should match, with local additions allowed. Oxmaint supports shared structures across sites.
How long does standardization take?
It depends on asset count and data quality. A pilot plant usually shows the gaps before wider rollout.
Where should we begin?
Agree KPI formulas and asset codes with one pilot plant. Book a demo to map the setup.
Give every plant the same reliability language
Bring maintenance records, definitions, and reviews into one system so group decisions rest on numbers every site trusts.