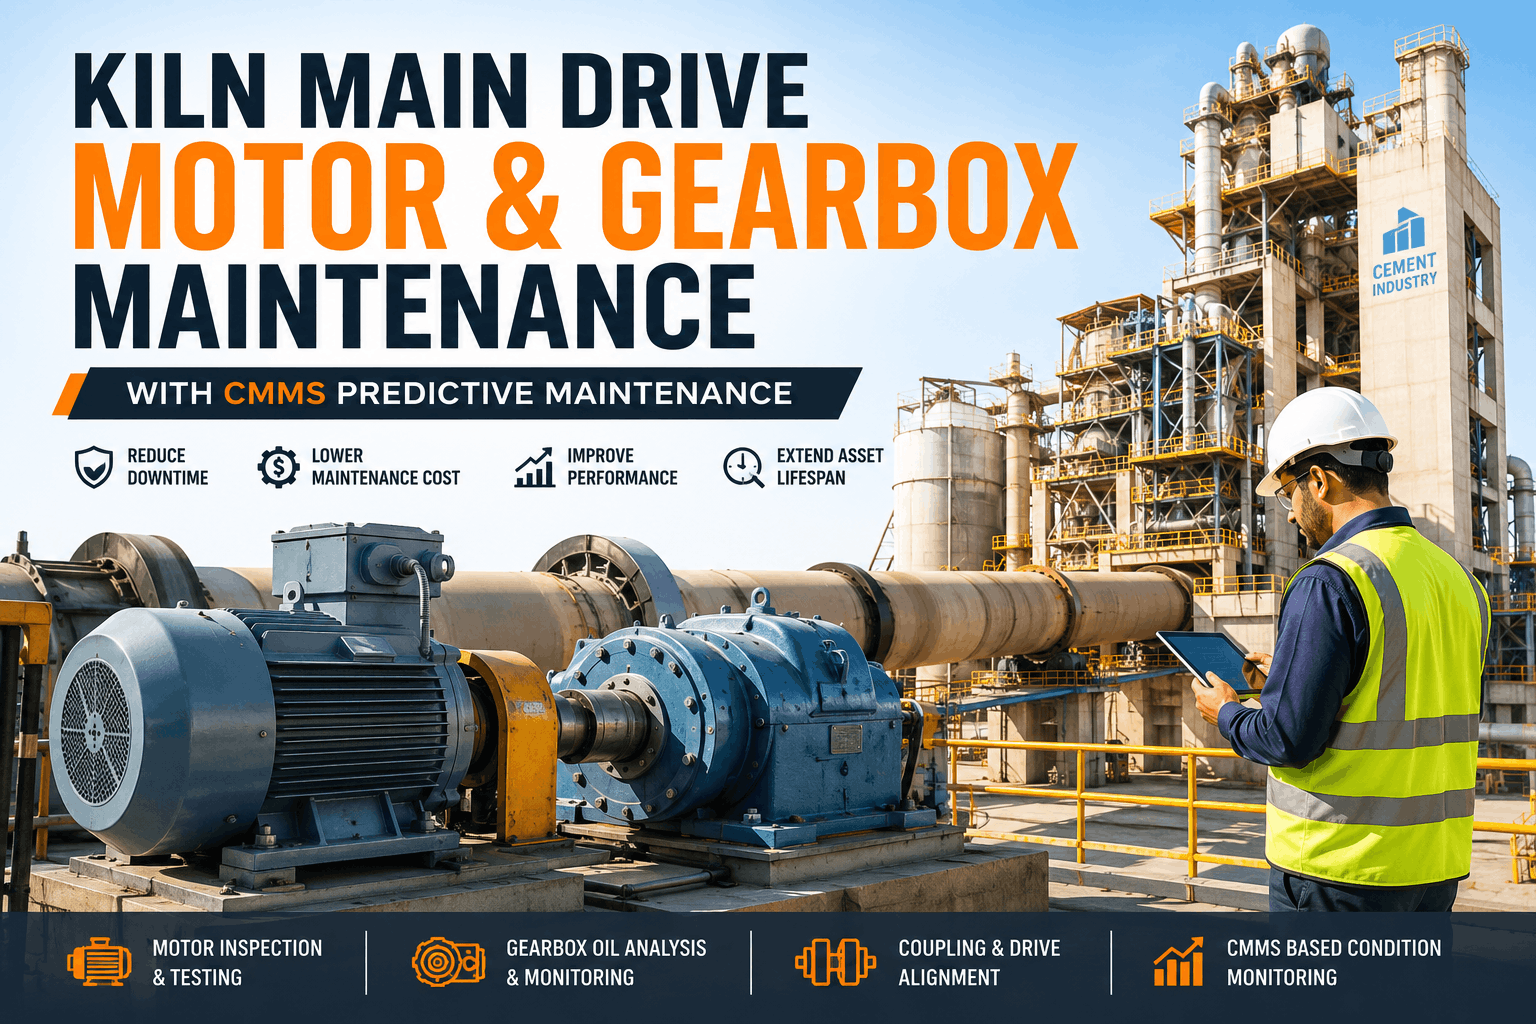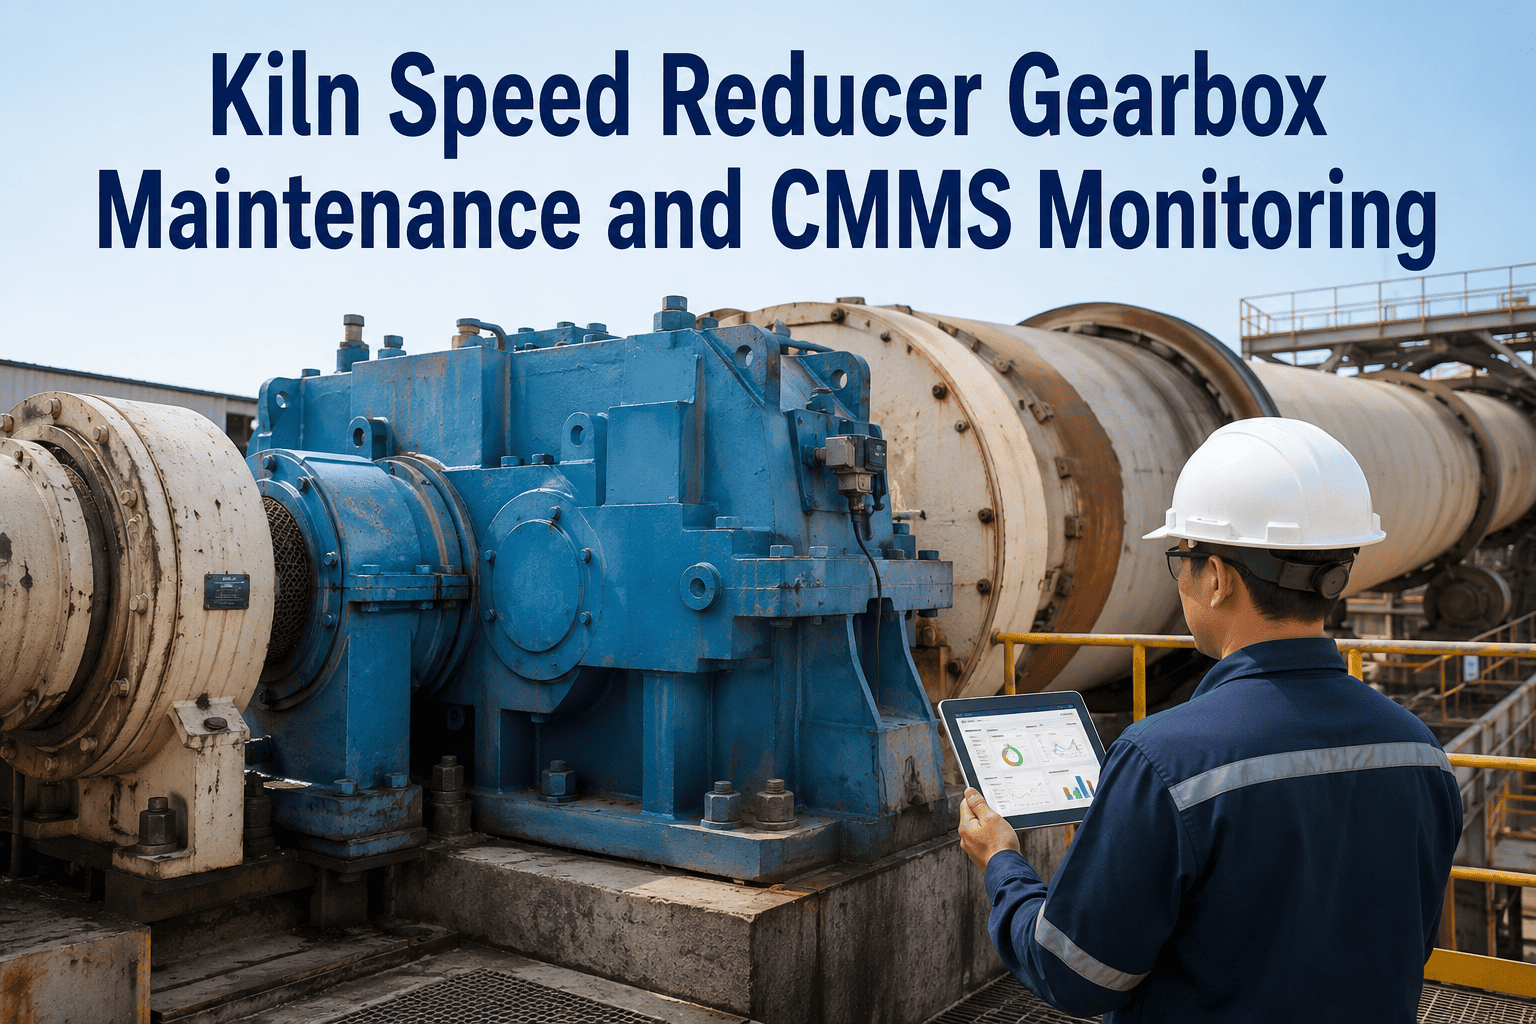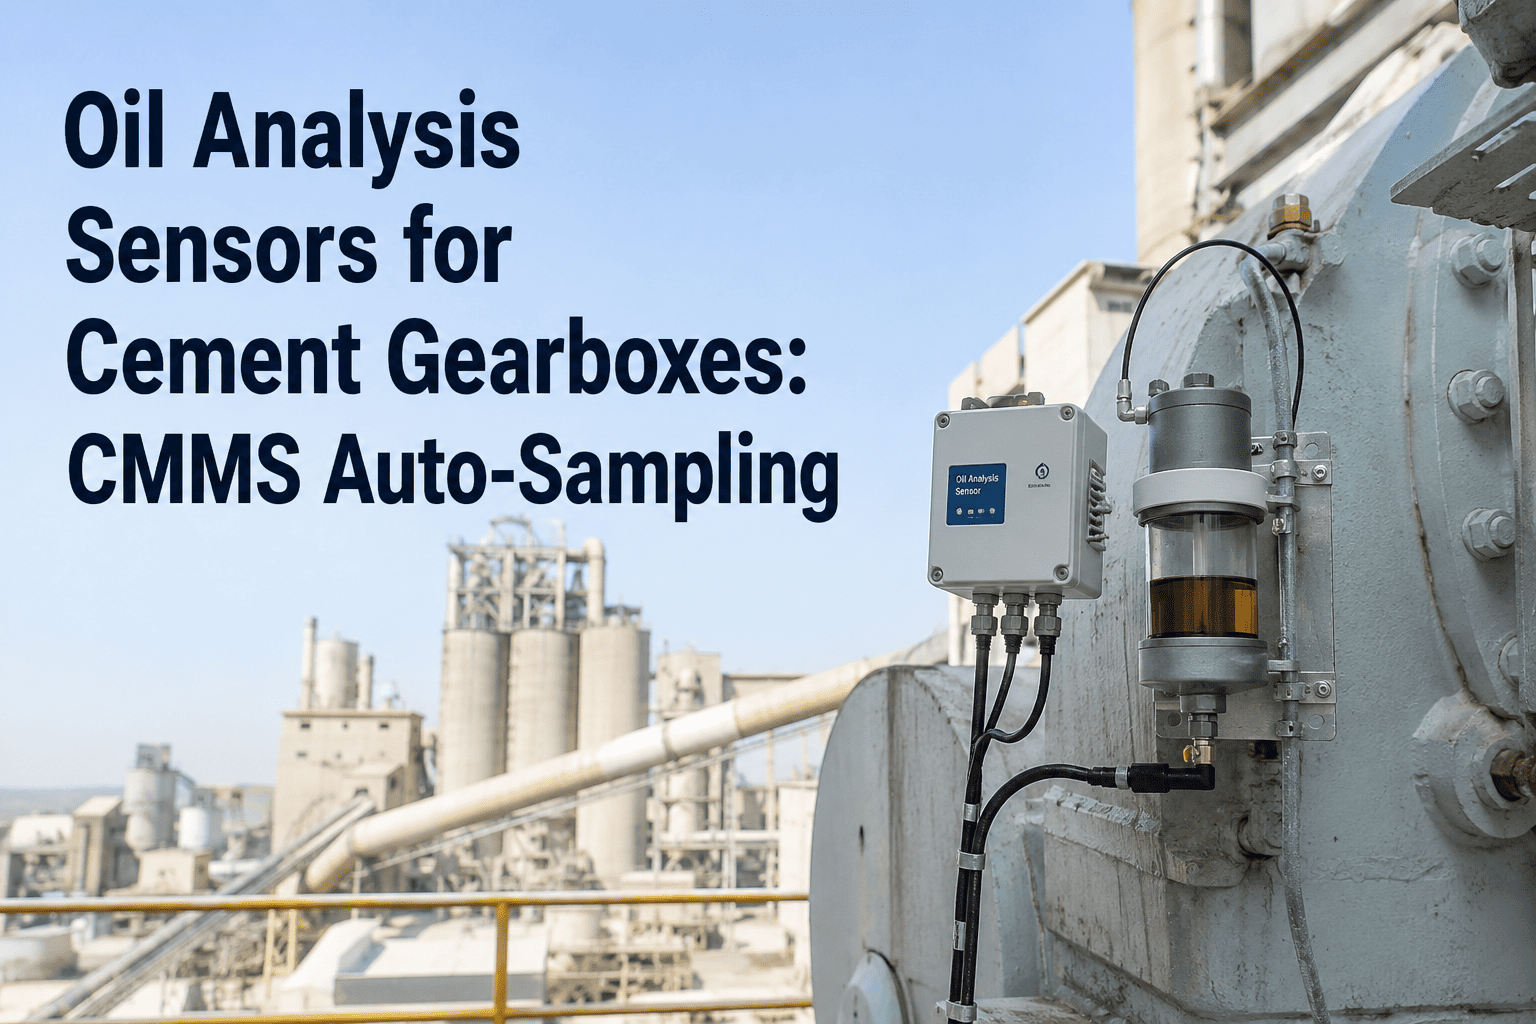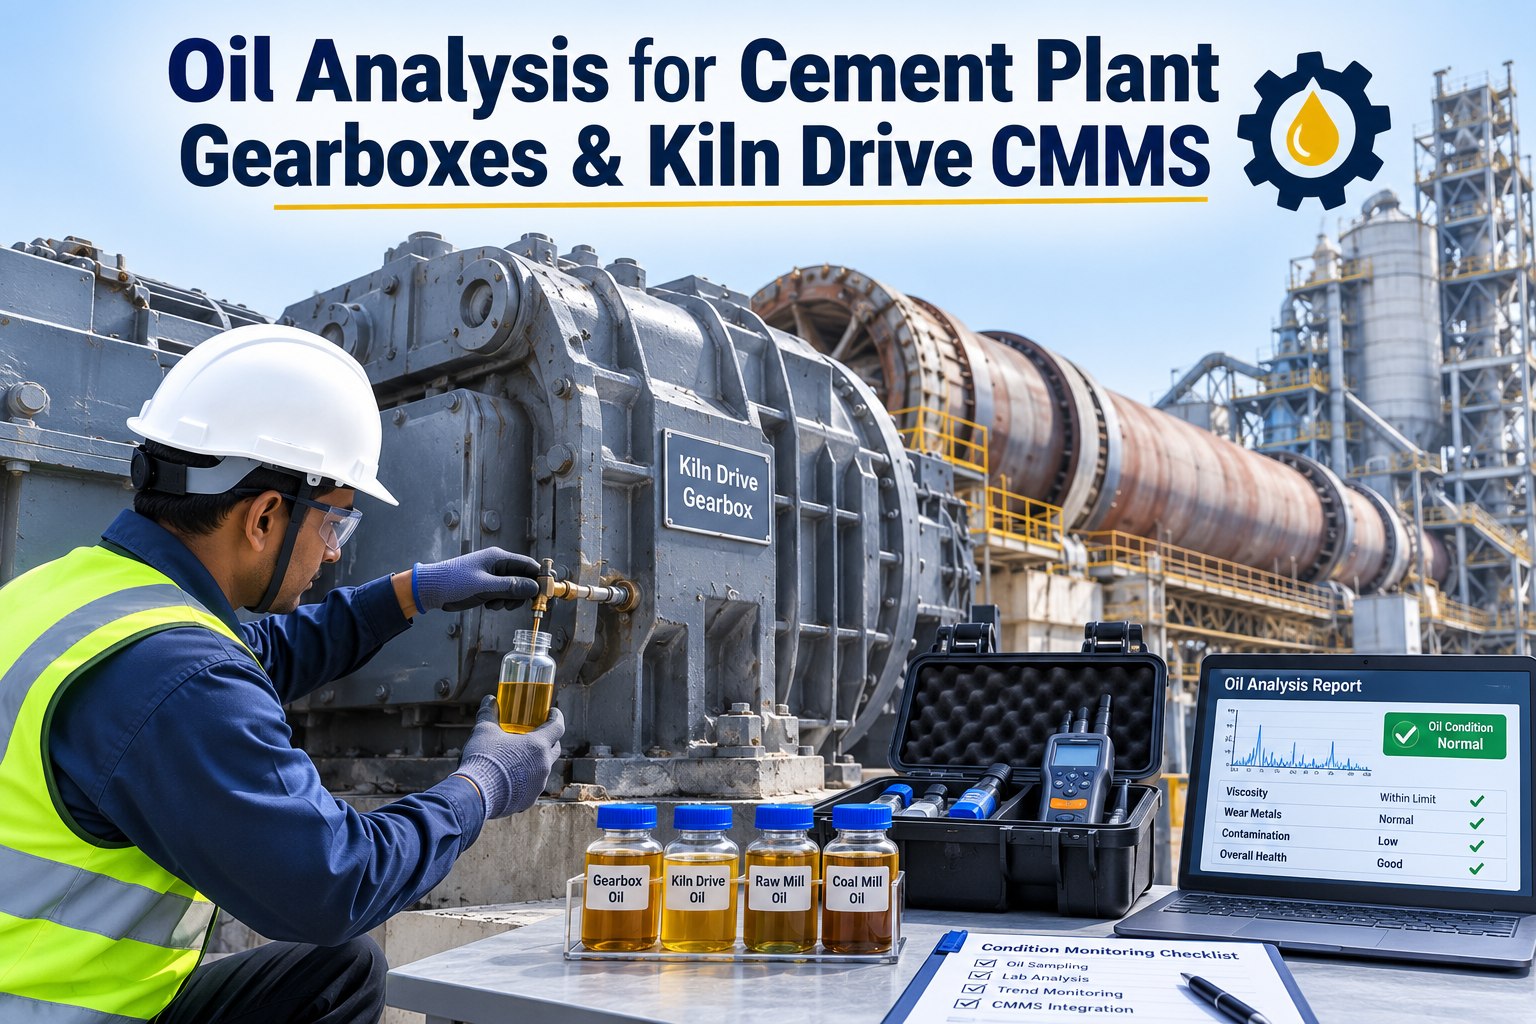
In a cement plant, a single kiln main drive gearbox can cost upward of $480,000 to replace — and when it fails unexpectedly, clinker production stops within minutes, with downtime losses running $8,000–$15,000 per hour. Oil analysis catches the earliest chemical signatures of that failure: wear metal spikes, viscosity drift, and additive depletion appear in the lubricant weeks before vibration, temperature, or acoustic symptoms become detectable. This guide walks reliability engineers and maintenance managers through a complete oil analysis program for cement gearboxes — from sampling protocols at the kiln drive, ball mill, and VRM reducer, to laboratory selection, trend analysis, and the CMMS integration that converts a critical lab result into an automatic work order. Build the entire program in oxmaint — Start Free Trial and connect your lab feed today.
CMMS Oil Analysis Guide · Cement Rotating Equipment
What if your gearbox oil predicted failure 6 weeks before vibration did?
Wear metals, viscosity loss, and additive depletion leave traces in the lubricant long before a bearing howls or a temperature trip fires. A structured oil analysis program for cement plant gearboxes — kiln main drive, ball mill, VRM reducer — turns those traces into automatic work orders inside your CMMS.
The Case · Why Oil First
Wear metals surface in oil weeks before they surface in vibration data
ISO 14224 reliability data shows that 43% of gearbox failures in cement plants originate in the lubricant — wrong viscosity, contamination, or additive depletion — yet most plants still rely on vibration as their first line of defense. By the time a 1× or 2× gear mesh frequency trend shifts, the tooth surface is already pitting.
Worked Example
A 5,000 TPD plant in Central India runs 14 critical gearboxes — kiln drives, ball mills, a VRM reducer, and a series of conveyor drives. Their annual lubricant spend is roughly $42K and their unplanned gearbox failures were costing $310K/yr in parts plus lost production. After implementing quarterly oil analysis with auto-routed work orders in oxmaint, they caught a kiln drive pinion-bearing failure 5 weeks early — shifting the repair from an emergency 3-day outage to a planned 14-hour window during a scheduled refractory stop. Net first-year savings: $187K, payback in under 5 months.
Sampling Protocols · The Three Critical Gearboxes
Where, when, and how to draw oil from each cement gearbox
Sampling consistency is everything — a sample taken from the wrong point or at the wrong temperature is worse than no sample at all. These three asset classes drive 80% of cement lubricant spend and 70% of gearbox failure cost.
Kiln Main Drive Gearbox
Draw from the drain valve downstream of the filter, while the unit is at operating temperature (60–70 °C). Sample every 1,000 operating hours or monthly — whichever comes first. Watch Fe, Cu, and Si trends closely; a 2× rise in Fe over two consecutive samples signals pinion or girth-gear wear.
Ball Mill Gearbox
Sample at the return line before the filter — never the reservoir bottom, where settled debris skews particle counts. Every 2,000 hours or 60 days. Cement dust ingress (Si + Al) is the dominant failure mode here; set alarm limits at 15 ppm Si above baseline.
VRM Reducer
Sample from the pressurized supply line to the thrust bearing, with the mill under load. Quarterly minimum. The VRM reducer is the highest single-asset gearbox replacement cost in a cement plant ($600K–$1.1M) — track PQ index, water (Karl Fischer), and additive metals (P, Zn) for EP depletion.
Laboratory Selection · What to Send, What to Expect
Choosing the right lab and test slate for cement lubricants
Not all labs understand cement dust. Select an ISO 17025-accredited laboratory that can deliver results within 72 hours and supports ASTM D5185 (wear metals by ICP), D445 (kinematic viscosity), D6304 (water by Karl Fischer), and PQ index as a minimum test slate.
| Test Parameter | Method | Alarm Limit (Cement) | What It Reveals |
|---|---|---|---|
| Wear Metals (Fe, Cu, Cr, Sn) | ASTM D5185 ICP | Fe > 150 ppm (kiln) · > 200 ppm (mill) | Bearing, gear tooth, and bushing wear progression |
| Kinematic Viscosity @ 40 °C | ASTM D445 | ±10% from nominal grade | Shear loss, fuel dilution, wrong top-up oil |
| Water Content | ASTM D6304 (KF) | > 500 ppm (0.05%) | Cooler leak, steam ingress, condensation in reservoir |
| Particle Quantifier Index | PQ (Magnetic) | > 60 or 2× rising trend | Ferrous debris from severe adhesive or abrasive wear |
| Silicon + Aluminum | ASTM D5185 ICP | Si > 25 ppm above baseline | Cement dust and bauxite ingress through seals or breather |
| Additive Metals (P, Zn, Ca, Mg) | ASTM D5185 ICP | ±20% from new-oil reference | EP/anti-wear additive depletion, wrong make-up oil |
Tip: send a 250 mL sample bottle, not 100 mL — the lab needs enough volume to re-run viscosity if the first test is borderline. Label with asset ID, sampling point, operating hours since last change, and lubricant grade.
Trend Analysis · Reading the Data
A single sample tells you nothing — a trend tells you everything
Absolute limits are a starting point, but the real predictive power comes from trending. A Fe value of 120 ppm on a kiln gearbox is meaningless without context — it could be normal run-in, or it could be a 3× jump from last month. Build trend charts for every critical parameter on every critical gearbox.
Rise over baseline in any single wear metal across two consecutive samples = auto-generate inspection work order
Rise or PQ index above 80 = escalate to oil change + vibration audit within 7 days
Rise or sudden viscosity drop beyond grade tolerance = shutdown recommendation, gearbox teardown
"
We caught a VRM thrust-bearing failure 38 days before it would have seized. The oil sample showed copper at 4× baseline and PQ at 95 — we planned the repair into a scheduled stop and saved an estimated $340K in lost production.
— Reliability Lead, 4,200 TPD integrated cement plant
CMMS Integration · Lab Result to Work Order
From lab email to routed work order — automatically
The most common reason oil analysis programs fail is not the lab — it's the gap between the result email and the work order. Results sit in inboxes, get filed, or arrive during a busy outage and are forgotten. oxmaint closes that loop by ingesting lab results via API or CSV and auto-generating work orders against your pre-set alarm rules.
Lab Result Ingested
oxmaint pulls results from your lab via API or scheduled CSV upload, parsed against asset ID and sampling point.
Alarm Rule Evaluated
Each parameter is checked against the asset's baseline trend. A 3× Fe rise or PQ > 80 triggers the pre-defined rule set.
Work Order Auto-Created
A work order is generated with priority, assigned technician, checklists, parts, and the lab report attached — no manual entry.
Trend Updated & Closed
After the WO closes, the trend chart updates with the corrective action logged for full audit traceability.
| Alarm Tier | Trigger Condition | Auto Action | SLA |
|---|---|---|---|
| Normal | All parameters within baseline ±20% | Log result, update trend, no action | — |
| Watch (Tier 1) | Any wear metal 2× baseline or viscosity ±5% | Generate inspection WO, assign to reliability tech | 14 days |
| Alarm (Tier 2) | Any wear metal 3× baseline, PQ > 60, or water > 500 ppm | Oil change + vibration audit WO, notify supervisor | 7 days |
| Critical (Tier 3) | Any wear metal 10× baseline, PQ > 100, or viscosity off-grade | Plan shutdown WO, escalate to plant manager, schedule teardown | 48 hours |
Stop reading oil reports in a spreadsheet — start acting on them
Connect your lab results to oxmaint and every critical alarm becomes a routed work order in seconds, not days.
FAQ · Oil Analysis for Cement Gearboxes
Common questions from cement plant reliability teams
How often should I sample oil from a kiln main drive gearbox?
Monthly sampling or every 1,000 operating hours is the standard for a kiln main drive, whichever comes first. The kiln runs continuously with high thermal load, so monthly gives you a tight enough trend to catch a 3× wear-metal rise before it becomes a 10× critical alarm. If you're running a new or recently rebuilt gearbox, sample every 500 hours for the first three months to establish a clean run-in baseline.
What is the most common oil analysis failure mode in cement plant gearboxes?
Cement dust ingress — silicon and aluminum rising together in the ICP results — is the dominant failure mode, especially on ball mill and conveyor gearboxes where seal integrity is hard to maintain. The second most common is EP additive depletion in high-load VRM reducers, visible as a drop in phosphorus and zinc against the new-oil reference. Both are detectable 4–6 weeks before secondary damage occurs.
Can oxmaint integrate results from any laboratory?
Yes. oxmaint ingests lab results via direct API connection for partner labs, or via scheduled CSV/email upload for any ISO 17025-accredited lab. Results are parsed by asset ID and sampling point, then evaluated against your custom alarm rules. You can set this up yourself during a Start Free Trial or have our team configure it during a demo.
How much does an oil analysis program cost for a mid-size cement plant?
A plant with 12–20 critical gearboxes typically spends $8,000–$15,000 per year on lab analysis (bottles, shipping, test slates). Against a single avoided kiln drive failure that costs $250K–$500K in parts and downtime, the program pays for itself many times over. The oxmaint CMMS layer adds the work-order automation that ensures results are actually acted on — not just filed.
Should I still do vibration analysis if I'm doing oil analysis?
Absolutely — the two techniques are complementary, not substitutes. Oil analysis detects lubricant degradation and early wear particle generation; vibration detects the mechanical symptom once geometry changes. Used together, oil typically leads vibration by 4–6 weeks on gearboxes, giving you the planning window to move from emergency to scheduled repair. Plants running both on critical gearboxes see 30–40% fewer unplanned outages.
Get Started Today
Build your cement oil analysis program in oxmaint
Connect lab results, set alarm rules, and auto-generate work orders for every critical gearbox — kiln, mill, and VRM — in one platform.
Free 14-day trial · No credit card