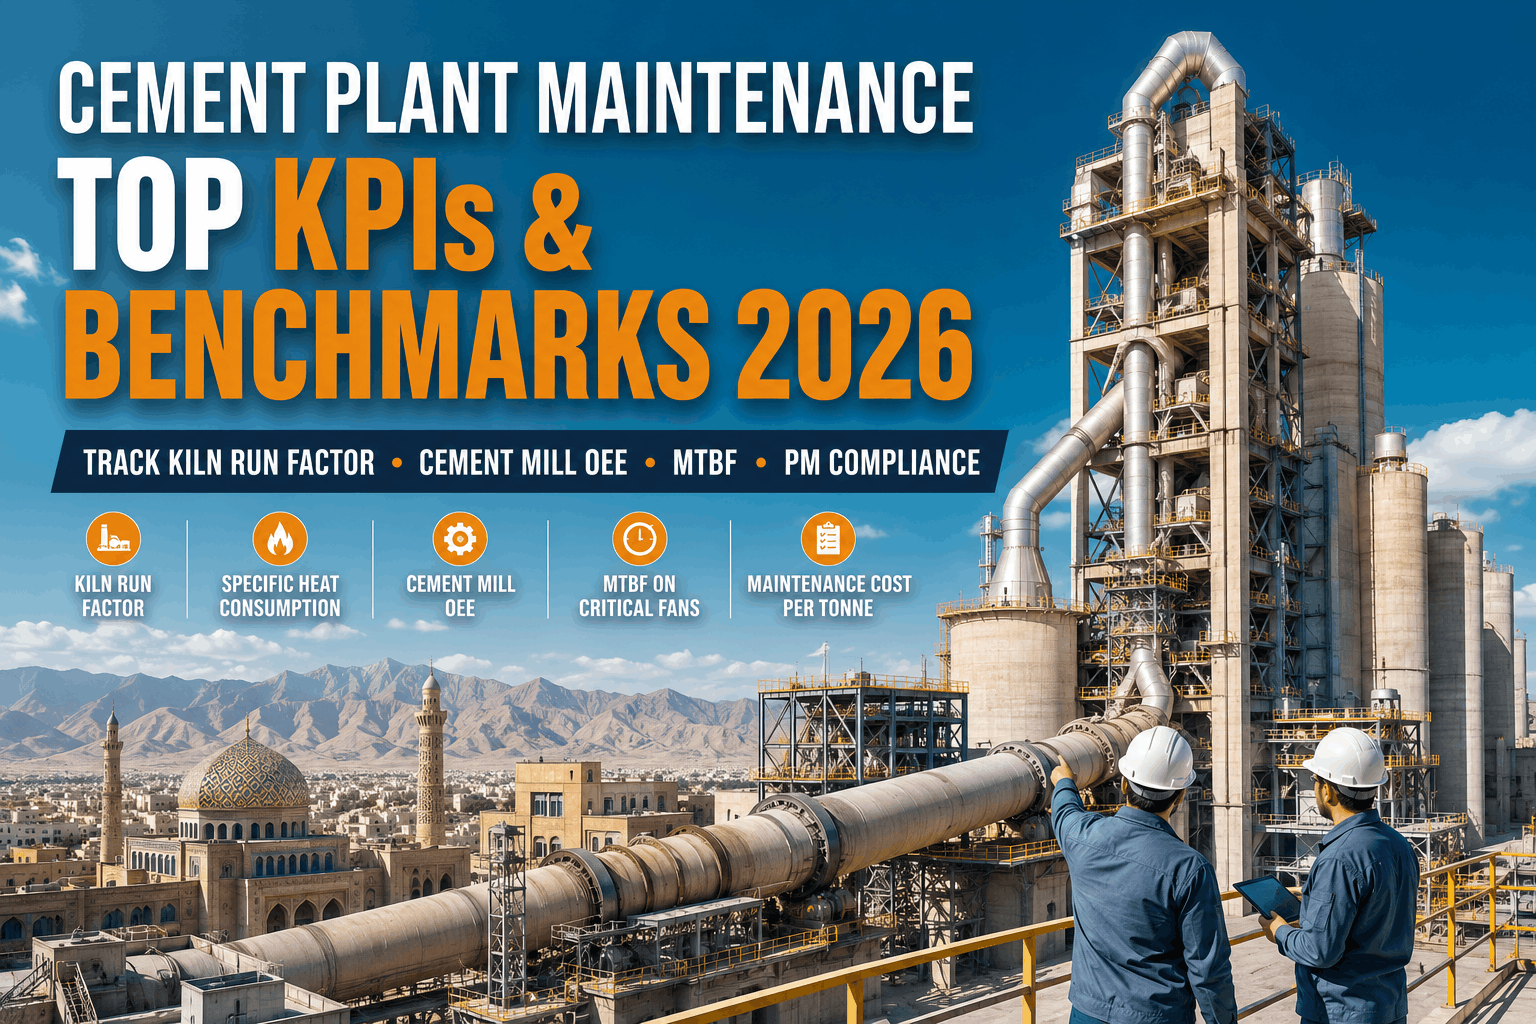
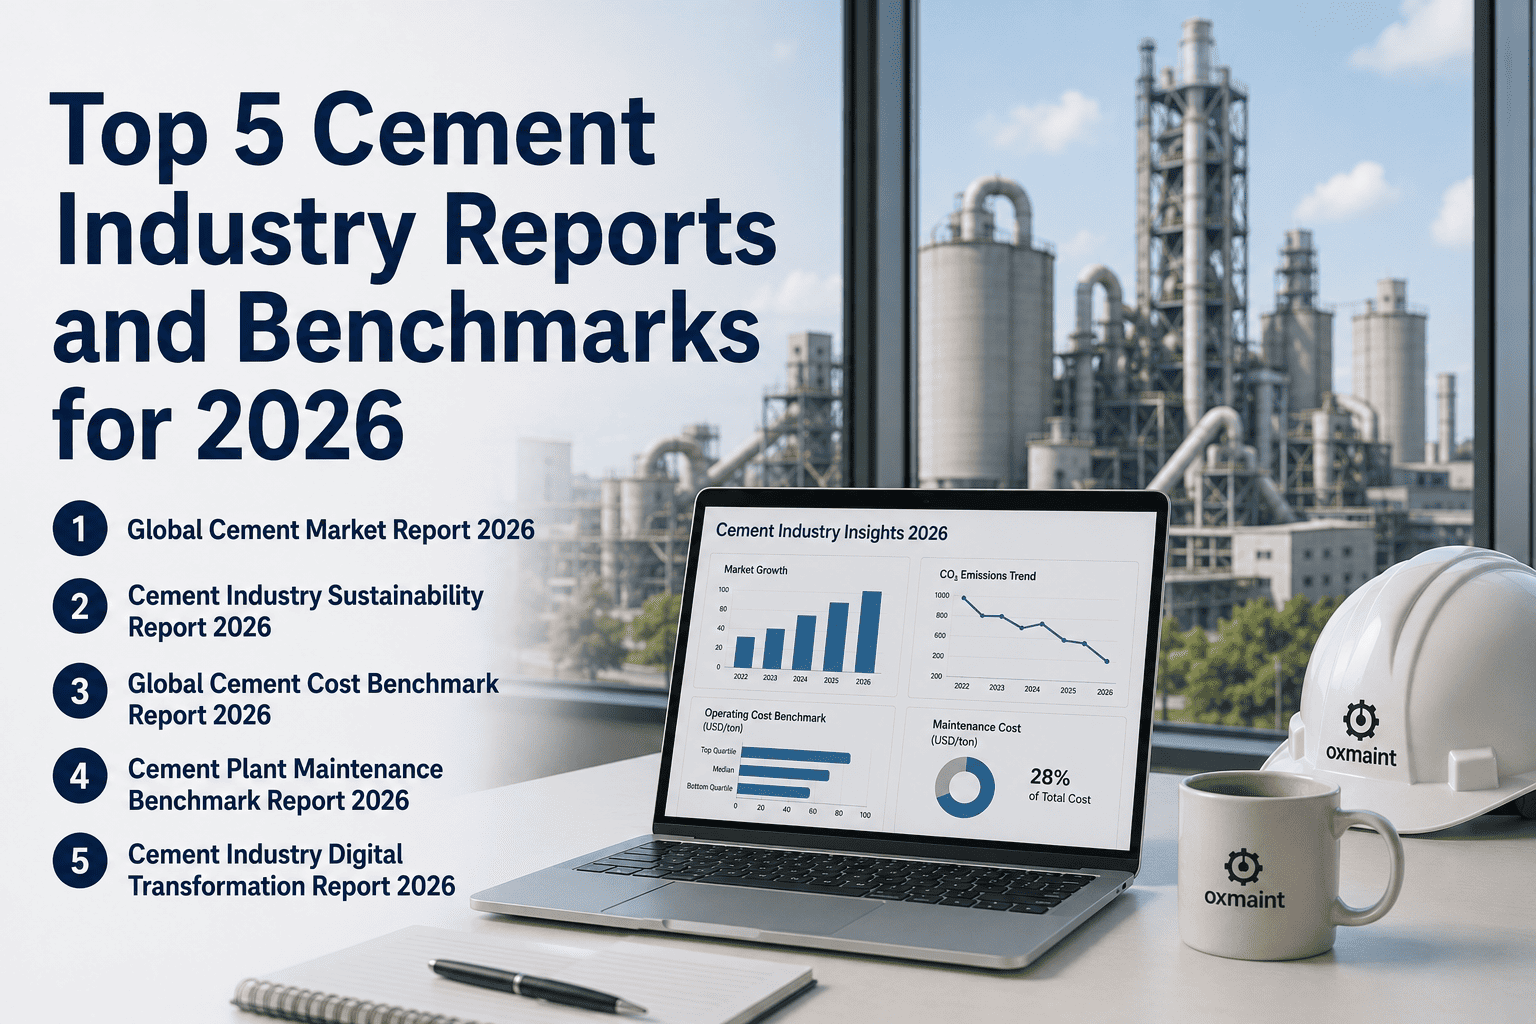
Plant managers in cement operations carry a dual accountability that few manufacturing roles share — production output measured in thousands of tonnes per day, and regulatory compliance measured in permit conditions that span NESHAP, MSHA, and environmental reporting frameworks. The KPIs that matter most in 2026 reflect both dimensions: operational efficiency metrics like kiln availability and OEE, reliability metrics like MTBF and MTTR, and sustainability metrics like specific energy consumption and AFR substitution rate. Sign Up Free to track all ten of these KPIs live in OxMaint's cement plant dashboard.
Live KPI Dashboards for Cement Plant Managers
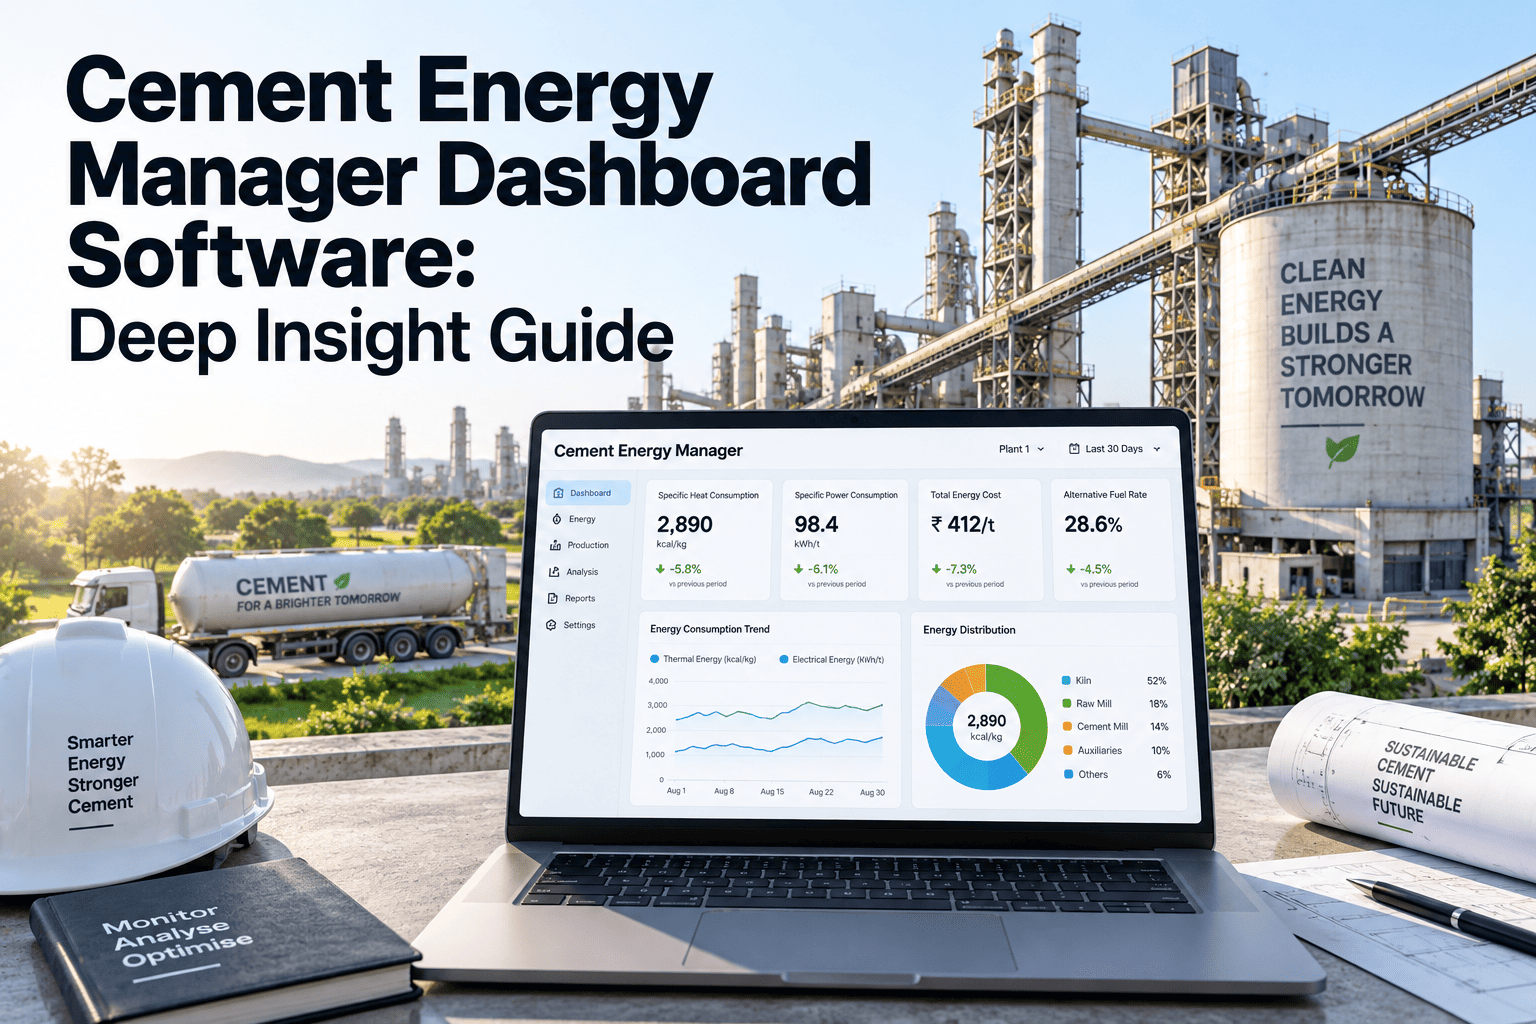
OxMaint tracks kiln availability, MTBF, MTTR, PM compliance, OEE, SEC, and AFR rate in real time — with drill-down to individual assets and work orders.
How KPIs Drive Cement Plant Maintenance Strategy
In a cement plant, the distance between a KPI on a dashboard and a maintenance decision on the shop floor is often too large. Kiln availability sits at 89% but the maintenance team doesn't know which sub-system is causing the gap. MTTR is climbing but no one can isolate whether it's response time, parts availability, or job execution. The value of tracking these ten KPIs inside a CMMS — rather than in a separate reporting tool — is that every number links directly to the work orders, assets, and technicians that created it. Clicking through a KPI leads to a root cause, not a spreadsheet.
Top 10 Cement Plant KPIs Every Plant Manager Tracks in 2026
01
Kiln Availability (%)
Total hours kiln operated divided by total scheduled hours, expressed as a percentage. Industry benchmark: 88–93% for modern dry-process kilns. Every 1% improvement in a 3,000 tpd kiln represents approximately 30 additional tonnes of clinker per day.
2026 Target 90%+
02
Overall Equipment Effectiveness — Kiln (OEE)
OEE multiplies Availability × Performance × Quality for the kiln system. A kiln running at 90% availability but 85% feed rate and 97% clinker quality delivers an OEE of approximately 74% — significantly below world-class 85% targets. OEE surfaces losses that availability alone cannot reveal.
World Class 85%+
03
Mean Time Between Failures (MTBF)
Average operating time between unplanned failures across critical cement plant equipment — kiln drives, mill circuits, coolers, and preheater fans. Rising MTBF confirms that PM programmes are catching failure precursors. A well-run cement plant targets MTBF improvement of 8–12% year-on-year for its highest-criticality assets.
Direction Increasing YoY
04
Mean Time To Repair (MTTR)
Average time from failure detection to full restoration of operation. In cement plants, long MTTR is usually caused by spare parts unavailability, contractor mobilisation delays, or diagnostic uncertainty — not job execution time. A CMMS that links failures to spare parts and pre-positions critical inventory directly compresses MTTR.
Direction Decreasing YoY
05
Preventive Maintenance Compliance (%)
Percentage of scheduled PM tasks completed on time within the planning period. PM compliance below 80% is a leading indicator of rising unplanned failures — maintenance organisations consistently find that each 10% drop in PM compliance corresponds to a 15–20% increase in corrective work volume within 90 days.
Minimum 85%
06
Specific Energy Consumption (SEC) — kWh/tonne clinker
Total electrical energy consumed divided by clinker production, measured in kWh per tonne. SEC is directly influenced by maintenance quality — worn mill internals, misaligned drives, degraded cooler grates, and poorly maintained separators all increase SEC. Best-practice cement plants target below 105 kWh/t clinker for integrated operations.
Target Below 105 kWh/t
07
AFR Substitution Rate (%)
Percentage of total thermal energy input supplied by alternative fuels and raw materials. Leading cement producers target 40–80% AFR substitution to reduce CO₂ emissions and fuel cost. Higher AFR rates increase maintenance demands on feed systems and require more rigorous wear part tracking — making CMMS integration essential at substitution rates above 20%.
Leading Plants 40–80%
08
Clinker Factor (kg clinker / kg cement)
Proportion of clinker in the final cement product. Lower clinker factors — achieved through supplementary cementitious material additions — reduce CO₂ emissions and energy intensity. The maintenance implication is that grinding circuits must be optimised for blended cement fineness targets, which shifts mill PM schedules and separator performance requirements.
Direction Decreasing
09
Refractory Campaign Length (days per campaign)
Number of operating days between kiln refractory relines. Extending campaign length from 300 to 360 days on a 3,000 tpd kiln represents approximately 180,000 additional tonnes of clinker production per campaign cycle. Campaign length is driven by refractory material selection, shell cooling management, and the quality of zone-level wear monitoring — all tracked in a CMMS.
Leading Plants 350–400 days
10
Corrective-to-Preventive Maintenance Ratio
Volume of corrective work orders divided by preventive work orders in a given period. World-class cement maintenance organisations target a ratio below 0.5 — meaning more than two preventive actions for every corrective one. A rising ratio signals that PM programmes are not covering failure modes that are actually occurring in the plant.
Target Below 0.5
KPI Benchmark Table — Cement Plant 2026
| KPI |
Poor |
Industry Average |
Best Practice |
CMMS Impact |
| Kiln Availability |
Below 82% |
85–89% |
90–93% |
High |
| OEE (Kiln) |
Below 65% |
68–75% |
80–85% |
High |
| MTBF (Critical Assets) |
Below 500 hrs |
600–900 hrs |
1,200+ hrs |
High |
| MTTR (Critical Assets) |
Above 12 hrs |
6–10 hrs |
Below 4 hrs |
High |
| PM Compliance |
Below 70% |
75–82% |
90%+ |
Direct |
| SEC (kWh/t clinker) |
Above 130 |
110–125 |
Below 105 |
Medium |
| AFR Rate |
Below 10% |
15–30% |
40–80% |
Medium |
| Campaign Length (days) |
Below 250 |
280–320 |
350–400 |
High |
| Corrective/PM Ratio |
Above 1.2 |
0.7–1.0 |
Below 0.5 |
Direct |
Expert Review
SP
Santhosh Prabhu
VP Maintenance — Pan-Asia Cement Group
"We introduced a CMMS-driven KPI dashboard that linked every kiln availability number directly to the underlying work order history. Within two months, our maintenance managers stopped debating the numbers and started fixing the causes. PM compliance went from 71% to 88% in one quarter simply because it was visible."
AK
Anita Kovačević
Plant Manager — Central European Integrated Cement Plant
"The corrective-to-preventive ratio was the single most useful metric we added to our monthly board review. When it climbed above 0.8, we knew our PM schedule had gaps. When it dropped below 0.5, we could see in the data that our refractory campaign length was extending as a result. One number told the whole story."
Frequently Asked Questions
What is the most important KPI for a cement plant manager to track in 2026?
Kiln availability remains the single most financially impactful KPI in cement plant management — a 1% improvement in kiln availability on a 3,000 tpd plant represents approximately $1.2M in additional annual revenue at current clinker prices. However, availability alone can hide performance losses, which is why OEE — which multiplies availability by feed rate performance and quality yield — is increasingly the preferred top-line metric.
OxMaint's dashboard tracks both simultaneously with drill-down to individual causes.
How does PM compliance rate affect unplanned breakdowns in cement plants?
Research across heavy process industries consistently shows that PM compliance below 80% correlates with a 15–25% increase in corrective maintenance volume within a 90-day window. In cement plants, the relationship is particularly pronounced in rotating equipment — bearings, seals, and drive couplings — where missed lubrication and inspection PMs directly increase failure probability. A CMMS like
OxMaint provides PM compliance reporting at plant, department, and individual asset levels, making it straightforward to identify where schedule slippage is creating downstream failure risk.
How should a cement plant measure and improve MTTR?
MTTR improvement in cement plants requires analysing where repair time is actually being lost — response time from failure detection to technician mobilisation, diagnostic time, parts retrieval time, and actual repair execution time each contribute differently. A CMMS captures timestamps at each stage of the work order lifecycle, allowing maintenance managers to isolate the true driver of long MTTR rather than guessing. In most cement plants, spare parts availability — specifically critical spare stock-out events — accounts for 40–60% of total MTTR.
Book a demo to see OxMaint's MTTR breakdown reporting.
What role does CMMS play in tracking specific energy consumption (SEC) in cement operations?
While SEC is primarily an energy management metric, its relationship to maintenance quality is direct and significant. Worn grinding media, misaligned kiln drives, degraded cooler grate plates, and poorly maintained separator internals all increase electrical energy consumption per tonne of clinker produced. A CMMS that tracks these components — their wear state, replacement history, and performance readings — gives maintenance engineers the asset-level data needed to identify which equipment is contributing to rising SEC, enabling targeted corrective action before energy losses become significant.
Track All 10 KPIs in One Live Dashboard
OxMaint connects every KPI to the work orders, assets, and technicians behind the number. Book a demo to see a cement plant KPI dashboard built on real maintenance data.