Cement plant operators relying on gut-feel maintenance discipline without tracked KPIs operate blind—kiln run factors drift from 89% to 84% before anyone notices, maintenance cost per tonne creeps from $2.30 to $3.50 silently, and emergency repairs compound unchecked until a forced outage destroys quarterly results. High-performing cement plants measure everything: kiln run factor weekly, specific heat consumption per tonne daily, raw mill OEE by shift, clinker cooler fan efficiency continuously, gearbox MTBF trended monthly, and maintenance cost per production unit relentlessly. Sign Up Free with Oxmaint to deploy KPI dashboards that surface run factor, heat consumption, mill OEE, fan MTBF, and cost metrics in real-time, enabling proactive intervention before metrics degrade into crisis. Book a Demo to see how Oxmaint's KPI engine reveals maintenance-driven production losses and guides investment in preventive discipline that moves the needle on profitability, throughput, and asset life.
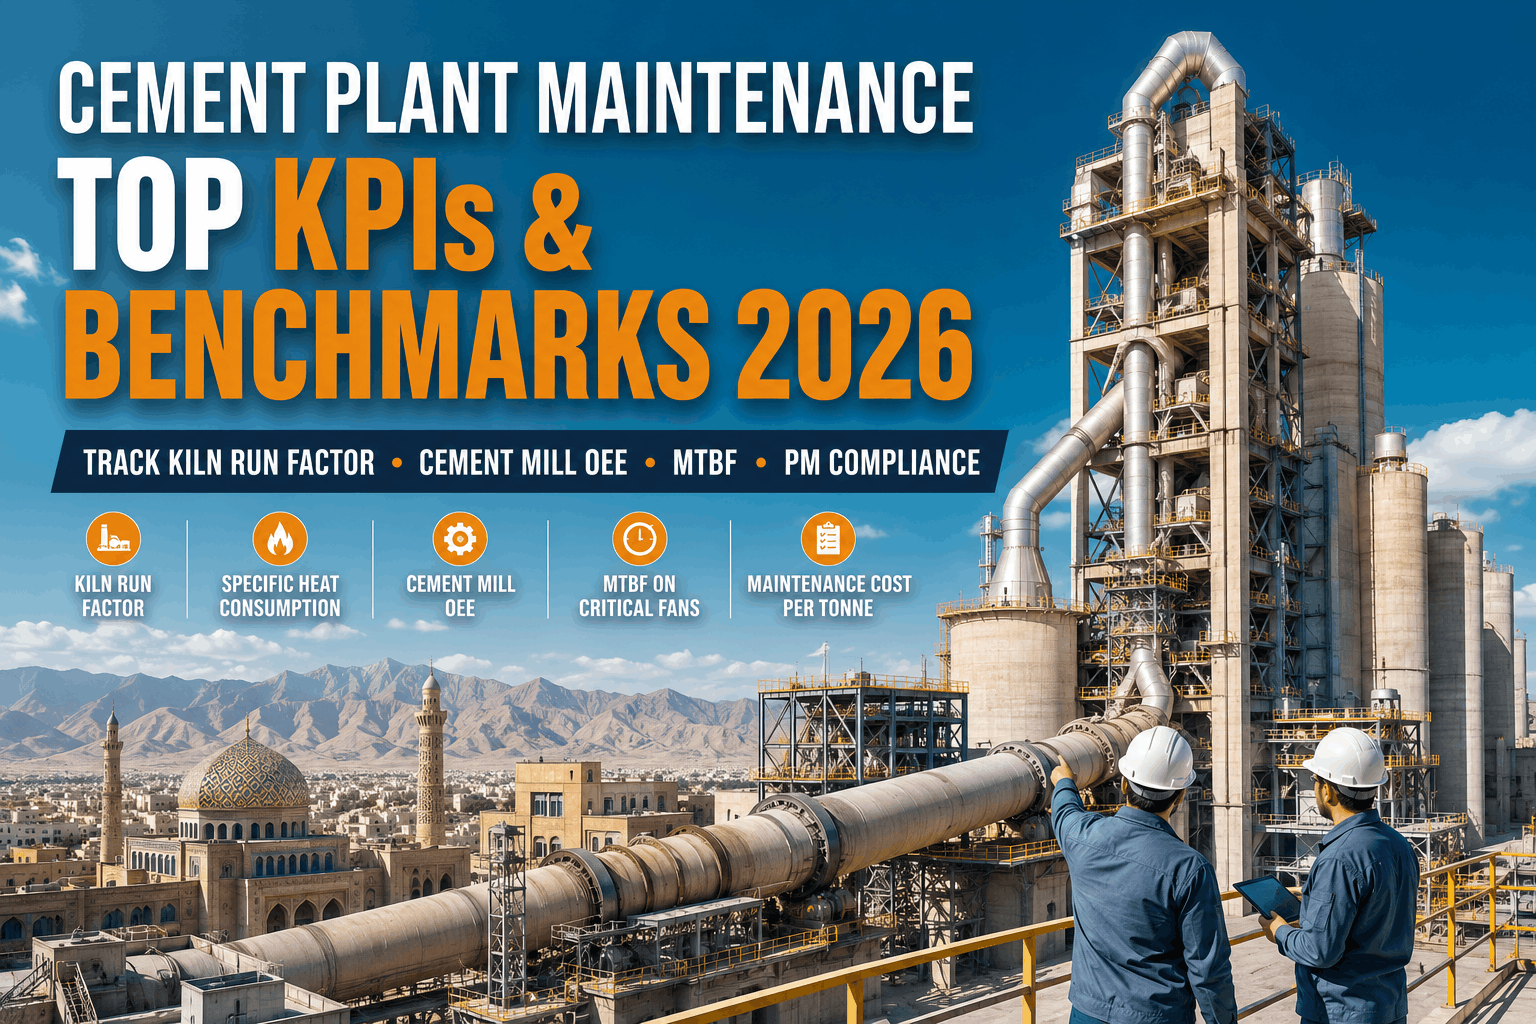
Track Cement Plant Maintenance KPIs That Directly Drive Profitability
Oxmaint KPI dashboards make kiln run factor, specific heat consumption, maintenance cost per tonne, and equipment MTBF visible daily—so you catch degradation early and prevent the emergency repairs that kill quarterly margins.
Why Maintenance KPI Tracking Is Invisible Until Run Factor Collapses—And How to Fix It
Cement plants without CMMS-based KPI tracking operate reactively: maintenance problems surface only when equipment breaks down, by which point production loss is already in motion. The gap between 96% run factor and 84% run factor is not felt suddenly; it erodes silently across 8–12 weeks as PM completion rates slip from 92% to 68%, maintenance backlog aging increases from 1.2 shifts to 4.5 shifts, and technicians spend more time investigating breakdowns than executing planned work. Specific heat consumption per tonne—the fuel cost to produce clinker—drifts invisibly: a 2% increase in heat consumption per tonne from poor kiln efficiency or fuel switching is $12,000–$18,000 per month in wasted fuel on a 1,000 TPD plant. Raw mill OEE (overall equipment effectiveness) degradation from 78% to 68% signals either declining gearbox performance, increased mill liner wear, or both—but without trended data, operations assumes the mill is "just slower today." Sign Up Free to embed live KPI tracking in your CMMS, capturing run factor hourly, heat consumption per tonne per shift, mill OEE by shift, and cost metrics automatically—so degradation is visible within days, not months.
| KPI Metric |
Industry Low Performer |
Industry Average |
Best-in-Class Target |
Business Impact of Improvement |
| Kiln Run Factor |
82–88% |
89–93% |
96–98% |
4–6% additional clinker capacity captured; ~$200K+ monthly revenue at 1000 TPD |
| Specific Heat Consumption |
3.3–3.6 MJ/kg |
3.0–3.2 MJ/kg |
2.8–3.0 MJ/kg |
0.2 MJ/kg improvement = $8K–$15K monthly fuel savings per 1000 TPD plant |
| Raw Mill OEE |
62–70% |
72–80% |
82–88% |
10-point OEE gain = 8–12% feed rate improvement; eliminates kiln starvation events |
| Maintenance Cost per Tonne |
$3.00–$3.50 |
$2.30–$2.70 |
$1.80–$2.20 |
$0.50/tonne improvement = $15K–$25K monthly savings at 1000 TPD; 60% to bottom line |
| Emergency Repair Percentage |
30–40% |
20–28% |
10–15% |
Shift to preventive discipline; spare parts supply chain improves 40–50% |
| Gearbox MTBF (Raw Mill) |
< 12 months |
18–24 months |
36–48 months |
Oil analysis discipline extends gearbox life 50–100%; prevents catastrophic failure shutdowns |
| PM Completion Rate |
60–70% |
78–86% |
92–96% |
Scheduled PM execution discipline correlates directly with run factor improvement |
Core Cement Plant Maintenance KPIs: Run Factor, Heat Consumption, OEE, MTBF, and Cost Metrics
Cement plant KPI frameworks collapse into two categories: production-side metrics (run factor, specific heat consumption, mill OEE, clinker quality grades) and maintenance-side metrics (emergency repair rate, PM completion rate, mean time between failures for critical assets, maintenance cost per tonne, open work queue age). The two categories are inseparable: poor maintenance discipline degrades production KPIs within 2–4 weeks. Kiln run factor below 90% is almost always a maintenance problem, not a demand problem. Raw mill OEE below 75% signals gearbox or motor degradation needing immediate condition assessment. Specific heat consumption creeping above 3.2 MJ/kg indicates kiln efficiency loss from fuel switching, refractory wear, or clinker cooler underperformance—each requiring targeted maintenance intervention. Book a Demo to see how Oxmaint connects maintenance KPIs directly to production outcomes, showing operations teams exactly where maintenance discipline is failing and how much it costs in real time.
KPI 01
Kiln Run Factor
Current: Track Hourly
Target: 96–98%
Percentage of calendar time kiln runs uninterrupted. Every 1% below 96% = 1% lost production capacity. At 1000 TPD, 1% run factor loss = $200K monthly revenue loss. Driven by PM completion rate, asset reliability, and shift handover discipline.
KPI 02
Specific Heat Consumption (MJ/kg Clinker)
Current: Track Daily
Target: 2.8–3.0 MJ/kg
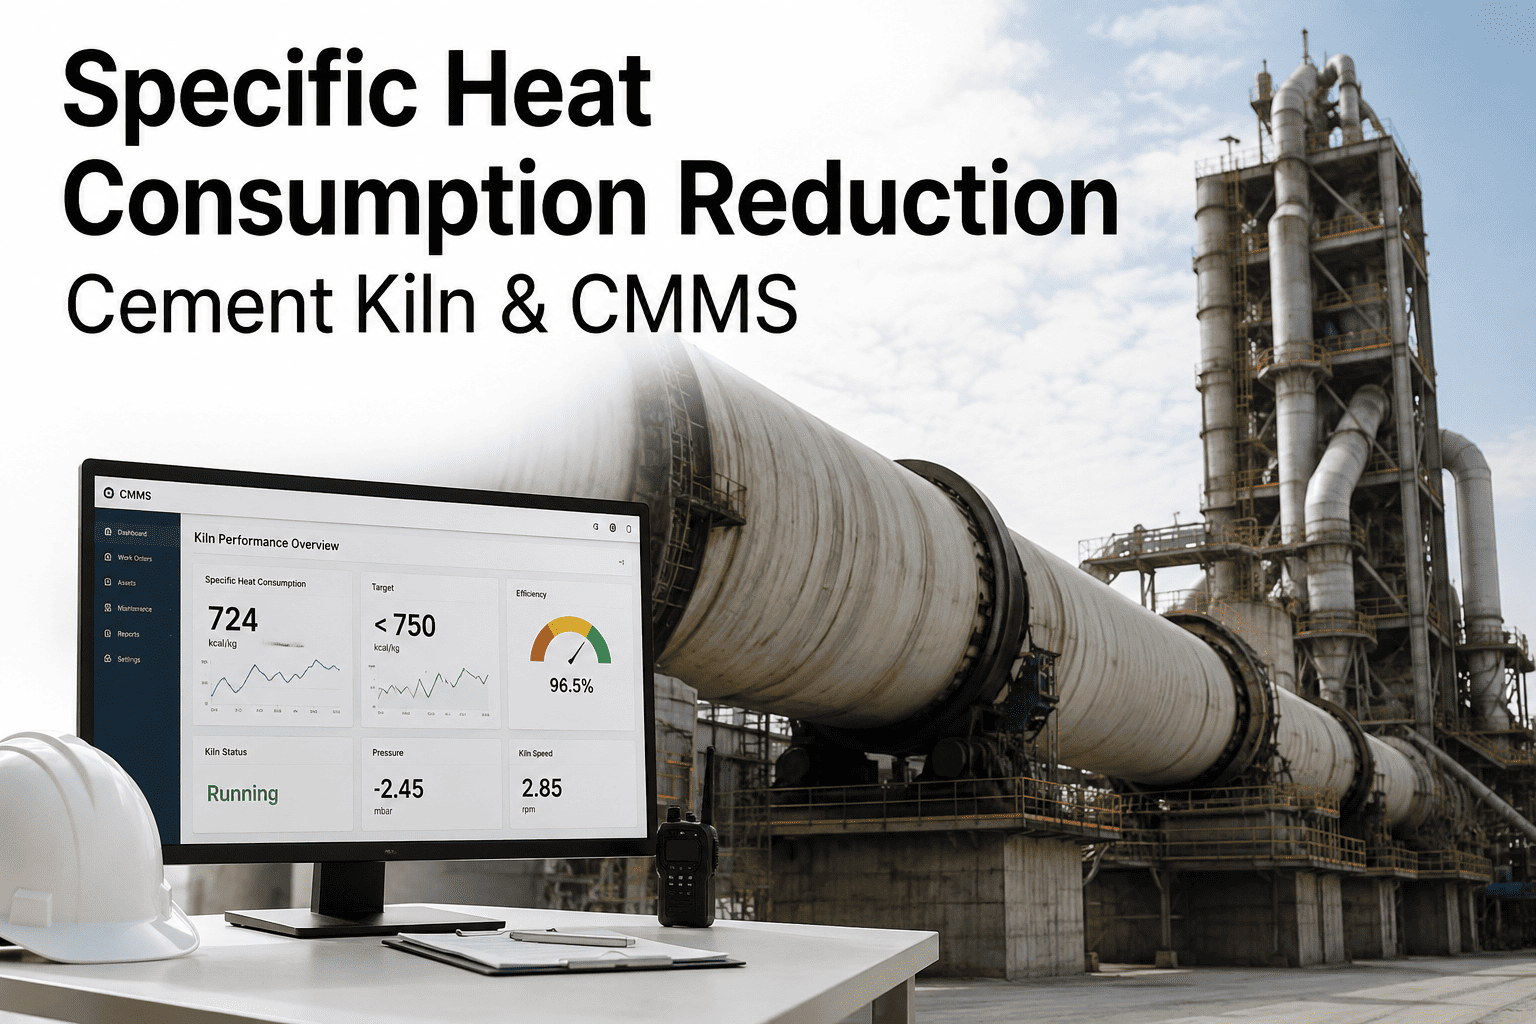
Energy (fuel + electricity) consumed per kg clinker produced. Industry average 3.0–3.2 MJ/kg; best-in-class 2.8–3.0. Each 0.2 MJ/kg increase = $8K–$15K monthly fuel cost on 1000 TPD. Maintenance drivers: kiln efficiency, cooler performance, mill efficiency.
KPI 03
Raw Mill Overall Equipment Effectiveness (OEE)
Current: Track Per Shift
Target: 82–88%
Product of Availability × Performance × Quality. Industry low performers 62–70%; best-in-class 82–88%. OEE below 72% signals gearbox, motor, or liner condition problems. 10-point OEE gain = 8–12% throughput improvement without capex investment.
KPI 04
Maintenance Cost per Tonne Clinker
Current: Track Monthly
Target: $1.80–$2.20
Total maintenance spend (labor + materials + contractors) ÷ clinker production tonnes. Low performers $3.00–$3.50; best-in-class $1.80–$2.20. $0.50/tonne improvement = $15K–$25K monthly bottom-line impact. Driven by emergency repair percentage and PM discipline.
KPI 05
Emergency Repair Percentage of Total Maintenance
Current: Track Weekly
Target: 10–15%
Unplanned maintenance spending as % of total maintenance budget. Low performers 30–40%; best-in-class 10–15%. Shift from reactive to CMMS-driven strategy within 6–9 months reduces this 50–60%. Spare parts optimization and workforce efficiency improve dramatically.
KPI 06
Gearbox Mean Time Between Failures (MTBF)
Current: Track Trended
Target: 36–48 Months
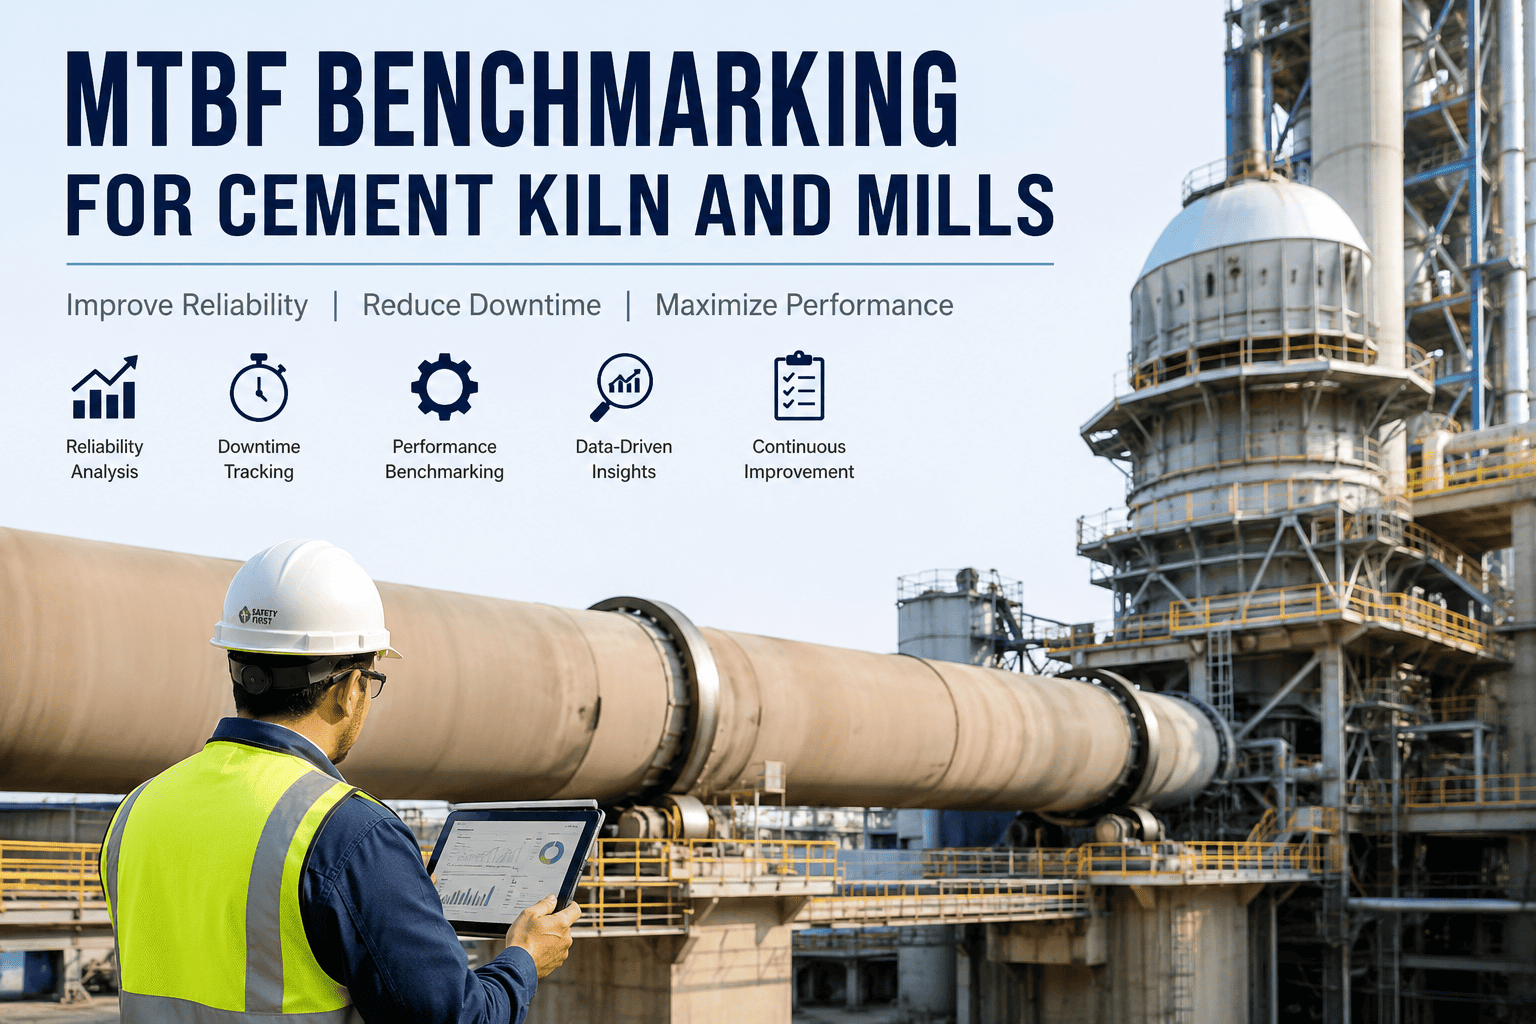
Average operating hours/months between gearbox failures (raw mill, cooler fans, etc.). Oil analysis discipline extends MTBF 50–100%. Low performers <12 months; best-in-class 36–48 months. Every month gained = $50K–$100K in prevented catastrophic failure downtime.
Deploying Cement Plant Maintenance KPI Dashboards: From Data Collection to Real-Time Decision-Making
Building KPI discipline requires three phases: data infrastructure (connecting production meters and CMMS to automated dashboards), threshold definition (establishing targets and alert triggers), and accountability embedding (assigning KPI owners and review cadences). Most cement plants fail at phase one—they collect data manually, store it in spreadsheets, and review it monthly. By month-end, 3–4 weeks of degradation has already passed uncorrected. Sign Up Free with Oxmaint to automate KPI collection from production systems and CMMS, surface alerts when thresholds cross in real-time, and enable shift-by-shift KPI monitoring that catches problems within hours instead of weeks.
Phase 1:
Data Integration & Automated Capture
Connect production SCADA/DCS (kiln throughput, specific heat consumption, cooler air flows) to CMMS real-time data feed. Link maintenance module (work orders, PM completion, emergency repairs, open queue) to KPI engine. Establish baseline KPI targets from current 3-month rolling average and industry benchmarks.
Phase 2:
Threshold Definition & Alert Configuration
Set run factor alert at 93% (yellow flag), 90% (red flag). Heat consumption alert at 3.1 MJ/kg (yellow), 3.3 (red). Mill OEE alert at 76% (yellow), 72% (red). Configure escalation: shift supervisor alert at yellow, plant manager alert at red. Enable SMS/email push for critical threshold crosses.
Phase 3:
Accountability & Review Cadence
Daily 15-minute operations huddle: review prior 24-hour KPIs, surface degradation, assign root cause investigation. Weekly maintenance review: run factor trend, emergency repair backlog, PM completion rate. Monthly business review: maintenance cost per tonne vs. budget, MTBF trended, capex ROI on new equipment.
Common KPI Degradation Patterns and Early Intervention Triggers
Cement plant KPIs degrade predictably, and patterns reveal root cause. Run factor dropping 1–2% per week with stable heat consumption signals equipment reliability issue (kiln bearings, drive coupling, raw mill gearbox). Run factor flat but heat consumption rising 0.3–0.5 MJ/kg per month signals cooler underperformance or kiln efficiency loss (refractory wear, feed chemistry drift). Mill OEE dropping below 75% while maintenance cost rises signals gearbox or motor condition degradation requiring immediate oil analysis and vibration check. Understanding these patterns enables targeted maintenance intervention—fix the cooler fan blade erosion, not the entire cooler system.
Run Factor Cliff (Dropping 3–5% Over 2–3 Weeks)
Indicates sudden equipment failure (kiln drive coupling, raw mill gearbox bearing, cooler motor). Requires emergency intervention: immediate asset condition inspection, spare parts pre-positioning, crew overtime planning. Cost: $50K–$200K depending on failure type.
Heat Consumption Drift (0.2–0.3 MJ/kg Per Month)
Signals kiln refractory wear, fuel switching, or cooler fouling. Slower onset allows planned corrective action (brick inspection, cooler cleaning, fuel supplier change). Intervention window: 2–4 weeks. Delay costs $8K–$15K monthly in wasted fuel.
Mill OEE Sliding (2–3% Per Week)
Gearbox oil degradation, motor bearing wear, or liner buildup. Oil analysis detects spalling 2–4 weeks before seizure. Intervention: schedule gearbox replacement during next planned maintenance window. Delay risks catastrophic failure and 2–3 day emergency reline.
PM Completion Rate Dropping Below 85%
Indicates workload imbalance or priority confusion in maintenance department. Correlates with rising emergency repair percentage within 1–2 weeks. Intervention: crew staffing assessment, priority reset, handover discipline review.
Maintenance Cost per Tonne Rising 10%+ Over Quarter
Mix of emergency repairs spiking and spare parts spending increasing. Root cause: combination of deferred PM and asset reliability degradation. Intervention: spare parts optimization analysis, contractor benchmarking, emergency repair rate cap enforcement.
Clinker Quality Grade Slipping or Consistency Dropping
Often missed as a maintenance KPI but tied directly to kiln stability, raw mill feed consistency, and cooler product temperature control. Degradation signals kiln PM backlog or cooler underperformance. Maintenance intervention targets: kiln thermal control, mill feed consistency, cooler performance verification.
Make Maintenance KPI Degradation Visible Before It Costs You Millions
Oxmaint KPI dashboards surface run factor, heat consumption, mill OEE, equipment MTBF, and cost metrics in real-time—so operations teams catch problems within hours and maintenance leaders drive decisions backed by data.
KPI Best Practices for Cement Plants: Benchmarking, Trending, and Industry Standards
Benchmark Against Peer Plants, Not Against Yesterday: Comparing your run factor to a competitor's published report drives continuous improvement faster than comparing month-to-month. Access industry KPI databases (Global Cement, Cement & Concrete, plant-specific MRI reports) to identify gaps vs. best-in-class peers. Target the 75th percentile plant first, then push toward 90th percentile.
Trend KPIs Weekly, Not Monthly: Monthly KPI reviews capture only end-state; weekly trending reveals degradation patterns within days. Set up automated weekly dashboard delivery to shift supervisors, plant manager, and maintenance lead. Flag >5% week-over-week variance for immediate investigation.
Link Maintenance KPIs to Production Outcomes Dollar by Dollar: Every 1% run factor improvement = $X monthly revenue (calculate per your plant capacity). Every 0.1 MJ/kg heat consumption gain = $Y monthly fuel savings. Make these connections explicit in KPI dashboards. Operations teams act differently when they see their PM discipline decision mapped to revenue impact.
Establish Threshold Escalation: Yellow > Red > Emergency: Don't set KPI targets and ignore them. Yellow alert (threshold crossed 5% from target) → shift supervisor investigation. Red alert (threshold crossed 10%) → plant manager notification + root cause assignment. Emergency (threshold crossed 15%) → executive escalation + resource mobilization.
Assign KPI Ownership with Clear Accountability: Run factor owner: Plant Manager. Heat consumption owner: Operations Lead. Mill OEE owner: Mill Section Head. Maintenance cost per tonne owner: Maintenance Manager. Rotate quarterly to build cross-functional KPI literacy.
Compare Actual Performance to Budget at Month-End: Budget line: "Maintenance cost per tonne $2.40." Actual: $2.68. Variance: +$0.28/tonne (12% overage). Link overage to emergency repair spike or PM backlog. Use this analysis to reset targets or identify systemic issues requiring intervention.
Cement Plant Maintenance KPI Benchmarks and Frequently Asked Questions
What is the industry benchmark for cement plant kiln run factor?
Industry average is 89–93%; best-in-class plants achieve 96–98%. Benchmark your plant against competitors in your region and capacity tier. Target 95%+ within 12 months of CMMS deployment.
How much does a 1% run factor loss cost per month?
At 1000 TPD, 1% run factor = 10 TPD lost production = $200K–$300K monthly revenue loss (at $20–$30/tonne clinker price). Investing 5–10% of that loss in maintenance discipline to prevent it is highly profitable.
What is specific heat consumption and why does it matter for KPI tracking?
Specific heat consumption (MJ/kg clinker) measures energy efficiency in production. Industry range 2.8–3.6 MJ/kg; best-in-class 2.8–3.0. Each 0.1 MJ/kg improvement saves $4K–$8K monthly on fuel costs and reflects quality kiln maintenance discipline.
How do I calculate raw mill OEE and what does it tell me about maintenance?
OEE = (Availability % × Performance % × Quality %) / 100. OEE below 75% indicates gearbox wear, motor degradation, or liner buildup. OEE trending downward signals maintenance problems 2–3 weeks before equipment failure occurs.
What percentage of maintenance budget should be emergency repairs?
Industry best practice: emergency repairs 10–15% of total maintenance budget. Above 25% signals reactive culture and insufficient preventive discipline. Shifting to CMMS-driven maintenance strategy reduces this 50–60% within 6–9 months.
How does PM completion rate connect to kiln run factor?
PM completion rates above 90% correlate directly with run factors above 94%. Below 80% completion predicts run factor dropping below 88% within 2–3 weeks. CMMS-enforced PM discipline is the leading indicator of production reliability.
What is a reasonable MTBF target for raw mill gearboxes?
Industry average 18–24 months; best-in-class 36–48 months with monthly oil analysis. Low performers <12 months. Extending MTBF from 18 to 36 months via oil analysis discipline saves $50K–$100K in emergency repair costs and unplanned downtime per year.
"We didn't realize how badly our KPIs had drifted until Oxmaint showed us the data. Run factor was 87%, specific heat was 3.4 MJ/kg, and emergency repairs were 28% of budget. Within eight weeks of deploying Oxmaint dashboards, we had daily KPI visibility and our operations team started acting on threshold alerts the same day. Six months in: run factor 94%, heat consumption 3.0 MJ/kg, emergency repairs 14%. That's $180K in monthly fuel savings and $120K in reduced emergency repair costs. The KPI visibility alone justified the CMMS investment—the rest is just operational discipline."
Sanjay Patel
Plant Manager, ACC Cement (Gujarat, India)
Stop Flying Blind—Deploy Real-Time KPI Dashboards Today
Oxmaint KPI engine tracks kiln run factor, specific heat consumption, mill OEE, equipment MTBF, and maintenance cost per tonne in real-time—so you catch degradation within hours and drive maintenance decisions backed by data.