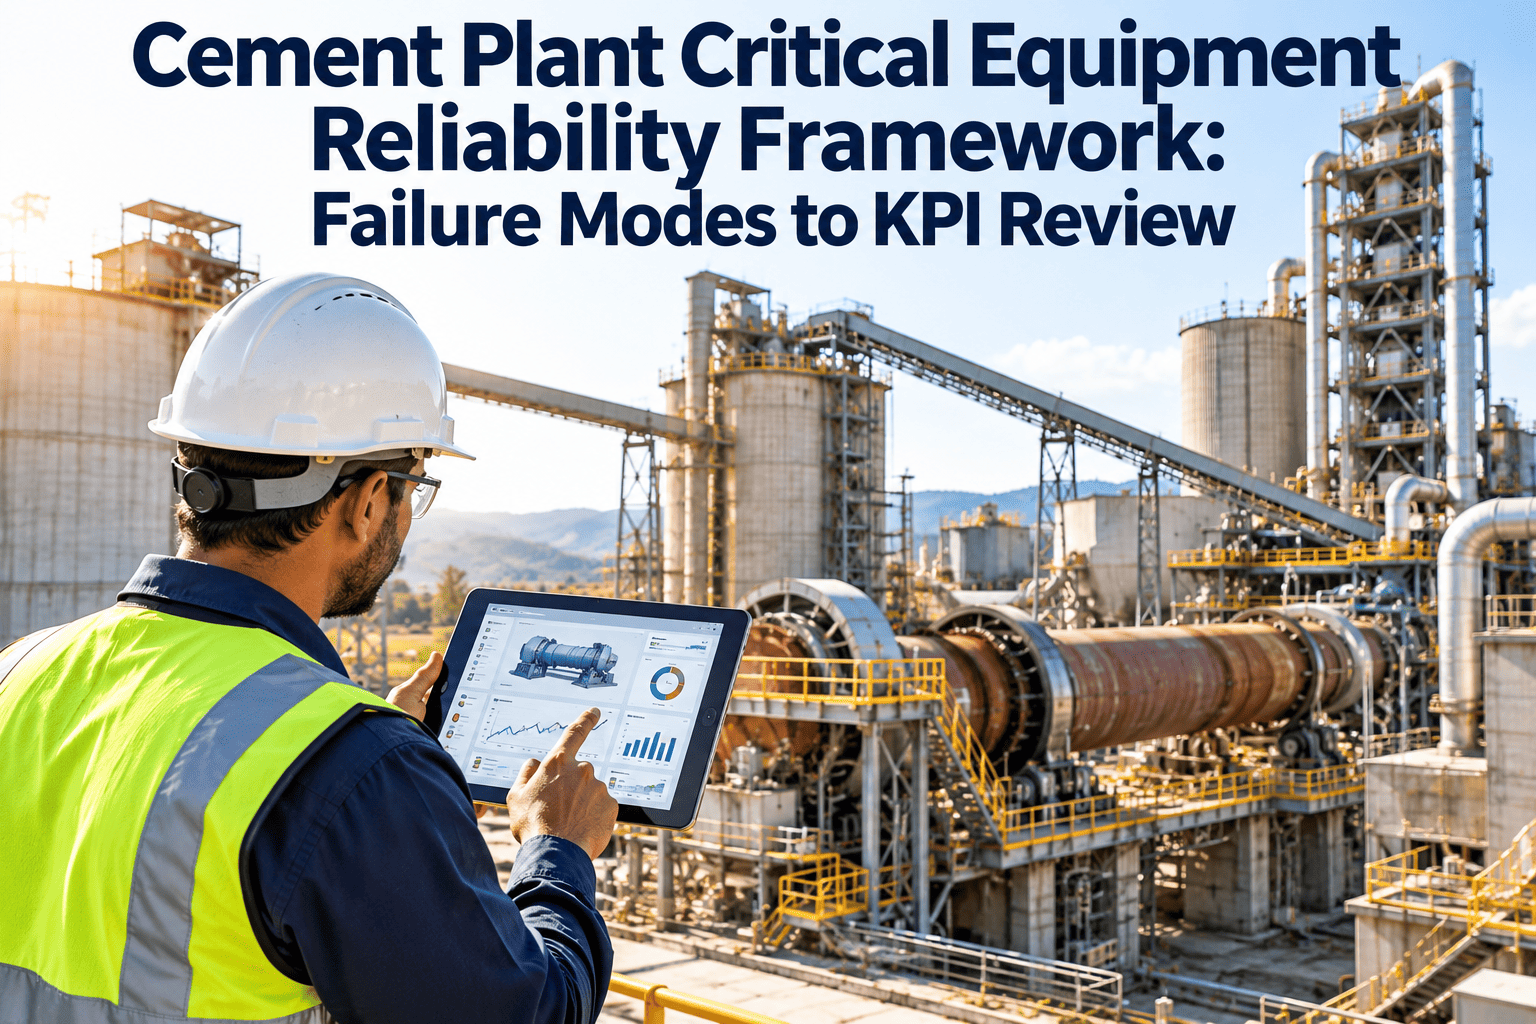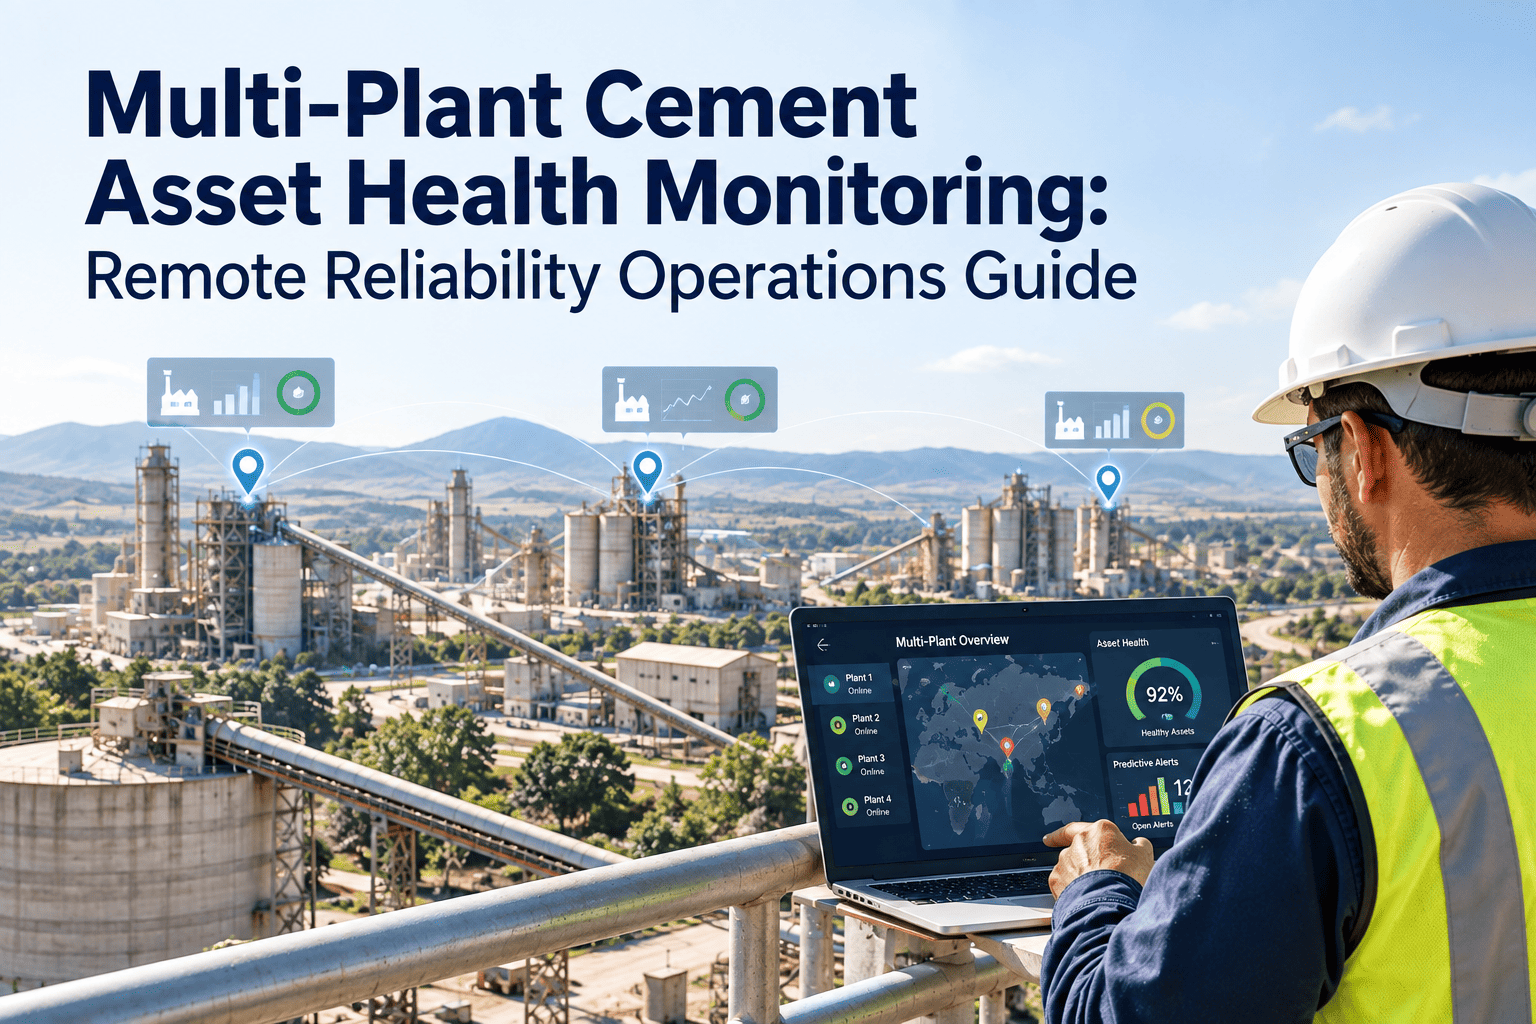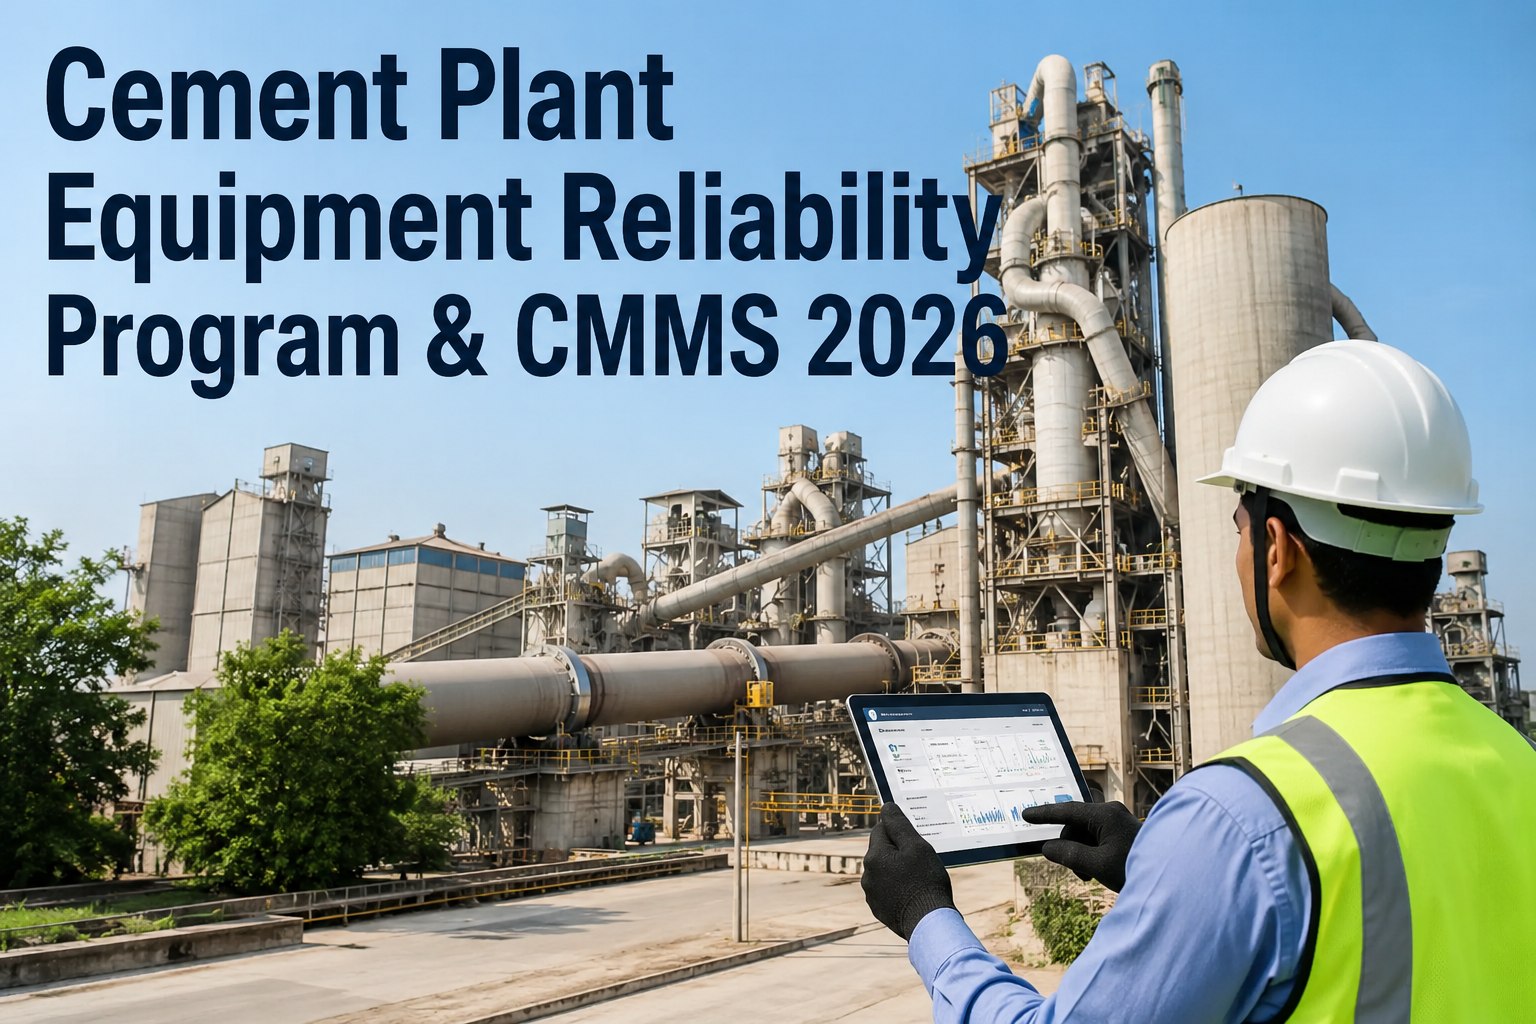
Cement plants rarely miss an emissions target because of one dramatic event. More often, a worn kiln seal, a leaking bag filter bag, a drifting analyzer, or an unstable fuel feeder slowly pushes dust, NOx, SO2, CO, or CO2 per tonne in the wrong direction. This guide lists the emissions KPIs maintenance leaders should track, explains how each one links to equipment condition, and shows how to turn the numbers into work orders. It also covers how Oxmaint maintenance software can hold the inspection, calibration, and repair records behind every KPI.
Top Cement Plant Emissions KPIs for Maintenance Leaders
Emissions are an outcome of equipment health. Track the right KPIs and every excursion points back to a machine, a task, and an owner.
Why emissions KPIs belong on the maintenance agenda
Environmental teams usually own the permit and the report. Maintenance owns the equipment that decides whether the numbers pass. When the two groups use separate data, causes are found late.
Reporting-only KPIs
- Monthly dust, NOx, and SO2 averages sent to compliance
- CO2 per tonne reported after the period closes
- No link between a spike and a failed component
- Maintenance learns about excursions from an email
- Corrective action depends on who remembers the event
Maintenance-linked KPIs
- Emissions trends reviewed next to equipment alarms and faults
- Leading indicators such as filter pressure drop and fan vibration
- Every excursion checked against recent work orders
- Corrective tasks raised with a priority and a due date
- Closure only after a follow-up reading confirms the fix
Where cement plant emissions come from
Most emissions leave through the kiln stack, with additional dust sources at coolers, mills, transfer points, and storage. Each pollutant responds to a different group of assets.
Particulate matter
Kiln and raw mill stack, clinker cooler, cement mills, conveyors, silos. Watch bag filters, ESP fields, dampers, seals, and rotary valves.Nitrogen oxides
Formed in the high temperature burning zone. Burner condition, flame stability, fuel feed accuracy, and any SNCR dosing system matter most.Sulphur dioxide
Linked to sulphur in raw materials and fuels. Preheater build-up, raw mill operation, and any scrubber or absorbent dosing equipment influence results.Carbon monoxide
Signals incomplete combustion or unstable operation. It often appears when fuel feeders surge, kiln draft falters, or a fan underperforms.Carbon dioxide
Process emissions from calcination plus fuel emissions. Maintenance affects the fuel part through heat efficiency, false air, and kiln run time.Trace and site specific items
Depending on the permit, this can include TOC, HCl, HF, ammonia, mercury, and metals, especially where alternative fuels are used.The KPI scorecard maintenance leaders should track
Use this scorecard as a starting set. Confirm exact definitions, units, and averaging periods with your environmental permit and group reporting rules. Record the data source, the unit, and the owner of every KPI so that numbers stay comparable from one review to the next.
| KPI | What it shows | Typical calculation | Maintenance lever |
|---|---|---|---|
| Stack dust concentration | Filter and ESP performance | Measured mg per normal cubic metre, against limit | Bag and cage condition, ESP field health, hopper and valve checks |
| NOx concentration | Combustion and control stability | Measured mg per normal cubic metre, against limit | Burner inspection, feeder accuracy, reagent dosing equipment |
| SO2 concentration | Sulphur capture and process stability | Measured mg per normal cubic metre, against limit | Preheater cleaning, raw mill availability, absorbent system checks |
| CO excursions and trips | Combustion upsets, ESP safety trips | Count and duration of events per month | Fuel feed reliability, ID fan condition, gas analyzer checks |
| Specific CO2 per tonne of clinker or cement | Overall carbon intensity | Reported CO2 divided by production | Kiln run factor, heat loss reduction, false air control |
| Specific thermal energy | Fuel efficiency of the kiln line | Fuel heat input per tonne of clinker | Refractory, seals, cooler efficiency, preheater condition |
| Alternative fuel substitution rate | Share of heat from non fossil or waste fuels | Alternative fuel heat divided by total heat | Fuel handling, dosing, and feed system reliability |
| CEMS availability | Data completeness for compliance | Valid monitoring hours divided by operating hours | Analyzer service, sample line, probe, and filter maintenance |
| Calibration and QA compliance | Data credibility | Checks completed on time divided by checks due | Scheduled calibration and verification work orders |
| Filter differential pressure | Early sign of blinding, leaks, or cleaning faults | Trend against baseline for each filter | Cleaning system, compressed air, bag replacement planning |
| Kiln run factor | Stability, fewer start ups and shutdowns | Kiln operating hours divided by calendar hours | Reliability of kiln drive, fans, feeders, and preheater |
| Excursions with confirmed equipment cause | Maturity of root cause tracking | Excursions with a recorded cause divided by total excursions | Structured fault and cause codes on work orders |
Lagging, operating, and leading KPIs: build the ladder
Outcome KPIs tell you a limit was approached. Leading KPIs tell you why, and early enough to act. A strong scorecard includes all three levels.
Outcome level
Stack concentrations, CO2 per tonne, permit exceedance hours, and annual reported totals. These are what regulators, investors, and customers see.Operating level
Kiln run factor, specific heat consumption, CO trips, substitution rate, and raw mill on time. These explain trends in the outcome KPIs.Equipment health level
Filter pressure drop, fan vibration, seal condition, feeder calibration status, analyzer drift, and overdue inspections. These warn you before the first two levels move.Connect every emissions KPI to the asset behind it
Schedule inspections, calibrations, and filter checks in one system, and keep a clear record every time an excursion is traced to equipment.
From equipment failure to emissions excursion
Use this matrix to rank which assets deserve the tightest preventive maintenance. Adjust the placement to match your own failure history.
Root causes behind the most common emissions KPI misses
Most deviations follow a small number of patterns. Capturing them as cause codes makes later analysis far easier.
A 90 day plan to launch an emissions KPI program
You can start with existing data. The priority is to agree definitions, assign owners, and connect KPIs to maintenance records.
Define and baseline
List emission related assets, confirm permit limits and KPI definitions, and gather twelve months of data. Identify the gaps in analyzer, filter, and fan records.Schedule and standardize
Create recurring inspection and calibration tasks, set cause codes for excursions, and agree a response routine between process, environmental, and maintenance teams.Review and improve
Run a weekly KPI review, compare excursions with work history, and adjust intervals for assets that show repeat problems.The weekly emissions reliability review
A short, consistent meeting is more useful than a long monthly report. Keep it to the same six steps every week.
- ScanReview stack KPIs and any limit approaches
- MatchCompare events with alarms, trips, and shutdowns
- CheckReview open and overdue inspections and calibrations
- AssignRaise corrective work orders with owners and dates
- PlanFit repairs into the next stop or planned window
- VerifyConfirm the KPI recovered after the fix
Compliance, data quality, and audit readiness
Emissions data is only useful if regulators and auditors trust it. Maintenance records are part of that trust.
Permit conditions
Limits, averaging periods, and monitoring duties differ by country and site. Treat the permit as the master source for KPI definitions.CEMS quality assurance
Continuous monitoring systems normally require documented calibration, verification, and maintenance. Standards such as EN 14181 apply in many regions.Carbon reporting
Many cement producers report using frameworks such as the GCCA and CSI protocols or an emissions trading scheme, which need traceable data.Audit trail
Auditors look for dated inspections, calibration results, repairs, and evidence that deviations were investigated and closed.Trends shaping cement emissions maintenance
Decarbonization targets are changing what the maintenance team is asked to protect.
More alternative fuels
Higher substitution rates increase demands on fuel storage, conveying, dosing, and burner reliability, and may add new trace emission monitoring needs.Lower clinker factor
Blended cements cut CO2 per tonne of cement, but add handling and grinding of additional materials that need stable equipment.Condition monitoring
Vibration, temperature, and differential pressure trends on fans and filters help teams act before an excursion occurs.Carbon capture readiness
Capture and utilization projects will rely on stable flue gas conditions, which makes upstream kiln and gas cleaning reliability more important.
How Oxmaint supports emissions KPI management
Oxmaint is maintenance management software. It does not replace your CEMS or process control system, but it organizes the maintenance work that keeps those systems and the equipment behind them dependable.
Preventive maintenance and calibration scheduling
Recurring tasks for analyzers, probes, filters, fans, and feeders so checks are not missed.Mobile inspections
Technicians record pressure readings, observations, and photos at the asset during rounds.Corrective work orders
Raise and track work when an excursion is traced to equipment, with a verification step before closure.Asset history
Keep kiln line, gas cleaning, and monitoring assets in one hierarchy with full repair history.Compliance records and dashboards
Maintain an auditable trail and report calibration compliance, backlog, and repeat failures.Spare parts inventory
Track filter bags, cages, valves, probes, and sample line parts to shorten repairs.Starter checklist for emissions related equipment
Set exact intervals from manufacturer guidance, permit duties, and your own failure history.
Every shift or daily
- Review CEMS status alarms and data validity
- Check filter differential pressure against baseline
- Confirm compressed air pressure for filter cleaning
- Walk stack, filter, and transfer points for visible dust
Weekly and monthly
- Inspect sample lines, probes, and heated line temperatures
- Verify analyzer zero and span as procedures require
- Check rotary valves, screws, and hopper discharge
- Review fan vibration and bearing temperature trends
Planned shutdown
- Inspect bags, cages, tube sheets, and ESP internals
- Check kiln seals, burner, and preheater build-up
- Service analyzers and replace consumables
- Review all open emissions related corrective tasks
Cement emissions KPI FAQs
Which emissions KPI should maintenance track first?
Start with CEMS availability, calibration compliance, and filter differential pressure, since they are fully within maintenance control.
Can maintenance really influence CO2 per tonne?
Yes, partly. Kiln run factor, false air, refractory, and cooler condition affect fuel use, while process emissions depend on chemistry.
How often should emissions analyzers be calibrated?
Follow the permit, standard, and manufacturer guidance. A CMMS helps by scheduling each check and storing results.
How do I link a dust spike to equipment?
Record the event time, then check filter, ESP, and valve history. Oxmaint keeps that history together.
Where should a cement plant begin?
Begin with the analyzers and gas cleaning assets. Book a demo to plan the setup.
Turn emissions KPIs into reliable maintenance action
Give maintenance, process, and environmental teams one record of every inspection, calibration, and repair that protects your emissions performance.